Best Embedded Analytics Tools for SaaS Teams in 2026
Compare 17 embedded analytics tools for 2026, including Luzmo, Metabase, Power BI, and Looker, with pricing, white labeling, and estimated costs at 500 users.
Embedded analytics is no longer a feature teams build from scratch. The embedded analytics market has matured to the point where SaaS teams can choose from a range of purpose-built tools, each with different pricing models, embed methods, and implementation timelines.
The challenge is that most embedded analytics tools were designed for enterprise data teams, not the product teams who need to ship customer-facing dashboards quickly. Pricing is often opaque, implementation is complex, and the cost of serving dashboards to external customers scales in ways that catch teams off guard.
This guide compares 17 embedded analytics tools in 2026 with published pricing, trade-offs, and a clear picture of which tool works best for which kind of team. We cover Draxlr, Luzmo, Metabase, Power BI Embedded, Looker, Sisense, Qlik, ThoughtSpot, Tableau, Domo, GoodData, Sigma, Omni, Holistics, Embeddable, Qrvey, and Amazon QuickSight.
Disclosure: Draxlr is our product. It is listed first, and it is evaluated against the same criteria as every other tool, trade-offs included. For a closer look at how Draxlr handles embed methods, row-level security, and white labeling, see our embedded analytics tool page.
Key Takeaways
- Three things decide most embedded analytics projects: how each customer's data is isolated, how the bill grows with your customer base, and how native the embed feels inside your product. Chart variety rarely decides it.
- Pricing models differ more than features. Some tools charge a flat fee (Draxlr, Embeddable, Qrvey), some charge per user or viewer (Metabase interactive embedding, Looker), some scale with customer usage (Luzmo), and others by capacity, sessions, or credits (Power BI Embedded, Qlik, Amazon QuickSight, Domo).
- At 500 customer users, our cost estimates range from $75/month to about $21,700/month. See the cost comparison below.
- Semantic-layer tools (Looker, GoodData, Omni, Holistics) keep metrics consistent across tenants, but the data model has to be built before the first dashboard ships.
- White labeling and multi-tenancy are often gated to higher plans, including Sisense Enterprise and ThoughtSpot Embedded Enterprise.
Quick Picks: Best Embedded Analytics Tool by Situation
| Your situation | Tools to shortlist |
|---|---|
| Data in a SQL database, need flat published pricing and a fast first embed | Draxlr, Metabase |
| Analytics is a design-led product differentiator | Luzmo, Embeddable, Sisense |
| Governed metrics shared across many tenants | GoodData, Looker, Omni, Holistics |
| Hundreds of tenants and a requirement to deploy in your own cloud | Qrvey |
| Already standardized on Microsoft, Salesforce, Google Cloud, or AWS | Power BI Embedded, Tableau, Looker, Amazon QuickSight |
| Data in a cloud warehouse, customers need to enter data | Sigma |
| End users should explore data in natural language | ThoughtSpot |
| No data stack yet, want ingestion and dashboards from one vendor | Domo |
What Is Embedded Analytics?
Embedded analytics refers to integrating data dashboards, charts, and reporting directly inside a software product rather than directing users to a separate BI platform. Instead of exporting data to spreadsheets or logging into a standalone tool, customers see live, interactive dashboards built into the product they already use.
For SaaS teams, embedded analytics serves two purposes. Internally, it gives teams visibility into product usage, revenue, and operations. Externally, it gives customers access to their own data inside the product, which drives retention, reduces churn, and increases the perceived value of a platform.
The most common embedded analytics use cases include customer-facing usage dashboards, revenue and performance reports embedded inside client portals, operational analytics embedded in logistics or supply chain products, and multi-tenant SaaS products where each customer sees only their own data.
How embedded analytics differs from traditional BI. Traditional BI serves internal employees who log in to a separate tool, and it is usually priced per internal seat. Embedded analytics serves your customers inside your product, so it has to enforce strict separation between customers, match your product's design, and stay affordable as the number of external viewers grows. Those three requirements are why a BI tool that works well internally can be a poor fit for customer-facing dashboards. For a fuller introduction, including how it works and why SaaS teams adopt it, see our guide to what embedded analytics is.
SQL dashboard tools for embedding. Some tools on this list connect straight to your SQL database, so you build dashboards on the tables your product already uses and embed them without first copying data into a warehouse or building a data model. Customers see current data, not last night's export, and there is no sync pipeline to maintain. The trade-off is that customer traffic now runs queries against your database, so point the tool at a read replica and add caching as usage grows. Draxlr and Metabase both query application databases such as PostgreSQL, MySQL, and SQL Server directly.
What to Look for in an Embedded Analytics Tool
Before evaluating specific embedded analytics tools, it helps to understand what factors actually determine whether a tool works in a production SaaS environment.
White labeling. Some tools offer white labeling only on enterprise tiers. Others include it from the first paid plan. Verify exactly what is included, covering custom domain, logo removal, custom fonts, color palettes, and suppression of all vendor branding, as these are all separate considerations.
Multi-tenant support. In a SaaS product, each customer must only ever see their own data. Some tools handle tenant isolation natively with built-in workspace or row-level security. Others require manual implementation using filtered embed tokens. The former is significantly easier to maintain at scale.
Pricing model at scale. Per-user pricing compounds quickly for customer-facing deployments. A product with 500 customers and 5 users each can turn a manageable monthly fee into a very large bill. Capacity-based, usage-based, and flat pricing models are generally more predictable for SaaS deployments than per-seat models.
Time to first embed. Some tools require data modeling layers and infrastructure setup before a single dashboard can be shown. Others connect directly to a database and get to an embedded dashboard in days. Prioritize tools with direct database connectivity and pre-built SDKs if speed matters.
Embed method. The difference between pasting an iframe into an app and using a React or Vue SDK is significant. Iframes are easy to set up but give you less control over how dashboards look and behave inside your app. SDK-based embedding allows dashboards to inherit the app's design system and behave as native features. If customers interact with analytics frequently, SDK embedding is worth the setup time.
AI features. Most vendors now offer natural language querying or AI-generated insights. For customer-facing use, check that AI answers are limited to each tenant's data, whether queries are generated from governed metric definitions or free-form SQL, and whether AI usage is capped or billed separately. ThoughtSpot's per-user Analytics Pro plan, for example, includes 25 Spotter AI queries per user per month.
Security, compliance, and deployment. Confirm SSO, audit logs, and the compliance reports you need, such as SOC 2, a HIPAA BAA, or GDPR terms, before you shortlist a vendor. Some tools can also run inside your own cloud or private network, including Draxlr's self-hosted option, Qrvey, and Metabase's open-source edition, which matters when customers require their data to stay in infrastructure you control.
How We Evaluated These Tools
Every tool in this guide is assessed on the same seven criteria from the section above: white labeling, multi-tenant support, pricing model at scale, time to first embed, embed method, AI features, and security and deployment options. Each profile follows the same structure, covering who the tool suits, its embed options, key features, pricing, and trade-offs.
Sources. Pricing and feature details come from each vendor's public pricing page and product documentation, checked in September 2026, with Luzmo, Sisense, and ThoughtSpot rechecked in October 2026 after their pricing pages changed. Where a vendor does not publish prices, we say so rather than estimating a list price. Enterprise quotes, discounts, and contract terms vary, so treat every number as a starting point for your own evaluation.
What this guide is not. Nothing in this list is sponsored, and no vendor paid for placement. We did not run a controlled performance benchmark, so load times and query speed will depend on your data volume, database, and caching setup.
Quick Comparison: Best Embedded Analytics Tools in 2026
| Tool | Starting Price (Embedding) | Pricing Model | White Labeling | Customer Viewer Fees | Free Trial |
|---|---|---|---|---|---|
| Draxlr | $75/month | Flat pricing | Included | None, unlimited | 7 days |
| Luzmo | €1,995/month billed annually | Usage-based (scales with customer adoption) | Included | Scales with customer usage | Yes |
| Metabase | $575/month (Pro, 10 users included) | Per-seat (interactive embedding) | Pro and above | $12/user/month (interactive only) | 14 days |
| Power BI Embedded | ~$735/month (A1 SKU) | Capacity-based | Yes | Yes | Limited |
| Looker | ~$60,000/year | Quote-based | Yes | ~$400/user/year | No |
| Sisense | Quote-based | Self-Serve or Enterprise plan | Full white labeling on Enterprise | Not published | Yes (Self-Serve) |
| Qlik | $300/month | Capacity-based | Yes | Yes | Yes |
| ThoughtSpot | Quote-based (free Developer plan for 1 year) | Flexible, quote-based | Enterprise only | Not published | Free Developer plan |
| Tableau | Quote-based | Role-based or usage-based | Limited | Yes on role-based licenses | Yes |
| Domo | Quote-based | Consumption credits | Via Domo Everywhere | No per-user fees, usage consumes credits | 30 days |
| GoodData | Quote-based | Platform fee + per workspace | Included | None, unlimited users | Yes |
| Sigma | Quote-based | Quote-based | Custom themes | Not published | Yes |
| Omni | Quote-based | Quote-based | Custom themes (CSS) | Not published | Yes |
| Holistics | Custom (platform from $800/month billed annually) | Custom | Included | None, unlimited viewers | Yes |
| Embeddable | Quote-based | Flat subscription by project scope | Included | None, unlimited usage | Not listed |
| Qrvey | Quote-based | Flat-rate license (subscription or perpetual) | Included | None, unlimited users | Developer playground |
| Amazon QuickSight | $250/month (500 reader sessions) | Per session or per named reader | Custom themes | $0.50 per extra session (monthly plan) | Yes |
Pricing based on each vendor's public pricing pages and documentation, checked September 2026 (Luzmo, Sisense, and ThoughtSpot rechecked October 2026). Enterprise quotes may vary.
Embed Methods and Tenant Isolation Compared
Pricing tells you what a tool costs. This table shows how each tool puts dashboards inside your product and how it keeps each customer's data separate, based on each vendor's documentation.
| Tool | Embed methods | Tenant isolation |
|---|---|---|
| Draxlr | HTML snippet, React SDK, Vue SDK, backend API, full app embed | Row-level security, with the RLS group and customer attributes sent in the embed token |
| Luzmo | JavaScript SDK, web components | Row-level security via JWT and user attributes |
| Metabase | Static embedding, interactive embedding, React SDK (Pro) | Multi-tenant support on Pro and above |
| Power BI Embedded | JavaScript API | Row-level security |
| Looker | Embed SDK | User attributes with row-level security |
| Sisense | iframe, Compose SDK (React), Embed SDK | Row-level security; native multi-tenancy on Enterprise |
| Qlik | JavaScript APIs, qlik-embed web components, REST APIs | Row-level security, multi-tenant deployment |
| ThoughtSpot | Visual Embed SDK | Row-level security; multi-tenancy by org on Embedded Enterprise |
| Tableau | Embedding API v3 (web components), REST API | User attributes passed in Connected Apps JWTs |
| Domo | Public and private embedding | Programmatic filters sent from your server |
| GoodData | iframe, web components, APIs | Hierarchical workspaces |
| Sigma | Secure iframe with signed URLs, React Embed SDK | Sigma Tenants with source swapping |
| Omni | Signed URL loaded in an iframe | User attributes mapped to row-level permissions |
| Holistics | Embedded dashboards | Dynamic row-level permissions |
| Embeddable | Web component for React, Vue, or HTML | Row-level security scoped by user or tenant |
| Qrvey | Embedded self-service dashboards, APIs | Built-in multi-tenant security |
| Amazon QuickSight | 1-click embed code, embedding APIs | Row-level security, session tags for anonymous users, namespaces |
For a deeper look at tenant isolation, query latency, and cost at scale when customers query your SQL database directly, see our guide to customer-facing SQL analytics tools.
1. Draxlr
Best for: SaaS teams on SQL databases that want customer-facing dashboards with flat, published pricing
Draxlr is an embedded analytics platform built for SaaS teams that need to ship customer-facing dashboards without building a custom BI layer from scratch. It connects directly to SQL databases, does not use a data modeling or semantic layer, and supports HTML snippet, ReactJS SDK, VueJS SDK and backend API embedding. Teams can embed the dashboards they build, or use full-app embedding to hand customers a complete analytics workspace inside the product, with row-level security keeping each customer to their own rows. Non-technical team members can build dashboards using the AI SQL tool to generate queries from plain English or the drag-and-drop builder, while engineers can write raw SQL. The Draxlr MCP server also lets AI assistants like Claude and ChatGPT query the same connected databases, with row-level security enforced and database credentials never shared.
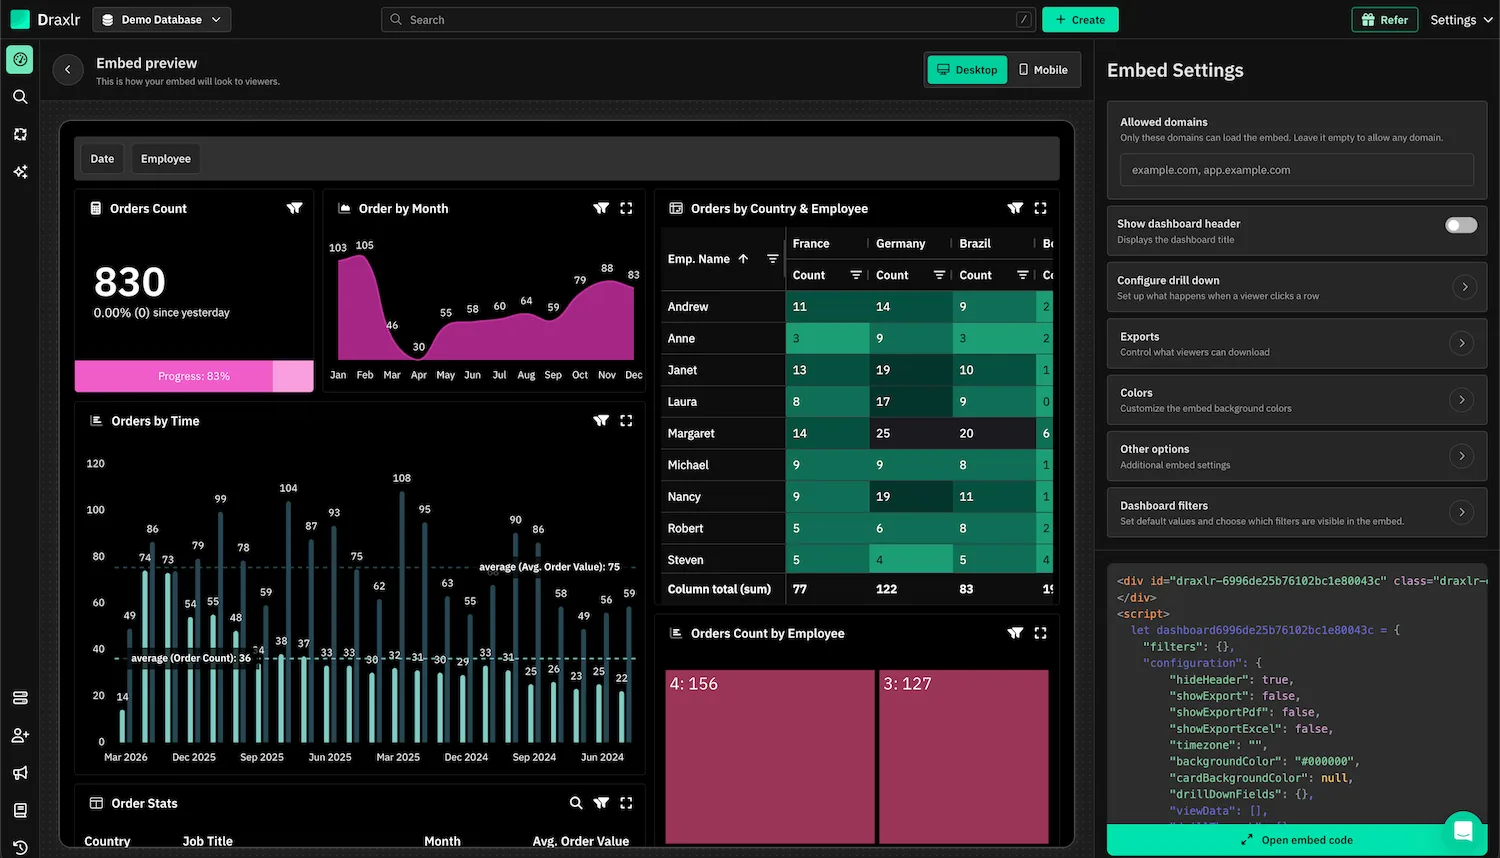
Draxlr's embed preview: the dashboard your customers see, with filters, alongside the embed settings panel.
Who Should Consider Draxlr
Draxlr fits SaaS startups and mid-market teams that need affordable embedded analytics, want white labeling on an entry-level plan, need each customer scoped to their own rows with row-level security, and prefer not to pay per-seat viewer fees as their customer base grows. It also suits teams whose customers keep asking for numbers the prepared dashboards do not show, because full-app embedding lets those customers answer the question themselves.
Embed Options
Draxlr offers two ways to embed.
- Dashboard embedding puts the white-label dashboards you build into your product with filters, drill-downs, and export controls.
- Full-app embedding puts a complete analytics workspace in your product, so a customer who needs a number your dashboards do not show can build the query themselves without writing code or ask the AI assistant in plain English.
Both are delivered the same way, through an HTML snippet, a ReactJS SDK, a VueJS SDK, or a backend API for server-side token auth, with ready-to-use code generated in the embed builder. Row-level security, available from the Power plan, scopes each customer to their own rows across dashboards, saved queries, and the AI assistant, using the RLS group and attribute values your backend sends with the embed token.
Key Features
Draxlr includes row-level security for embeds: you define table access and row rules once in an RLS group, your backend sends the group and the customer's attribute values with the embed token, and Draxlr scopes that customer to their own rows across dashboards, filters, exports, queries, and the AI assistant. It also includes interactive visualizations with drill-down, filters, tooltips, and zoom, real-time data with configurable refresh intervals, responsive design for desktop and mobile, export controls per embed, and AI-powered text-to-SQL for building queries without writing code.
Supported databases include PostgreSQL, MySQL, MariaDB, Microsoft SQL Server, Supabase, PlanetScale, CockroachDB, YugabyteDB, Amazon Redshift, Google BigQuery, Snowflake, ClickHouse, Databricks, Neon, Airtable, and Google Sheets.
Pricing
Draxlr uses flat-rate pricing with no per-viewer or per-embed fees. The Lite plan starts at $25/month with no embedding. The Premium plan at $75/month includes dashboard embedding, white labeling, 2 databases, 10 internal users, and unlimited customer viewers. The Power plan at $250/month adds full-app embedding, row-level security, 5 databases, and 30 internal users. Customer viewers, meaning the customers who view embedded dashboards inside a product, are unlimited on every plan at no additional cost.
A 7-day free trial of the Power plan is available with no credit card required.
Source: Draxlr pricing.
Trade-offs
Draxlr works directly with SQL databases and does not include a semantic modeling or LookML-style layer, so metric definitions live in individual queries and keeping them consistent across many dashboards is a manual discipline. Internal users and connected databases are capped per plan (10 users and 2 databases on Premium), so larger internal teams move up to higher tiers.
2. Luzmo
Best for: SaaS teams building complex embedded dashboards with a design-forward approach
Luzmo is a purpose-built embedded analytics platform with a strong developer SDK and a drag-and-drop dashboard builder that allows non-technical team members to build and iterate on dashboards independently. It is a strong choice for SaaS teams where analytics is a core product differentiator and the visual quality of embedded dashboards matters significantly.
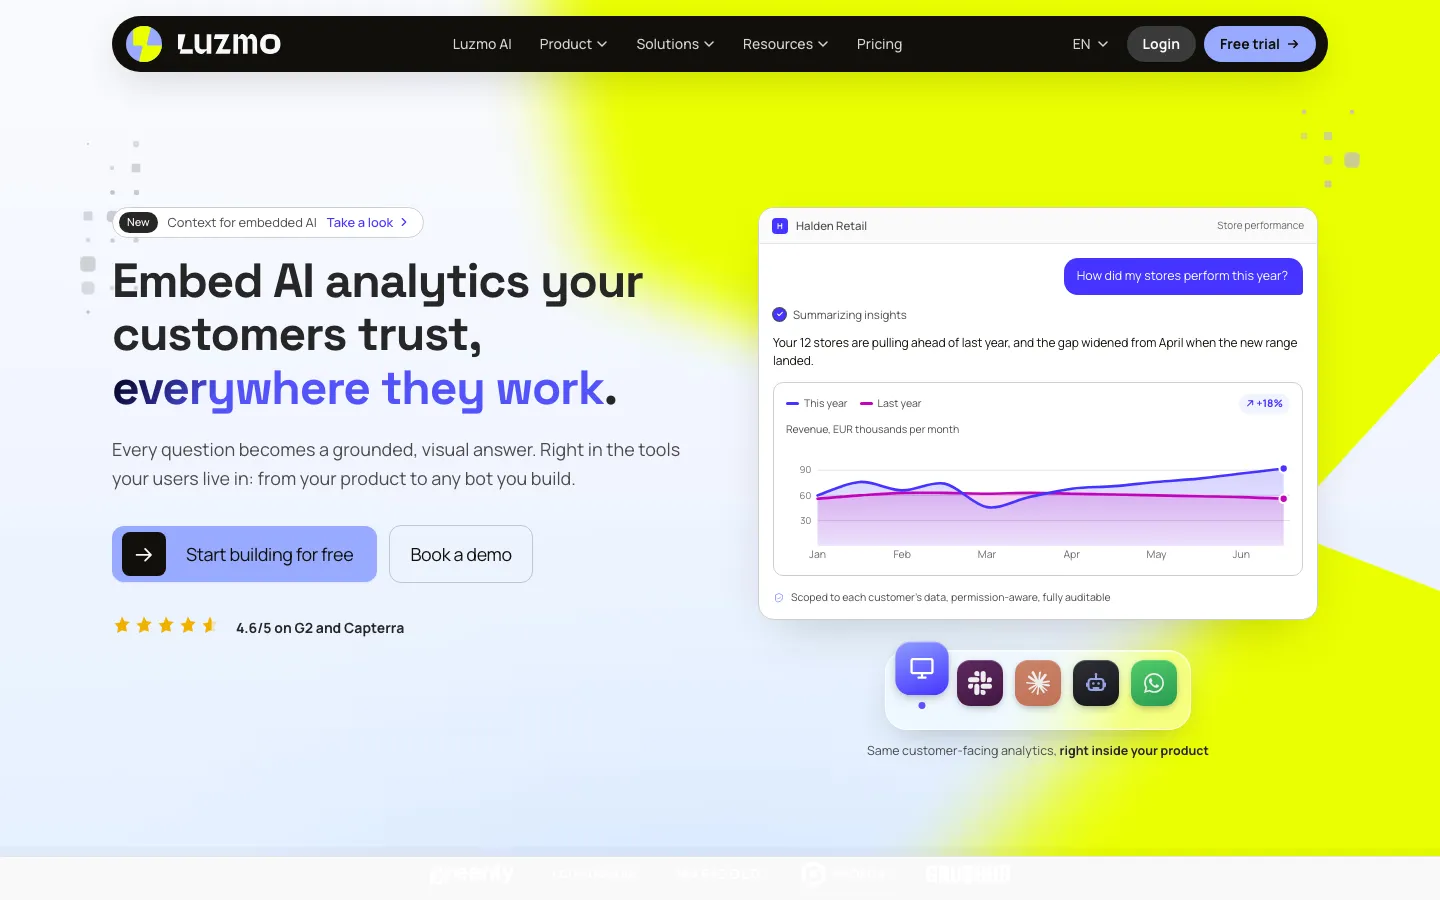
Luzmo's embedded analytics homepage (captured September 2026).
Who Should Consider Luzmo
Luzmo suits growth-stage SaaS teams where product managers or designers need to build dashboards without engineering support, teams that need advanced charting options, and organizations comfortable with usage-based pricing that can model costs from projected customer adoption.
Embed Options
Luzmo provides a JavaScript SDK and web components for native embedding with no iframes required. White labeling is included in its single plan.
Key Features
Luzmo includes a drag-and-drop dashboard builder for non-technical users, live and cached data modes, multi-tenant support with row-level security via JWT and user attributes, themed components that inherit the application's design system, and usage-based pricing that does not charge per seat.
Pricing
Luzmo offers a single plan, Embedded Everywhere, starting at €1,995/month billed annually. White labeling, self-service for end users, AI, and APIs are included, with nothing reserved for a higher plan. The price scales with customer adoption, so as more customers use embedded dashboards, the bill increases.
Source: Luzmo pricing.
Trade-offs
Luzmo's usage-based pricing introduces cost unpredictability during growth phases. A product that sees a spike in customer engagement will see a corresponding increase in analytics costs. The €1,995/month starting price is also a significant commitment for early-stage teams with only a few customers using dashboards.
Comparing other options? See our Luzmo alternatives.
3. Metabase
Best for: internal BI teams that also need embedded dashboards
Metabase is a BI tool known for its clean interface and accessible query builder. Its open-source tier is free to self-host, making it popular for internal reporting. For embedded analytics, however, Metabase's per-seat pricing model and feature gating create challenges for SaaS teams with large customer bases.
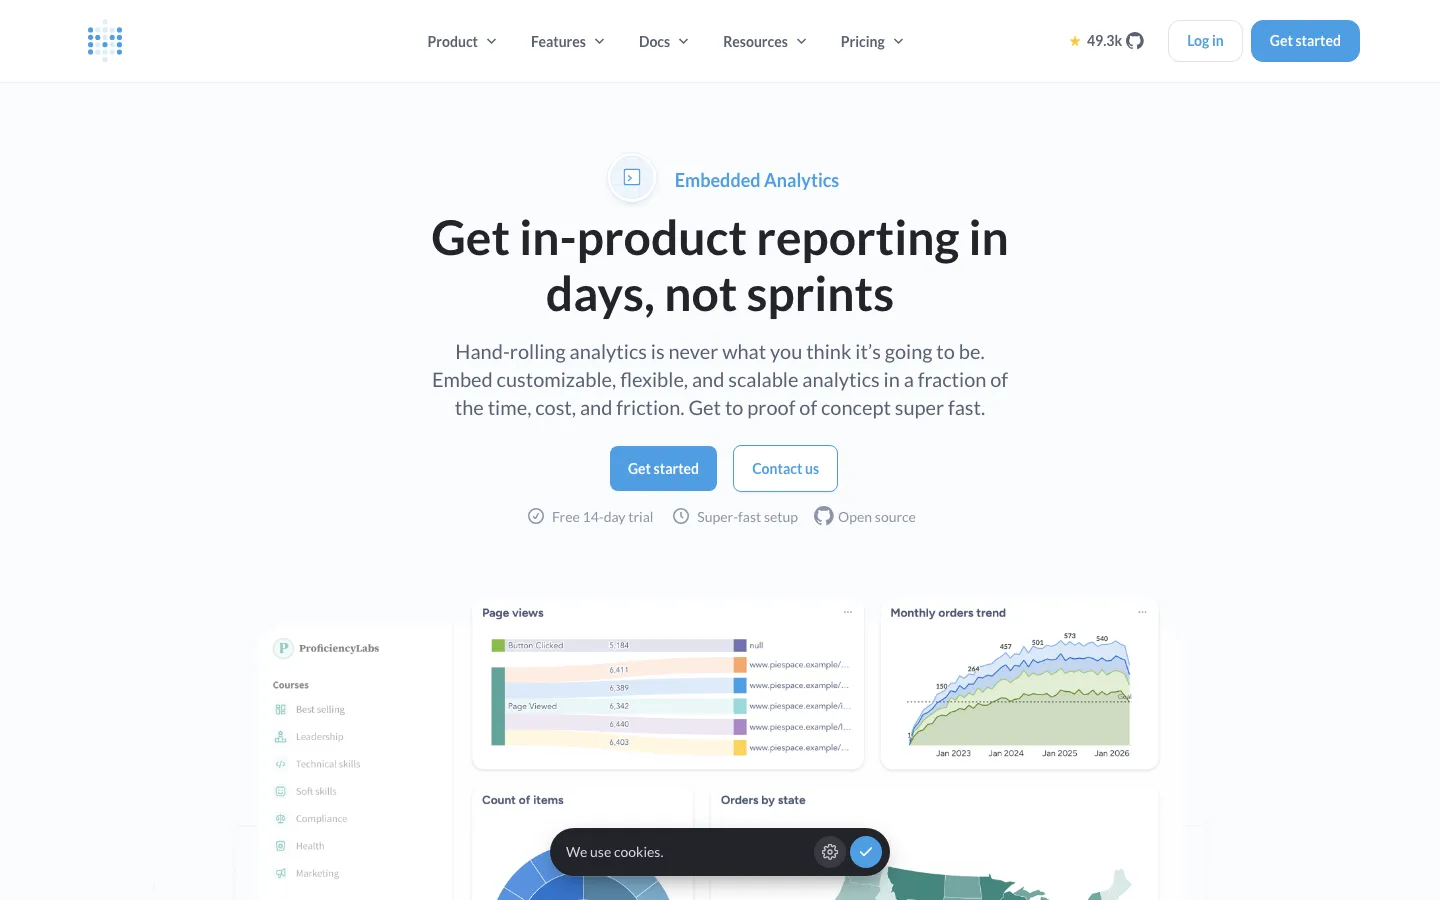
Metabase's embedded analytics product page (captured September 2026).
Who Should Consider Metabase
Metabase suits teams that are already using it for internal reporting and want to extend some of that capability to customers without switching platforms, small-scale embedding use cases where the customer viewer count is low and predictable, and organizations that are comfortable with self-hosting and have DevOps capacity to maintain the open-source version.
Embed Options
Metabase's open-source tier supports guest embedding but requires leaving a "Powered by Metabase" badge on all embedded dashboards. White labeling and interactive embedding require the Pro plan. The React SDK for native component-level embedding is available on Pro and above.
Key Features
Metabase includes a visual query builder, SQL editor, an extensive chart library, scheduled reports, alerts, and a well-documented API. The Pro plan adds SSO, white labeling, interactive embedding, and multi-tenant support.
Pricing
Metabase's Starter plan begins at $100/month plus $6/month per user (first 5 users included), cloud hosted only. The Pro plan starts at $575/month with the first 10 users included and additional users at $12/month each.
For embedded analytics specifically, Metabase has two modes. Static embedding lets customers view pre-configured dashboards with no Metabase login required and no per-viewer cost. The limitation is that static embeds are read-only — customers cannot apply filters, drill down, or interact with the data beyond what was pre-set. Interactive embedding unlocks full interactivity including filters, drill-through, and customer-controlled exploration, but requires customers to sign in to Metabase. Every signed-in customer counts as a billable user at $12/month. For a SaaS product with 500 customers using interactive embedded dashboards, that structure becomes $6,000/month in viewer fees before infrastructure costs.
Source: Metabase pricing.
Trade-offs
The core challenge for customer-facing use cases is the interactive embedding model. Static embeds require no login and no per-viewer cost, but customers cannot interact with the data. Interactive embedding gives customers full control but requires a Metabase login for every viewer, with each viewer billed at $12/month. Teams that need fully interactive embedded dashboards at scale face costs that compound quickly as the customer base grows.
Comparing other options? See our Metabase alternatives for embedded analytics.
4. Power BI Embedded
Best for: teams already invested in the Microsoft Azure ecosystem
Power BI Embedded is Microsoft's solution for embedding Power BI reports and dashboards inside external applications. It is capacity-based rather than per-user, which makes it more predictable for customer-facing deployments than tools like Metabase or Looker. It is the natural choice for teams already building on Azure or using Power BI internally for reporting.
Microsoft's Power BI Embedded product page on Azure (captured September 2026).
Who Should Consider Power BI Embedded
Power BI Embedded suits organizations already using Power BI internally who want to surface existing dashboards to customers, teams building on Microsoft Azure where native integration reduces infrastructure overhead, and enterprises in industries where Microsoft tooling is a standard requirement.
Embed Options
Power BI Embedded provides a JavaScript API for native embedding of reports, dashboards, tiles, and Q&A experiences. Row-level security supports tenant-based data isolation. Both app-owns-data and user-owns-data embedding scenarios are supported.
Key Features
Power BI Embedded includes token-based authentication, capacity-based A-SKU pricing, an extensive custom visuals marketplace, integration with Azure Active Directory and Microsoft Fabric, and support for the full Power BI feature set in embedded contexts.
Pricing
Power BI Embedded uses capacity-based A-SKU pricing. The A1 SKU starts at approximately $735/month. Advanced embedding features require Premium Per Capacity or Premium Per User plans, which are significantly more expensive. The capacity model means costs are more predictable than per-seat models, but scaling capacity to handle higher concurrency increases costs.
Source: Power BI Embedded pricing on Azure.
Trade-offs
Power BI Embedded is tightly coupled to the Microsoft ecosystem. Teams not already using Azure will face additional infrastructure overhead. The UI flexibility for white-labeled products is more limited than dedicated embedded analytics platforms, and the implementation complexity is higher than lighter-weight alternatives.
Comparing other options? See our Power BI alternatives.
5. Looker
Best for: enterprises with complex data models and existing Google Cloud investment
Looker is Google Cloud's enterprise BI platform built around LookML, a proprietary modeling language that defines metrics, dimensions, and relationships in a reusable and version-controlled way. Its strengths are data governance and semantic modeling, and it is also one of the more expensive options for embedded use cases.
Looker's product page on Google Cloud (captured September 2026).
Who Should Consider Looker
Looker suits enterprises with large data warehouses and dedicated data engineering teams who can invest in learning and maintaining LookML models, organizations already deeply embedded in Google Cloud or BigQuery, and teams that need a single consistent metric definition shared across internal and external analytics.
Embed Options
Looker provides an Embed SDK for embedding individual charts, full dashboards, or the full Looker explore interface. LookML handles reusable metric definitions. SSO integration and user attribute-based row-level security support multi-tenant deployments.
Key Features
Looker includes LookML semantic layer, Gemini AI integration for natural language querying, full white labeling with custom theming, REST API for programmatic access to all Looker resources, Git integration for version control of data model changes, and deep integration with BigQuery and Google Cloud.
Pricing
Looker does not publish pricing publicly. The base platform starts at approximately $60,000 per year before viewer or creator seat costs. Viewer seats add $400 per user per year. For a SaaS product with 500 customers viewing embedded dashboards, the viewer fee alone adds $200,000 per year on top of the platform license. Embedded use cases that require the Embed Edition are priced higher still, with total annual costs commonly ranging from $100,000 to $500,000 depending on usage and scale.
Source: Looker pricing. Google lists the Standard, Enterprise, and Embed editions there but quotes prices through sales, so the dollar figures above are estimates rather than list prices.
Trade-offs
Looker's per-viewer pricing model makes it economically unworkable for most SaaS teams serving large customer bases. The LookML learning curve requires dedicated data engineering investment.
Comparing other options? See our Looker alternatives.
6. Sisense
Best for: teams that need full embedded BI with public, transparent pricing
Sisense is an analytics platform built for embedded analytics use cases. Sisense offers a Self-Serve plan you can try free and an Enterprise plan for larger deployments. Its Compose SDK enables fully customized embedded experiences using React components, making it a strong option for product teams that want flexibility in how analytics are surfaced inside their application.
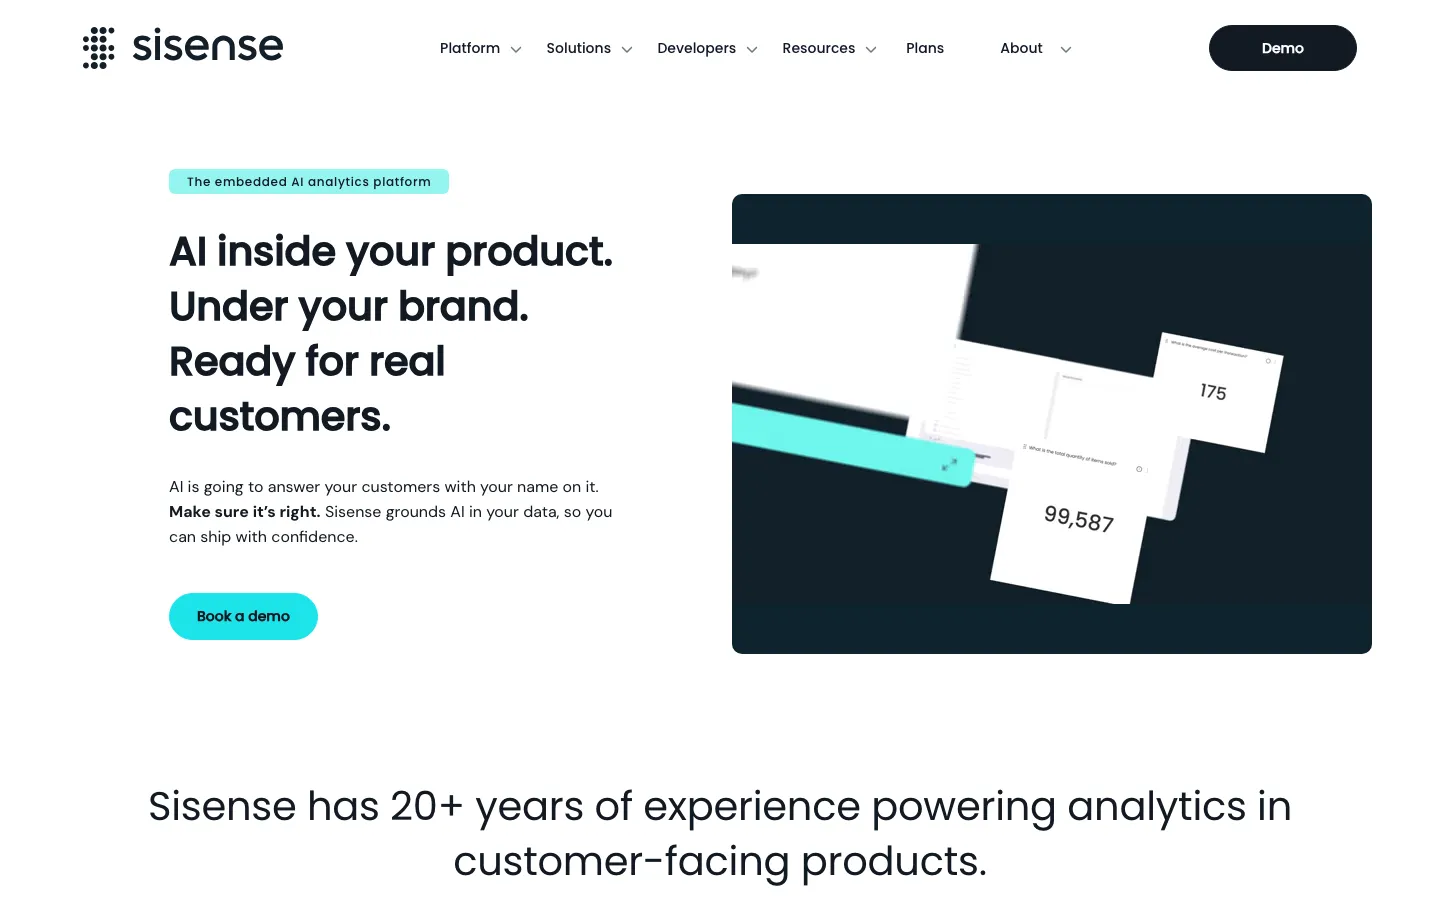
Sisense's embedded analytics homepage (captured September 2026).
Who Should Consider Sisense
Sisense suits SaaS teams that want a fully customized embedded analytics experience built with React components, teams that want to start on a self-serve plan, and organizations that need full white labeling and native multi-tenancy under an enterprise contract.
Embed Options
Sisense provides iframe, Compose SDK, and Embed SDK embedding options. The Self-Serve plan embeds with an iframe or the Compose SDK on any tech stack, and the Compose SDK enables component-level React embedding with full UI customization. Full white labeling is part of the Enterprise plan.
Key Features
Sisense includes row-level security, Sisense Intelligence for AI-powered insights and natural language querying, iframe and SDK-based embedding, scheduled and automated reports, and connectivity to all major data sources. The Enterprise plan adds full white labeling, a native multi-tenant architecture, premium support, and a dedicated customer success manager.
Pricing
Sisense's plans page lists two plans, Self-Serve and Enterprise, without published prices. The Self-Serve plan can be tried free. The Enterprise plan adds full white labeling, a native multi-tenant architecture that keeps each customer's data isolated, premium support, and a dedicated customer success manager.
Source: Sisense plans.
Trade-offs
Full white labeling and native multi-tenancy are part of the Enterprise plan, so teams that need tenant isolation and a fully branded embed from day one should price the Enterprise plan early in their evaluation. Without published prices, comparing Sisense against flat-priced tools takes a sales conversation.
Comparing other options? See our Sisense alternatives.
7. Qlik
Best for: enterprises with complex, multi-dimensional data that need associative exploration
Qlik is one of the longest-standing analytics platforms, known for its associative engine that holds all data relationships in memory and allows users to explore them without predefined query paths. Since March 2025, Qlik has moved to a capacity-based pricing model for all new cloud subscriptions, removing per-user fees in favor of data volume-based pricing.
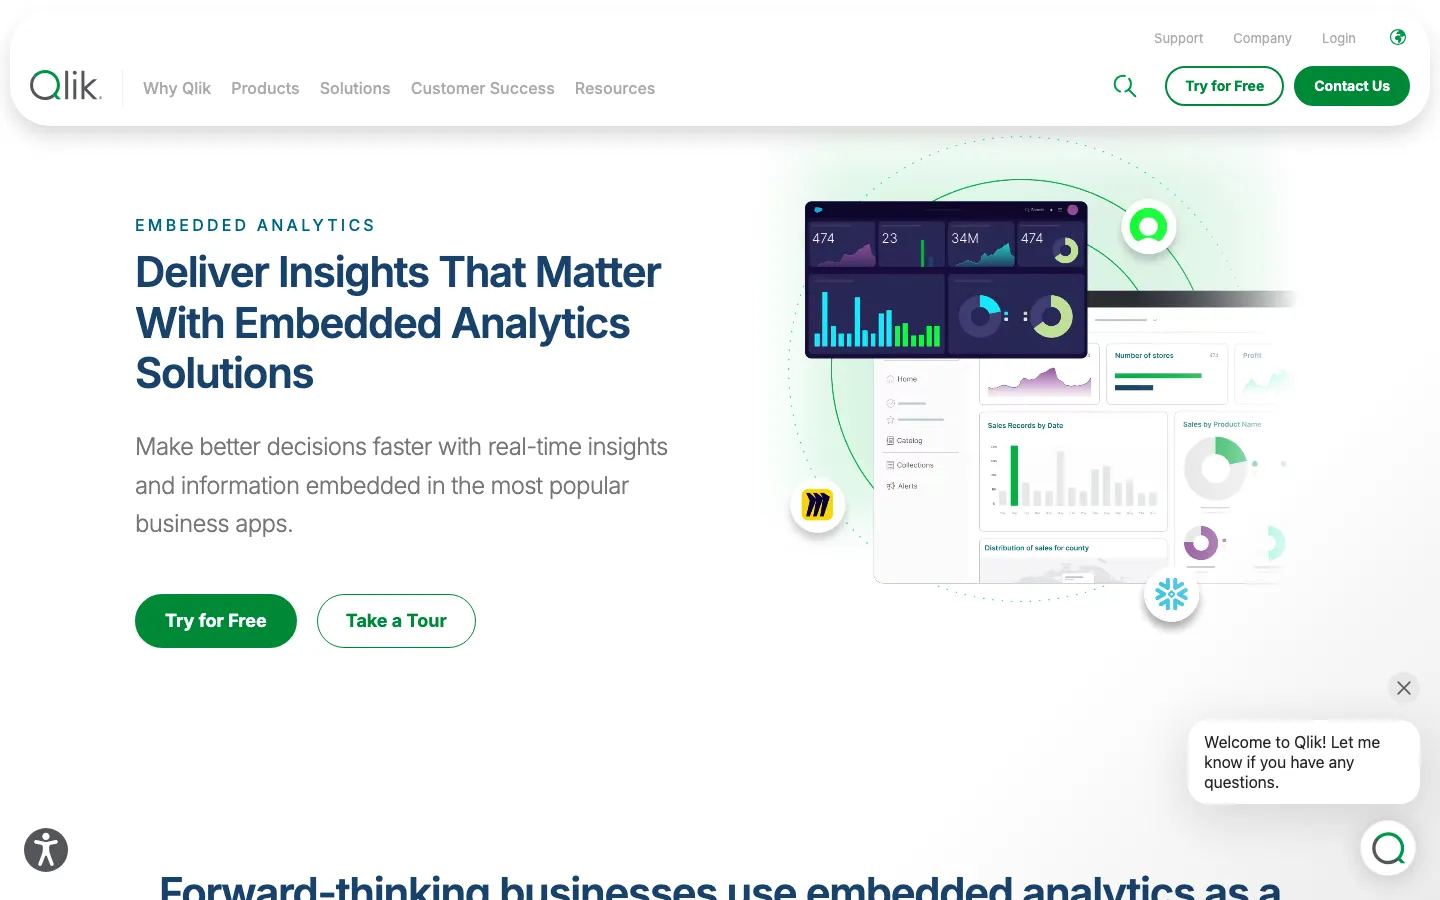
Qlik's embedded analytics product page (captured September 2026).
Who Should Consider Qlik
Qlik suits enterprises with complex, multi-dimensional datasets where users need to freely explore data relationships rather than consume fixed dashboards, teams already in the Qlik ecosystem looking to extend analytics to customer-facing products, and organizations where exploratory analysis rather than standard dashboard consumption is the core use case.
Embed Options
Qlik provides JavaScript APIs, the newer qlik-embed web components, and REST APIs for programmatic embedding. Nebula.js allows building fully custom visualization components on top of Qlik's associative engine. White labeling and multi-tenant deployment are supported.
Key Features
Qlik includes its associative in-memory engine for instant cross-filter interactions, Qlik Staige for AI-powered insights and natural language querying, row-level security, SSO, real-time alerting, and Active Intelligence for automated action triggers. Since March 2025, new subscriptions use capacity-based pricing.
Pricing
Qlik uses capacity-based pricing tied to data volume rather than user count. The Starter plan begins at $300/month billed annually for 10 users and 10GB of data. The Standard plan starts at $825/month for 25GB of data with unlimited users. The Premium plan at $2,750/month adds predictive AI, anonymous public access, additional GenAI capacity, and SAP connectors. The Enterprise plan is custom priced and starts at 250GB of data. A free trial is available on the Qlik Cloud Analytics tier.
Source: Qlik Cloud Analytics pricing.
Trade-offs
Qlik's Starter plan at $300/month is accessible but limited to 10 users and 10GB of data with no ability to purchase additional data capacity. Meaningful production embedded analytics use cases typically require the Standard plan at $825/month or above. The associative engine, while powerful for exploration, is not designed for teams that primarily need standard dashboard consumption. Setup requires Qlik expertise that is less common than familiarity with SQL or other BI tools.
Comparing other options? See our Qlik alternatives.
8. ThoughtSpot
Best for: organizations that need AI-driven, natural language analytics for end users
ThoughtSpot, now positioning itself as an Agentic Analytics Platform, is built around natural language search and AI-driven insights rather than pre-built dashboards. Users ask questions in plain English and ThoughtSpot's AI engine translates them into SQL, selects the most relevant chart type, and returns instant answers. ThoughtSpot offers a free Developer plan for embedded use cases, so teams can try the platform before talking to sales.
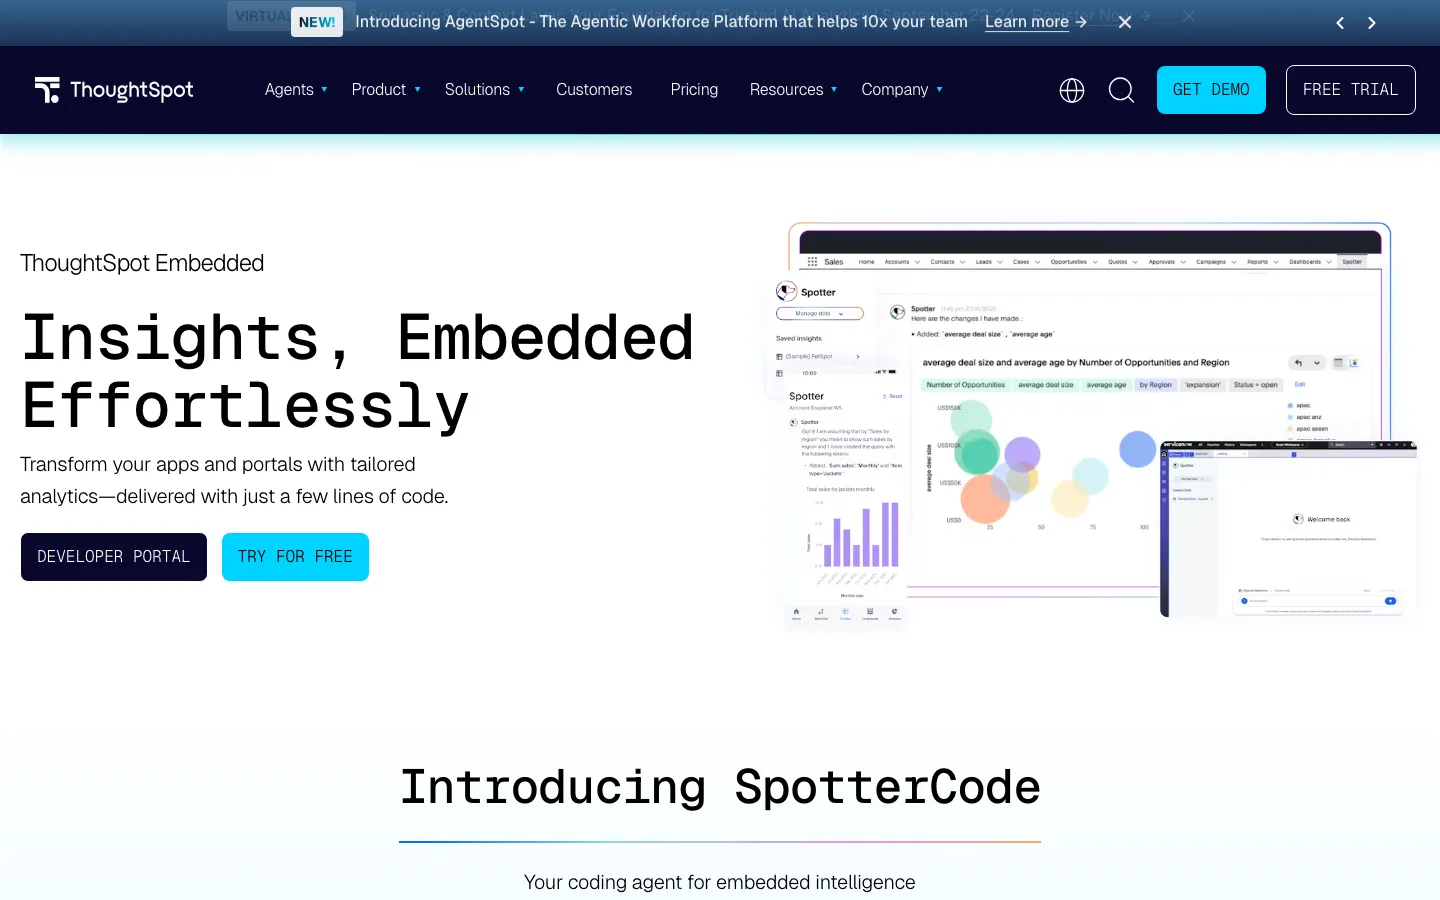
ThoughtSpot's Embedded product page (captured September 2026).
Who Should Consider ThoughtSpot
ThoughtSpot suits organizations that want to give non-technical end users the ability to explore data freely without relying on pre-built dashboards, enterprises where self-service analytics is a core product differentiator rather than a supplementary feature, and teams with well-structured data models that can support reliable natural language querying at scale.
Embed Options
ThoughtSpot provides a Visual Embed SDK for native component-level embedding of charts, Liveboards, or the search bar independently. SpotterCode allows AI-assisted embedding code generation. White labeling and theming support are included. SSO and row-level security handle multi-tenant data isolation.
Key Features
ThoughtSpot includes Spotter AI Agent for natural language querying, automated anomaly detection via SpotIQ, embeddable Liveboards that respond to filters in real time, Analyst Studio for deeper modeling with SQL, Python, or R, and connections to major cloud data warehouses including Snowflake, BigQuery, Databricks, and Redshift.
Pricing
ThoughtSpot Embedded has two plans. The Developer plan is free for one year for up to 10 users and 25M rows of data, making it a genuine way to evaluate the platform before committing. The Enterprise plan has flexible pricing models aligned to your use case and go-to-market requirements, covers unlimited users and data, and requires contacting sales. ThoughtSpot does not meter or charge for LLM tokens. Multi-tenant support by organization is available on the Embedded Enterprise plan only.
Source: ThoughtSpot pricing.
Trade-offs
Production embedding goes from the free Developer plan straight to Embedded Enterprise, so there is no published price to budget against before a sales conversation. Multi-tenant support by organization is only available on the Embedded Enterprise plan. The free Developer plan is limited to 10 users, 25M rows, and one year, which is suitable for proof-of-concept but not production scale. The implementation complexity remains high, as realizing the AI-driven search experience requires significant data preparation, schema design, and engineering investment upfront. Analyst Studio for SQL, Python, and R analysis is an add-on on all plans.
Comparing other options? See our ThoughtSpot alternatives.
9. Tableau
Best for: organizations already using Tableau internally that want to extend the same dashboards to customers
Tableau, owned by Salesforce, is one of the most widely adopted visualization platforms. Its embedded analytics offering lets teams place Tableau dashboards and individual visualizations inside web applications, portals, and Salesforce, using the same content their internal analysts already build.
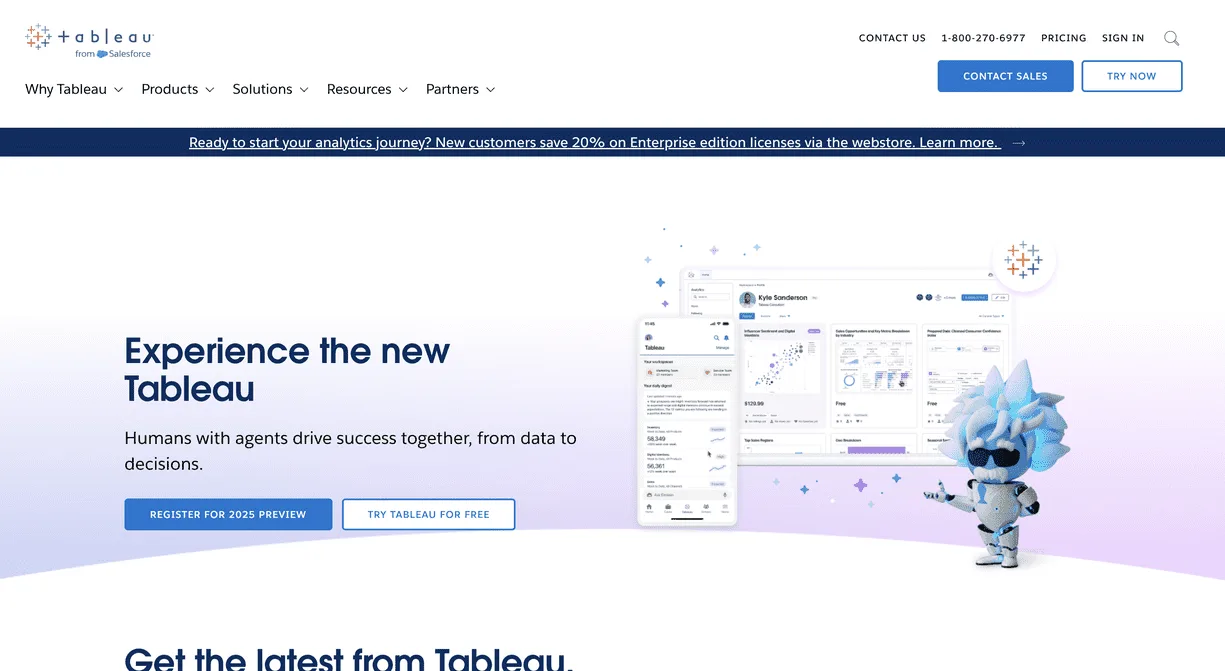
Tableau's Embedded Analytics Playbook, which documents the Embedding API v3 and Connected Apps (captured September 2026).
Who Should Consider Tableau
Tableau suits teams whose analysts already build in Tableau, organizations in the Salesforce ecosystem, and products where rich, highly customized visualizations matter more than a lightweight embed footprint.
Embed Options
Tableau's Embedding API v3 embeds visualizations as web components. Connected Apps establish a trust relationship between your application and Tableau Cloud or Tableau Server, with users authenticated through a JSON Web Token signed by your server. User attributes passed in the token can be used to control which data each viewer sees. The REST API handles user management, content, and permissions programmatically.
Key Features
Tableau includes a deep visualization library, web-component embedding through the Embedding API v3, JWT-based authentication through Connected Apps, user-attribute-based data access control, and on-demand access for sites on usage-based embedded licensing, which lets external users view embedded content without being provisioned individually in the Tableau site.
Pricing
Tableau does not publish pricing for embedded deployments. Embedded analytics is licensed either on Tableau's role-based model (Creator, Explorer, and Viewer licenses) or on a usage-based model negotiated with sales. A free trial of Tableau Cloud is available.
Source: Tableau pricing.
Trade-offs
Role-based licensing charges per user, which becomes expensive for customer-facing products with many viewers unless a usage-based agreement is negotiated. Pricing requires a sales conversation. Embedded views carry Tableau's own interface patterns, so making dashboards feel fully native to a product takes more effort than SDK-first embedded tools, and setup requires Tableau Cloud or Server administration experience.
Comparing other options? See our Tableau alternatives.
10. Domo
Best for: enterprises that want a full data platform, from data ingestion to dashboards, with embedding included
Domo is a cloud data platform that combines data connectors, ETL, a data warehouse layer, and dashboards. Its embedded analytics product, Domo Everywhere, is designed for sharing Domo dashboards inside customer portals, partner apps, and public websites.
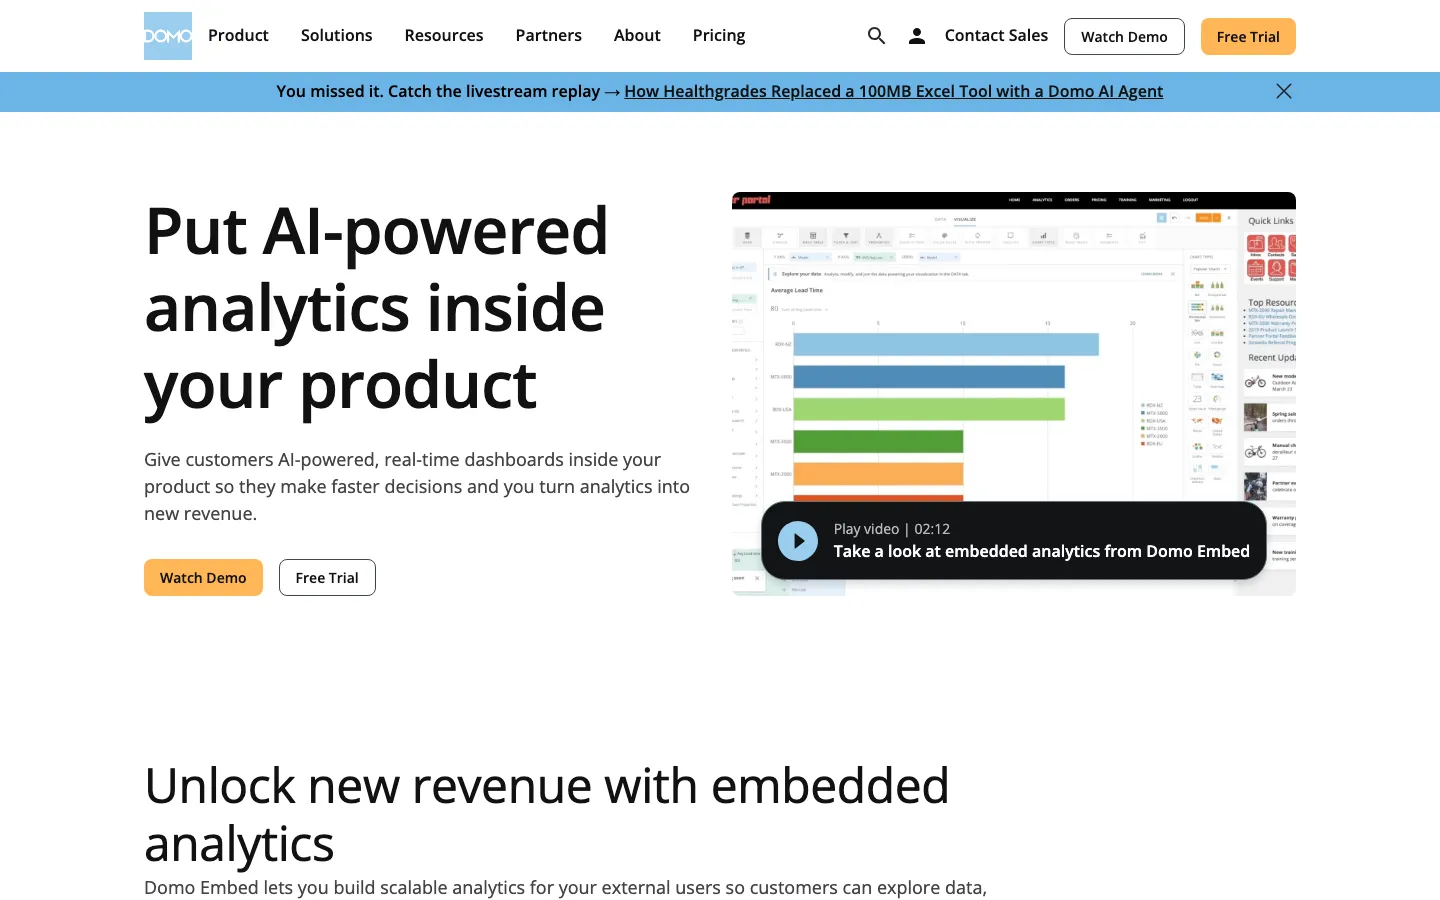
Domo's embedded analytics product page (captured September 2026).
Who Should Consider Domo
Domo suits organizations that do not yet have a mature data stack and want ingestion, transformation, and visualization from a single vendor, and enterprises that need to share analytics with large partner or customer networks.
Embed Options
Domo supports public embedding for websites and blogs, and private embedding inside SSO-enabled applications and portals. With programmatic filtering, your server identifies the current user and sends Domo the filters to apply, which is how each customer is restricted to their own data.
Key Features
Domo includes hundreds of prebuilt data connectors, built-in ETL and data transformation, cross-card filtering in embedded dashboards, programmatic filters with operators such as IN, EQUALS, and GREATER_THAN, and AI features on the same platform.
Pricing
Domo uses consumption-based pricing. Customers buy a pool of credits, and activity on the platform, including data ingestion, transformations, queries, and dashboard refreshes, consumes those credits. Plans include unlimited users. Domo does not publish credit prices, and Domo Everywhere is quoted through sales. A 30-day free trial is available.
Source: Domo pricing.
Trade-offs
Credit consumption makes costs harder to forecast, because more customer activity and more frequent refreshes consume more credits. For teams that already have a database or warehouse and only need customer-facing dashboards, Domo's full data platform is more than they need. Row-level isolation relies on programmatic filters that your engineering team implements server-side.
Comparing other options? See our Domo alternatives.
11. GoodData
Best for: SaaS companies that need governed, multi-tenant analytics built on a semantic layer
GoodData, now branded GoodData.AI, is an analytics platform designed for embedded and multi-tenant use cases. Its semantic layer defines metrics once and reuses them across every customer, and its workspace hierarchy lets a SaaS company roll out shared content to many tenants at once.
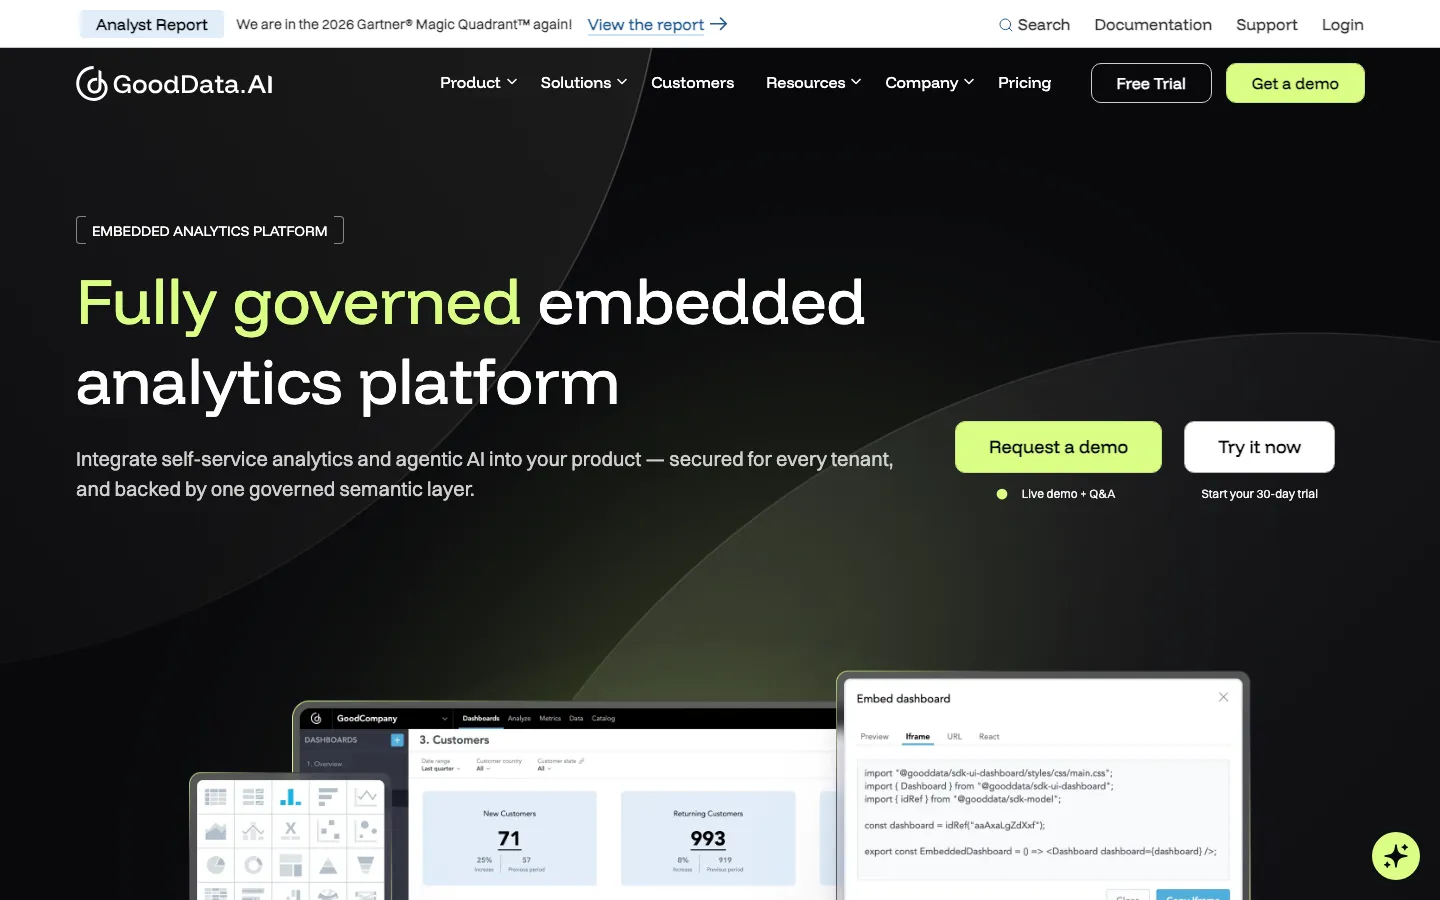
GoodData's embedded analytics platform page (captured September 2026).
Who Should Consider GoodData
GoodData suits SaaS companies with many tenants that need consistent metric definitions across all of them, data teams comfortable investing in semantic modeling upfront, and organizations with compliance requirements such as HIPAA.
Embed Options
GoodData supports iframe, web components, and APIs for embedding on both of its plans. White labeling is included on both plans. Multi-tenancy is built in through hierarchical workspaces, where child workspaces inherit shared dashboards and metrics from a parent workspace.
Key Features
GoodData includes a governed semantic layer, built-in multi-tenancy with hierarchical workspaces, white labeling, and AI capabilities. The Enterprise plan adds custom agents, 24/7 prioritized SLAs, three environments, CI/CD, usage analytics, and advanced compliance options including HIPAA and FedRAMP on demand.
Pricing
GoodData offers two plans and does not publish dollar amounts for either. The Professional plan is priced as a platform fee plus the number of workspaces, with unlimited users and data, and a free trial is available. The Enterprise plan uses custom, use-case-based pricing.
Source: GoodData pricing.
Trade-offs
Because pricing is based on workspaces, and SaaS deployments typically give each customer its own workspace, cost grows with the number of customers. The semantic model needs to be designed before dashboards go live, which lengthens time to first embed compared with tools that query a database directly. Prices are only available through sales.
Comparing other options? See our GoodData alternatives for embedded analytics.
12. Sigma
Best for: teams with data in a cloud warehouse that want spreadsheet-style analytics and write-back inside their product
Sigma is a cloud analytics platform that queries data live in your warehouse through a spreadsheet-like interface. Its embedded offering covers dashboards as well as data apps, where customers can enter data that is written back to the warehouse.
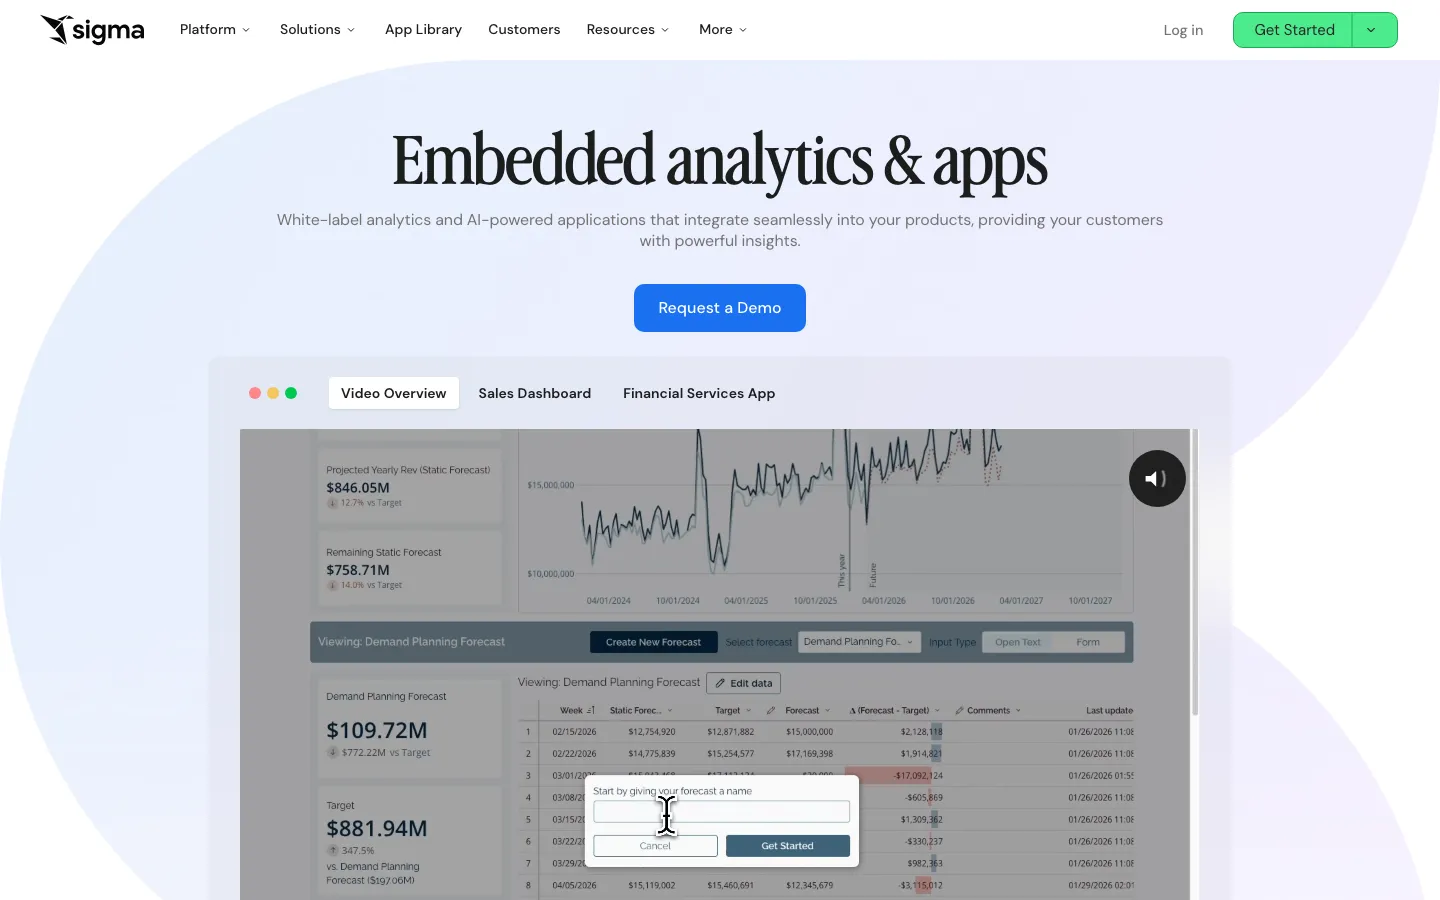
Sigma's embedded analytics and apps product page (captured September 2026).
Who Should Consider Sigma
Sigma suits teams whose data already lives in Snowflake, Databricks, BigQuery, or another cloud warehouse, products that need customers to input or edit data rather than only view it, and organizations with spreadsheet-heavy users.
Embed Options
Sigma embeds full workbooks or individual visualizations through secure iframes, using signed URLs generated with JWTs. An Embed SDK for React is available for tighter integration. Sigma Tenants support multi-tenant deployments, with APIs for provisioning tenants and deploying content, and source swapping to point each tenant at its own data.
Key Features
Sigma includes live queries against cloud warehouses, Input Tables for writing data back to the warehouse, custom themes with brand fonts, colors, and palettes, programmatic tenant management, and AI-powered applications.
Pricing
Sigma does not publish pricing, so embedded deployments are quoted through sales. A free trial is available.
Trade-offs
Because Sigma queries your warehouse live, customer dashboard activity drives warehouse compute costs on top of the Sigma license. Pricing is not public, which makes early budgeting harder. Teams without a cloud warehouse get less of Sigma's value than warehouse-centric teams do.
Comparing other options? See our Sigma Computing alternatives.
13. Omni
Best for: data teams that want a shared semantic model for internal BI and customer-facing analytics
Omni is a BI platform that combines a semantic model with SQL, spreadsheet-style calculations, and AI querying. Omni acquired the embedded analytics company Explo in October 2025, and Explo customers are being migrated onto Omni, which has made embedded analytics a central part of its product.
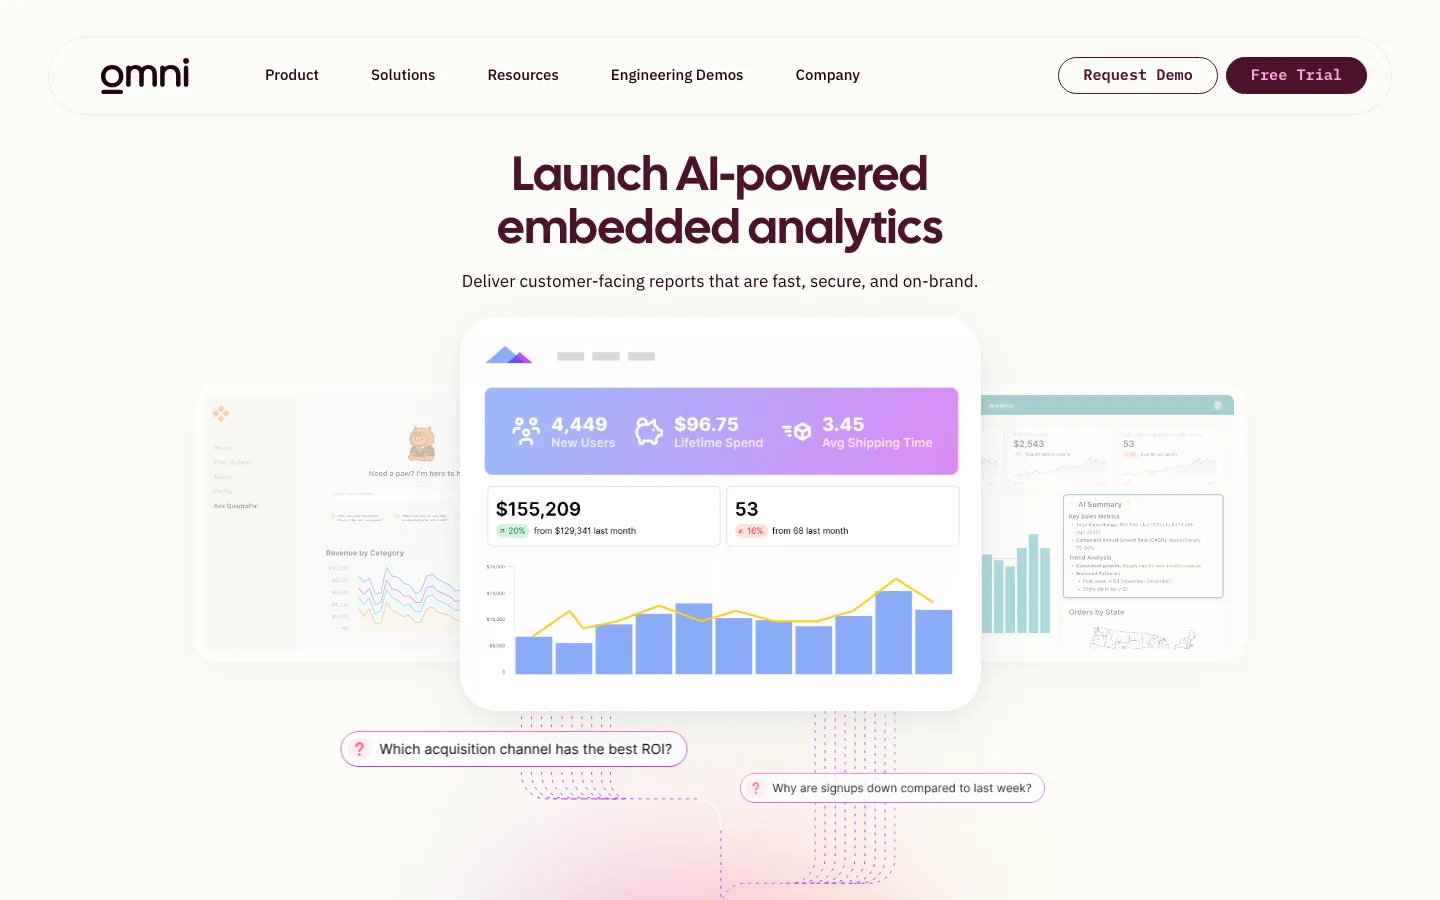
Omni's embedded analytics product page (captured September 2026).
Who Should Consider Omni
Omni suits teams that want one set of metric definitions shared between internal reporting and customer-facing dashboards, products where customers should be able to build their own analyses, and existing Explo customers planning their migration.
Embed Options
Omni embeds content by generating an authorized URL, which includes the user's ID from your system and the attributes that user should have, and loading it in an iframe. Those user attributes map to row-level permissions, so many customers can share the same report while seeing only their own data. Themes are customized with CSS.
Key Features
Omni includes a semantic model that defines metrics once for every customer instance, self-service analysis inside the embed using AI, Excel-style calculations, SQL, or point-and-click, APIs and an MCP server, role-based access and audit logs with SOC 2, HIPAA, and GDPR compliance, and version control with CI/CD and testing environments.
Pricing
Omni does not publish pricing, so plans are quoted through sales. A free trial is available.
Trade-offs
Embedding is based on iframes loaded from signed URLs rather than native components. Pricing requires a sales conversation. Getting the most from Omni means building out its semantic model, which is more setup than tools that query a database directly.
14. Holistics
Best for: data teams that prefer analytics-as-code and want unlimited embedded viewers
Holistics is a self-service BI platform that applies software engineering practices to analytics. Metrics and reports are defined in code, version-controlled with Git, and reused across dashboards, and its embedded analytics offering extends that governed setup to customer-facing products.
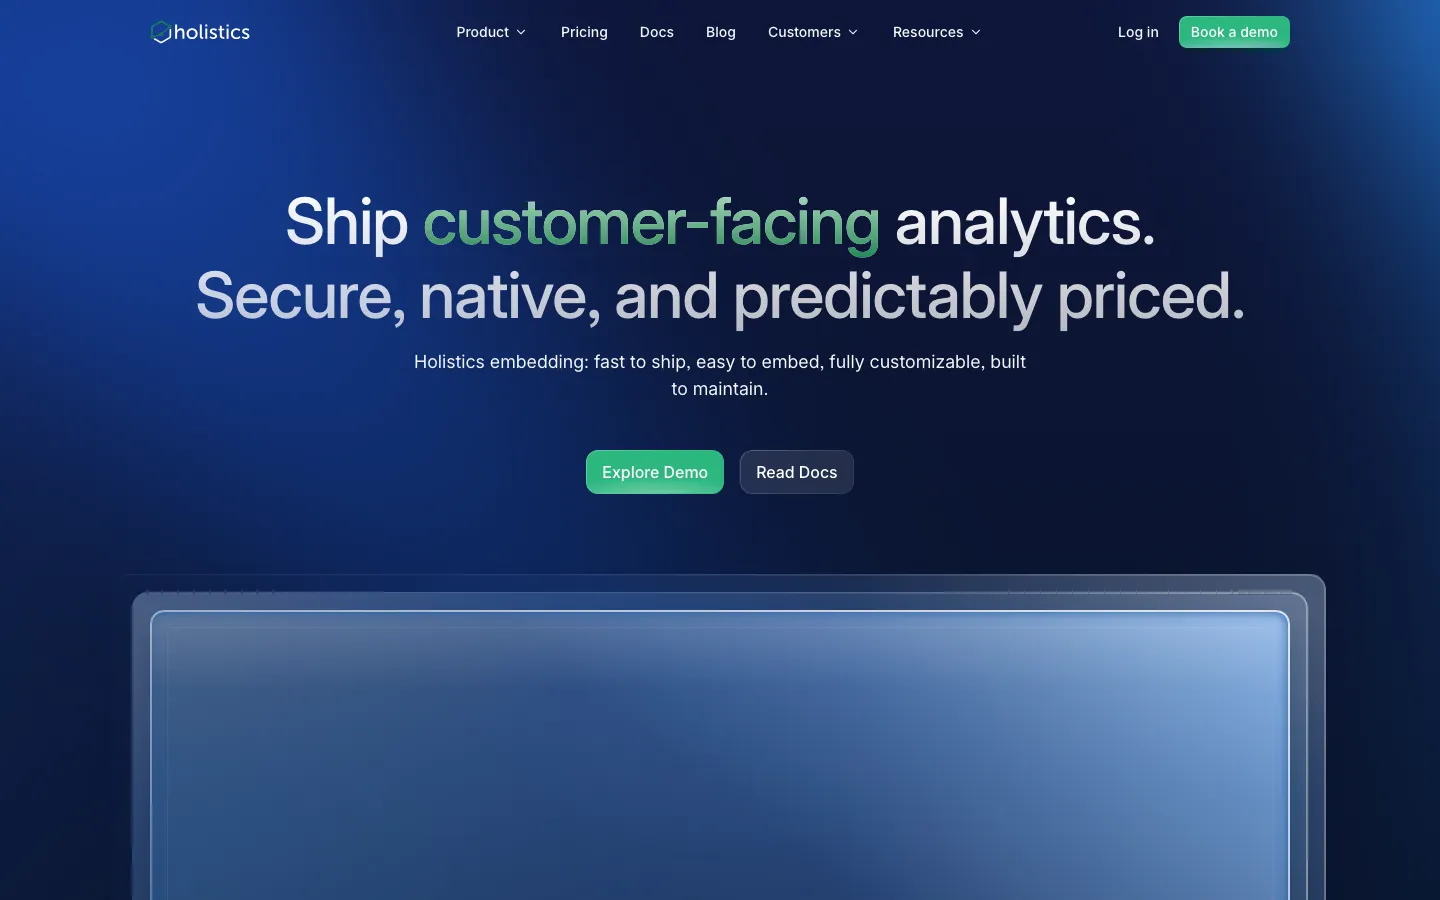
Holistics' embedded analytics page (captured September 2026).
Who Should Consider Holistics
Holistics suits data teams comfortable defining analytics logic in code, organizations that want Git-based review and version control for metrics, and products that expect a large number of customer viewers.
Embed Options
Holistics' embedded analytics offering includes unlimited dashboard viewers, white labeling, dynamic row-level permissions to scope each customer to their own data, and interactive visualizations.
Key Features
Holistics includes a code-based modeling layer where analytics logic is defined once and reused across reports, Git version control, prebuilt datasets for self-service exploration, dynamic row-level permissions, and white labeling for embedded dashboards.
Pricing
Holistics' embedded analytics is custom priced through sales, with unlimited dashboard viewers. Its standard plans start with the Entry plan at $800/month billed annually ($960 billed monthly), covering the first 10 users and 100 reports. The Standard plan is $1,000/month billed annually with unlimited reports, and the Security Compliance Suite is $2,000/month billed annually. A free trial is available.
Source: Holistics pricing.
Trade-offs
Embedded analytics requires a custom quote rather than a published price. The code-based modeling layer works best for teams with SQL and engineering skills, and it takes more upfront setup than point-and-click tools.
15. Embeddable
Best for: engineering-led SaaS teams that want native, code-first embedded components
Embeddable is a developer-first embedded analytics platform. Data models and chart components live in your own code repository, are reviewed and version-controlled like the rest of your application, and are pushed to Embeddable through its SDK.
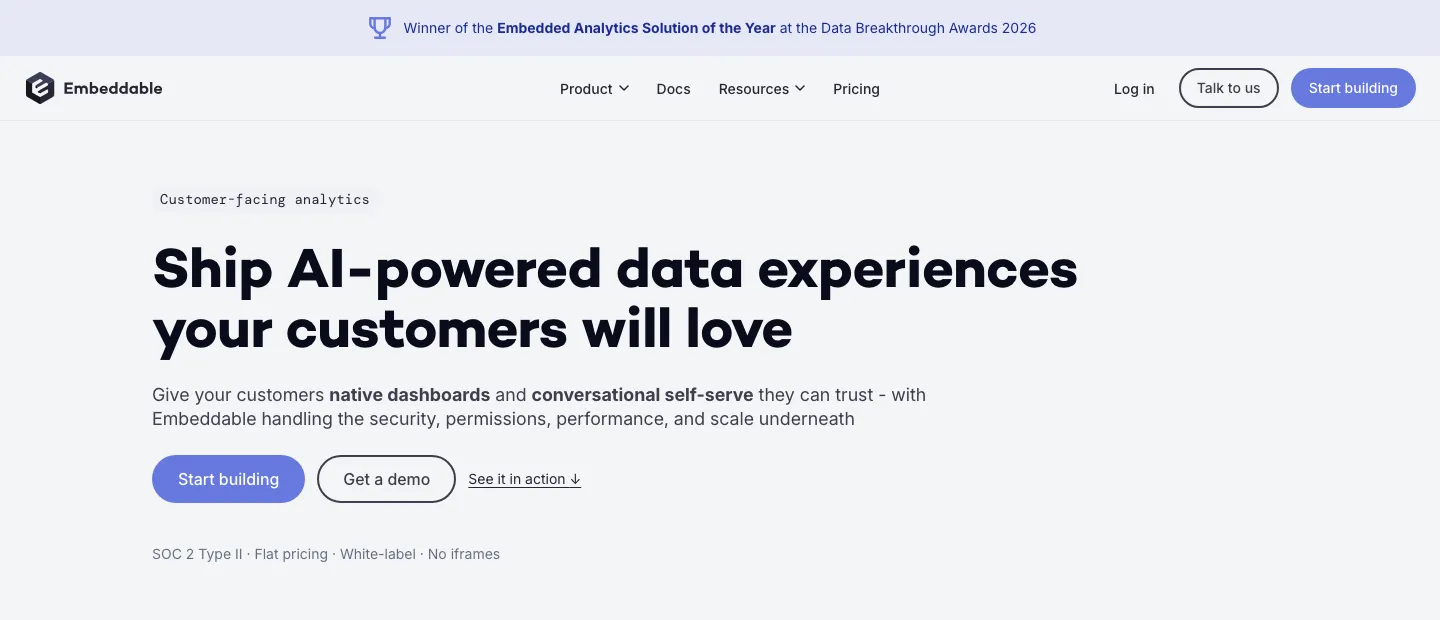
Embeddable's customer-facing analytics homepage (captured September 2026).
Who Should Consider Embeddable
Embeddable suits SaaS teams with frontend engineers who want full control over how analytics look and behave, products where an iframe is not acceptable, and teams that want flat pricing without usage-based metering.
Embed Options
Embeddable renders as a single web component that works in React, Vue, or plain HTML, rather than an iframe. It supports both single-tenant and multi-tenant applications, with row-level security scoping access by user or tenant. White labeling is included.
Key Features
Embeddable includes code-first data models and components managed in your repository, a no-code builder so non-technical teammates can make changes, multi-tier caching, row-level security, and connections to your data source without copying customer data into a separate analytics warehouse.
Pricing
Embeddable uses a flat monthly subscription with unlimited usage and every feature included. Prices are not published: plans for startups, scale-ups, and enterprises are quoted based on project scope after a scoping conversation.
Source: Embeddable pricing.
Trade-offs
The code-first model requires engineering time to build and maintain components, so it is slower to get started than drag-and-drop tools for teams without frontend capacity. Pricing is only available through a scoping call.
16. Qrvey
Best for: SaaS platforms with many tenants that want built-in multi-tenant security, customer self-service, and deployment in their own cloud
Qrvey is an embedded analytics platform built specifically for SaaS companies. It comes in two editions: Qrvey Pro, which works with your existing data engine for teams that already have an analytics database, and Qrvey Ultra, which adds a built-in data engine and transformation layer.
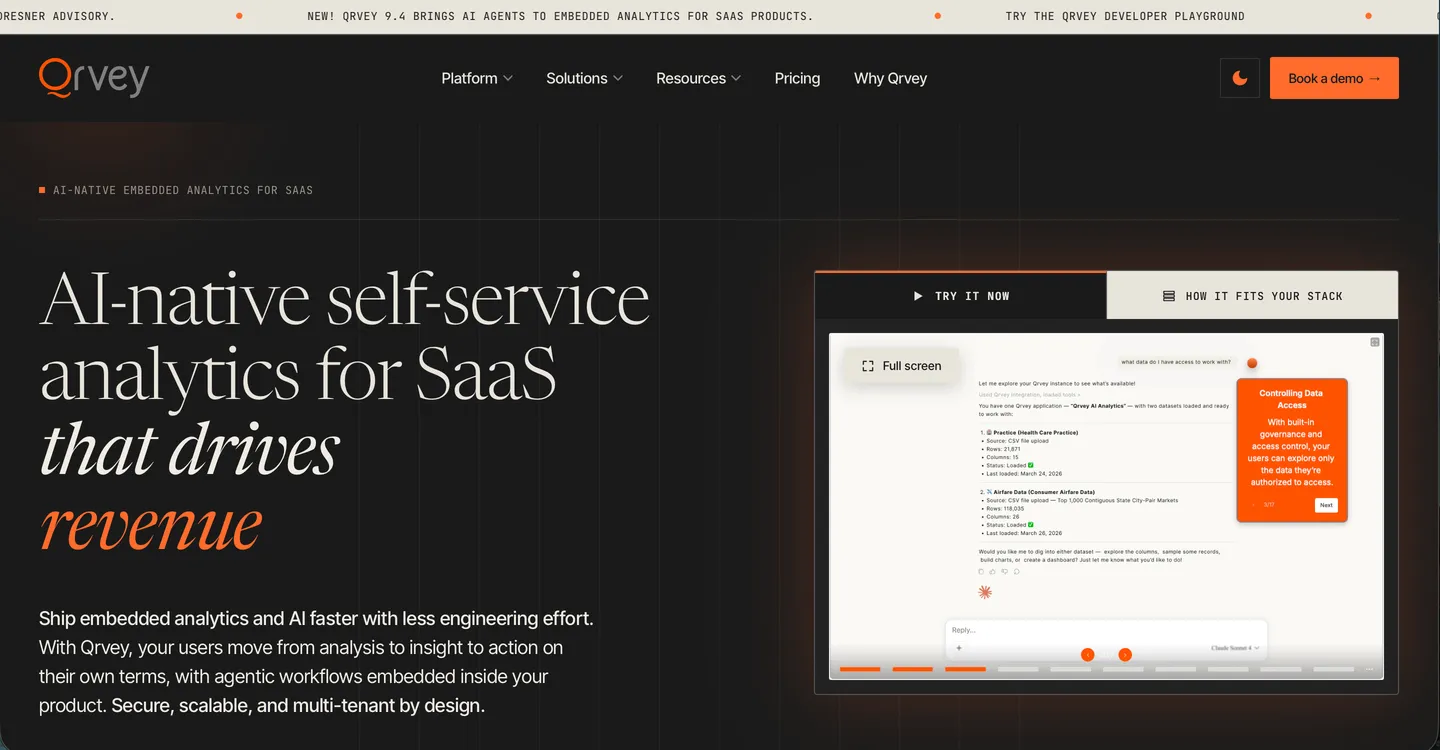
Qrvey's embedded analytics homepage (captured September 2026).
Who Should Consider Qrvey
Qrvey suits SaaS companies serving a large and growing number of tenants, teams that must deploy analytics inside their own AWS, Azure, or Google Cloud environment, and products where customers should be able to build their own dashboards and reports.
Embed Options
Qrvey embeds self-service dashboards and reporting inside your application, with white labeling and APIs included on both editions. A Developer Playground lets teams try the embedding experience before talking to sales.
Key Features
Qrvey includes multi-tenant security, self-service embedded analytics, reporting and automation, AI-driven insights with support for GPT, Gemini, Cohere, and Claude models, deployment to your own cloud, and, on the Ultra edition, a built-in data engine and transformation layer that works from any data source.
Pricing
Qrvey does not publish dollar amounts. Both editions use flat-rate licensing with unlimited users, dashboards, instances, data, and connections, and pricing is shared within 24 hours of a request. A perpetual license is available on both editions as a one-time alternative to a subscription. No free trial is listed, but the Developer Playground and Demo Center are available.
Source: Qrvey pricing.
Trade-offs
Pricing is quote-only, which makes early budgeting harder. Qrvey Pro assumes your data is already in an analytics-ready database, so teams starting from raw operational data need Ultra, which adds cost and setup. Running in your own cloud gives you control over where data lives, but your team also takes on responsibility for that cloud environment.
17. Amazon QuickSight
Best for: teams building on AWS that want session-based pricing for large or unpredictable numbers of viewers
Amazon QuickSight, now named Amazon Quick Sight as part of the Amazon Quick suite, is AWS's cloud business intelligence service. Embedding is available on its Enterprise Edition, and its reader capacity pricing is designed for embedded applications where user counts are hard to predict.
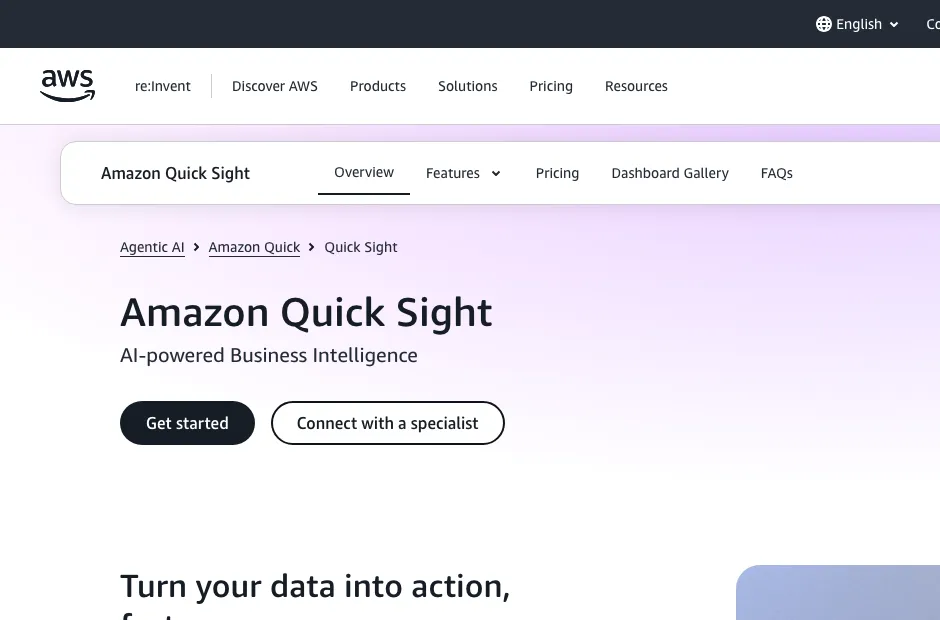
Amazon Quick Sight's product page on AWS (captured September 2026).
Who Should Consider Amazon QuickSight
Amazon QuickSight suits teams whose product and data already run on AWS, products with many occasional viewers where session-based billing costs less than per-user licenses, and teams comfortable managing access through AWS.
Embed Options
QuickSight offers two ways to embed. A 1-click embed code works for registered users inside internal applications. The embedding APIs generate a one-time embed code for internal applications that users sign in to, or for external applications that anyone can access. For dashboards embedded for anonymous users, row-level security with session tags filters each viewer's data, and namespaces separate users for multi-tenant deployments.
Key Features
QuickSight includes dashboard and visual embedding, embedding for registered and anonymous users, row-level security including tag-based rules for anonymous embedding, namespaces for multi-tenancy, and AI-powered BI capabilities within Amazon Quick.
Pricing
Authors cost $24 per user per month, or $40 for Author Pro. Named readers cost $3 per user per month, or $20 for Reader Pro. For embedded use, reader capacity pricing starts at $250/month for 500 sessions, with each additional session at $0.50, and annual plans start at $20,000/year for 50,000 sessions. A session is a 30-minute period. A $250/month infrastructure fee per account applies if the account has Pro users or Q&A enabled. A free trial is available.
Source: Amazon QuickSight pricing.
Trade-offs
Session-based billing ties cost to customer engagement, so a jump in usage raises the bill. QuickSight is tightly coupled to AWS, and embedding for external users requires Enterprise Edition and API integration work. Tag-based row-level security applies only to anonymous embedding, so registered-user deployments need a different isolation setup.
Embedding Methods Explained: iframe vs. Web Components vs. SDK vs. API
The embed method decides how much work it takes to ship and how native the result feels.
- iframe. The vendor hosts the dashboard and your app loads it in a frame, usually through a signed URL. It is the fastest way to ship and is supported by most tools, including Sigma, Omni, GoodData, Sisense, and Metabase static embedding. The trade-off is limited control over styling and layout.
- Web components. Custom HTML elements render analytics directly in your page and work across frameworks. Tableau's Embedding API v3, Qlik's qlik-embed, GoodData, Luzmo, and Embeddable use this approach.
- SDKs. Framework-specific libraries, usually for React or Vue, give component-level control so analytics can match your design system. Examples include Draxlr's React and Vue SDKs, Metabase's React SDK, Sisense's Compose SDK, ThoughtSpot's Visual Embed SDK, and Sigma's React Embed SDK.
- APIs. Backend and REST APIs let you generate embed tokens, provision tenants, and automate content, or build a fully custom interface. Draxlr, Qlik, Tableau, GoodData, Sigma, and Amazon QuickSight all provide them.
Whichever method you choose, embed tokens must be generated on your server and scoped to the current customer. Our guide to secure token-based dashboard embedding covers how to do that without leaking tenant data.
Multi-Tenancy: How Each Customer Sees Only Their Own Data
Every customer-facing deployment relies on one of three isolation patterns. Our comparison of row-level, schema, and database isolation models goes deeper on each one.
- Shared tables with row-level filtering. All customers share the same tables, and a tenant filter is applied to every query, either from a signed embed token or from row-level security rules. This is the cheapest pattern to run and the one used by most tools on this list, including Draxlr, Luzmo, Power BI Embedded, Sisense, Omni, Tableau, Domo, and Amazon QuickSight. The risk is that a single misconfigured filter can show one customer another customer's data. See row-level security for multi-tenant analytics for how to enforce it in the database.
- A separate schema or database per tenant. Each customer's data lives in its own schema or database, and the dashboard connects to the right one per tenant. Isolation is stronger, but there is more infrastructure to operate. Sigma's source swapping supports this pattern.
- Tenant objects inside the analytics tool. The tool itself models tenants, so content can be rolled out to every customer and customized per customer. GoodData's hierarchical workspaces, Sigma Tenants, and Amazon QuickSight namespaces work this way.
Before launch, test isolation directly: sign in as two test customers, change filter values in the embed URL or token, and confirm that neither customer can ever see the other's data.
Embedded Analytics Pricing Models and Hidden Costs
Entry prices are a poor guide to what you will pay, because each vendor bills against a different unit.
- Flat or platform pricing. One fee regardless of viewers. Draxlr, Embeddable, and Qrvey work this way, and Holistics' embedded plan includes unlimited viewers. This is the most predictable model as your customer base grows.
- Per user or per viewer. Metabase interactive embedding, Looker viewer seats, Tableau role-based licenses, and QuickSight named readers. It is often cheapest with a few users and most expensive at scale.
- Customer usage. Luzmo's price scales with customer adoption, so costs rise with engagement.
- Capacity, sessions, or credits. Power BI Embedded capacity SKUs, Qlik data volume, QuickSight reader sessions, and Domo consumption credits. Costs follow usage and concurrency rather than headcount.
- Per workspace. GoodData's Professional plan charges a platform fee plus the number of workspaces, which usually tracks the number of customers.
Hidden costs to budget for:
- Plan gates for white labeling, multi-tenancy, and SSO, such as Sisense Enterprise and ThoughtSpot Embedded Enterprise.
- Minimums and platform fees, such as Looker's platform fee before any viewer seats and QuickSight's $250/month infrastructure fee when Pro users or Q&A are enabled.
- Warehouse compute from live queries, which Sigma users pay for in their warehouse.
- AI usage caps, such as monthly AI query or credit limits that your customers' questions draw down.
- Extra environments for development and staging, such as GoodData Enterprise's three environments compared with one on Professional.
- Engineering time to build semantic models, code-first components, or custom tenant isolation.
For a full budgeting walkthrough, see our embedded analytics cost guide.
What 500 Customer Users Cost
The table below applies the list prices and estimates from each profile above to one scenario: 500 customer users who interact with embedded dashboards every month.
| Tool | How the 500 users are billed | Estimated monthly cost |
|---|---|---|
| Draxlr (Premium) | Unlimited customer viewers included | $75 |
| Amazon QuickSight (reader capacity, monthly) | 500 sessions included, $0.50 per additional 30-minute session | $250 at 1 session per user, ~$1,000 at 4 sessions per user |
| Power BI Embedded (A1) | Capacity, not users | From ~$735, rising if concurrency needs more capacity |
| Metabase (Pro, interactive embedding) | 10 users included, 490 more at $12/user | ~$6,455 |
| Looker | ~$60,000/year platform plus ~$400/viewer/year | ~$21,700 |
Draxlr's figure is the Premium plan; full-app embedding and row-level security start on the Power plan at $250/month. These estimates exclude implementation time, hosting, warehouse compute, and negotiated discounts. Luzmo is left out because its price scales with customer usage above the €1,995/month starting point, and the quote-based tools (Sisense, ThoughtSpot Embedded Enterprise, Tableau, Domo, GoodData, Sigma, Omni, Holistics' embedded plan, Embeddable, and Qrvey) are left out because they do not publish prices. Before signing, ask every vendor for a written quote at your current viewer count and at your projected count 12 to 24 months out.
Build vs. Buy: Should You Build Embedded Analytics In-House?
Building customer-facing analytics yourself means more than adding a charting library. You also need a query layer, secure embed tokens, tenant isolation, caching, filters and drill-down, exports and scheduled reports, white labeling, and ongoing maintenance, all of which take engineering time away from your core product.
Building can make sense when you need a single, highly custom view that no vendor supports, the set of charts is small and rarely changes, or your security requirements rule out every vendor.
Buying usually makes sense when customers expect many dashboards with filters, drill-down, and exports, when you need to ship in weeks rather than quarters, or when your engineering team should stay focused on the product itself.
For a cost-based answer, see whether it is cheaper to build embedded analytics in-house or use a tool.
AI in Embedded Analytics: What to Check
Natural language questions and AI-generated insights are now standard in vendor demos, including ThoughtSpot's Spotter, Sisense Intelligence, Qlik Staige, Looker's Gemini integration, Omni's AI querying, and Draxlr's AI text-to-SQL and MCP server. Before exposing AI to customers, check four things:
- Tenant scope. AI-generated queries must obey the same tenant filters as dashboards, so a customer can never ask a question that returns another customer's data.
- Grounded answers. Tools with a semantic layer, such as GoodData, Omni, and Looker, can generate answers from governed metric definitions rather than free-form SQL, which keeps numbers consistent with your dashboards.
- Read-only access. AI should never be able to modify data. Our guide to read-only, tenant-aware MCP access for SQL explains why this is harder to enforce than it looks.
- Usage limits and model choice. Check whether AI usage is capped or metered (ThoughtSpot, for example, does not charge for LLM tokens), and whether you can choose the model. Qrvey supports GPT, Gemini, Cohere, and Claude, and Draxlr's self-hosted option lets you connect any LLM.
How to Choose the Right Embedded Analytics Tool
Work through these five questions in order. Each one removes tools from your shortlist.
1. Where does your data live?
- Application database only (PostgreSQL, MySQL, SQL Server). Tools that query SQL databases directly get you to a first dashboard without building a warehouse or model first: Draxlr and Metabase.
- Cloud warehouse (Snowflake, BigQuery, Databricks). Warehouse-centric tools become strong options: Sigma, Omni, ThoughtSpot, and Looker. Remember that live queries from customer dashboards consume warehouse compute.
- No central data store yet. Domo includes data connectors and ETL, so it covers ingestion as well as dashboards.
2. Do you need a semantic layer?
If many dashboards across many tenants must share the same metric definitions, and you have a data team to maintain a model, choose a tool with a modeling layer: Looker, GoodData, Omni, or Holistics. If a small product team needs to ship dashboards on top of existing SQL, a modeling layer adds setup time you may not need yet.
3. How native does the embed need to feel?
An iframe embed is the fastest to ship and works with almost every tool on this list. If dashboards must inherit your design system and behave like native product features, shortlist tools with SDK or web-component embedding: Draxlr (React and Vue SDKs), Luzmo, Embeddable, Sisense (Compose SDK), ThoughtSpot (Visual Embed SDK), and Tableau (Embedding API v3). Then check which plan white labeling is on, using the comparison table above.
4. How is each customer's data isolated, and on which plan?
Ask every vendor to show the exact mechanism. Tenant isolation is handled through filters passed in signed tokens (Domo, Omni, Tableau), row-level security (Draxlr, Luzmo, Power BI Embedded, Sisense), or separate workspaces and tenants (GoodData, Sigma). Also confirm the plan: native multi-tenancy is part of Sisense's Enterprise plan, and multi-tenancy by organization is part of ThoughtSpot's Embedded Enterprise plan.
5. Price it at your real viewer count
Entry prices hide how costs grow. Match each shortlisted tool to its pricing model, use the 500-user cost comparison above as a starting point, and ask every vendor for a written quote at your current viewer count and at your projected count 12 to 24 months out.
Vendor Evaluation Checklist: 12 Questions to Ask Before You Buy
Use these questions in demos and RFPs. Vague answers to any of them are a warning sign.
- Can you show exactly how tenant isolation is enforced, and what happens if a filter is misconfigured?
- Which plan includes white labeling, and does it remove your logo, domain, fonts, and branding from exports and emails?
- Which plan includes multi-tenancy, SSO, and audit logs?
- How is the bill calculated, and what will it be at our viewer count today and in 24 months?
- Are there minimum commitments, platform fees, or charges per environment?
- Which embed methods (iframe, web components, SDK, API) are available on the plan we would buy?
- Do dashboards query our database live or a cached copy, and how fresh is the data?
- Who pays for the compute when customers load dashboards?
- Can customers build or edit their own dashboards, and is that priced separately?
- How does AI respect tenant permissions, and is AI usage metered?
- Which compliance reports can you share, such as SOC 2, a HIPAA BAA, or GDPR terms, and where can our data be hosted?
- Is there a trial, sandbox, or developer playground where we can test embedding before signing?
Conclusion
There is no single best embedded analytics tool. The right choice depends on where your data lives, whether you need a semantic layer, how native the embed must feel, and how your bill grows with your customer base. Based on the profiles above:
- SaaS teams on SQL databases that want flat pricing and a fast first embed: Draxlr (our product), or Metabase if read-only static embeds are enough.
- Products where analytics is a design-led differentiator: Luzmo, Embeddable, or Sisense.
- Governed metrics shared across many tenants: GoodData, Looker, Omni, or Holistics.
- Organizations already standardized on a vendor: Power BI Embedded for Microsoft, Tableau for Salesforce, Looker for Google Cloud, Amazon QuickSight for AWS, or Qlik for existing Qlik customers.
- SaaS platforms with many tenants that need to deploy in their own cloud: Qrvey.
- Warehouse-centric products that need write-back: Sigma.
- Natural language exploration for end users: ThoughtSpot.
- Teams without a data stack that want one vendor for everything: Domo.
Shortlist two or three tools, then run the same pilot on each one. Embed one real dashboard in staging with tenant filtering turned on, measure load times on production-sized data, confirm white labeling on the plan you would actually buy, and get pricing in writing at your projected viewer count.
FAQs
1. What are embedded analytics tools?
Tools that let you embed dashboards, charts, and reporting directly inside your application using secure components or iframes.
2. What is the best embedded analytics tool for SaaS startups?
It depends on budget, data setup, and engineering capacity. Startups on a tight budget usually look for published pricing, white labeling on an entry plan, and no per-viewer fees: Draxlr (our product) starts at $75/month with unlimited customer viewers, and Metabase's open-source edition supports free static embedding with a Metabase badge. Teams with frontend engineers who want native components can consider Embeddable or Luzmo, and teams already on a cloud warehouse can consider Sigma.
3. What is the best embedded analytics software for a SaaS product built on a SQL database?
It depends on where your data lives, how many customers will view dashboards, and how much engineering time you can give the embed. For a SaaS product on Postgres, MySQL, or a SQL warehouse such as Snowflake, BigQuery, or ClickHouse, the requirements that matter most are direct database connectivity, white labeling, filtering each customer to their own rows, and pricing that does not grow with viewer count. Draxlr (our product) covers all four: white-labeled dashboard embedding with unlimited customer viewers and embed snippets for HTML, React, and Vue starts at $75/month, and row-level security comes with the Power plan at $250/month. Metabase fits teams that want open source, though interactive embedding adds per-user fees. Teams that need governed metrics shared across many tenants usually shortlist Looker or GoodData, which take longer to set up because the data model comes first.
4. Which embedded analytics tool has the most affordable pricing?
Draxlr starts at $75/month for white-labeled dashboard embedding with unlimited customer viewers, and full-app embedding with row-level security is on the Power plan at $250/month. Luzmo starts at €1,995/month billed annually, with white labeling included. Metabase starts at $575/month Pro but adds $12/user/month in viewer fees. Power BI Embedded starts at approximately $735/month. ThoughtSpot's embedded Developer plan is free for one year for up to 10 users and 25M rows, and its Embedded Enterprise plan is quote-based.
5. Do embedded analytics tools charge per customer viewer?
It depends on the tool. Metabase charges $12/month per signed-in user for interactive embedding, while static embeds have no viewer fee. Looker charges about $400 per viewer per year. ThoughtSpot's Embedded Enterprise plan is quoted through sales. Luzmo's price scales with customer usage. Draxlr, Holistics, and Embeddable do not charge per viewer, and GoodData prices by workspace with unlimited users.
6. How long does it take to embed dashboards using these tools?
With Draxlr, most teams have their first embedded dashboard live within one to two weeks of connecting their database. Luzmo says its customers deliver dashboards in days using its drag-and-drop builder. Tools built around a semantic layer, such as Looker, GoodData, Omni, and Holistics, take longer because the data model has to be built first, and ThoughtSpot needs data preparation to make natural language search reliable. Implementations on these platforms often take several weeks to months.
7. Can I white-label embedded analytics dashboards?
Yes, most tools support white labeling, but it is gated differently. Draxlr includes white labeling in the $75/month Premium plan. Metabase includes it from the $575/month Pro plan. Luzmo includes it in its single plan from €1,995/month. Sisense includes full white labeling on its Enterprise plan. Looker, Qlik, and ThoughtSpot include white labeling but require enterprise contracts.
8. How much do embedded analytics tools cost?
Published entry prices range from $75/month for Draxlr Premium to about $60,000/year for Looker's base platform, and many vendors, including Sisense, Tableau, Domo, GoodData, Sigma, Omni, Qrvey, and Embeddable, only share pricing through sales. For 500 customer users who interact with dashboards every month, our estimates range from $75/month to about $21,700/month, depending on whether a tool charges a flat fee, per user, or per session.
9. Should you build or buy embedded analytics?
Most SaaS teams should buy. Building in-house means maintaining a query layer, secure embed tokens, tenant isolation, caching, exports, and white labeling on top of the charts themselves. Building makes sense only when you need a single highly custom view, the set of charts rarely changes, or no vendor meets your security requirements.
10. What is the difference between embedded analytics and traditional BI?
Traditional BI serves internal employees in a separate tool and is usually priced per internal seat. Embedded analytics serves your customers inside your own product, so it must isolate each customer's data, match your product's design, and stay affordable as the number of external viewers grows.
11. Is iframe or SDK embedding better?
iframe embedding is faster to ship and is supported by almost every tool, but it offers limited control over styling. SDK and web component embedding take more engineering work but let dashboards match your design system and behave like native product features. Choose SDK embedding when customers use analytics frequently and the experience needs to feel native.
12. Do you need a semantic layer for embedded analytics?
You need a semantic layer when many dashboards across many tenants must share consistent metric definitions and you have a data team to maintain the model, which is where Looker, GoodData, Omni, and Holistics fit. Small product teams shipping dashboards on existing SQL databases can usually start without one and reach a first embedded dashboard sooner.
13. Is there an open-source embedded analytics tool?
Yes. Metabase's open-source edition is free to self-host and supports static embedding with a Powered by Metabase badge. Interactive embedding, white labeling, and the React SDK require its paid Pro plan.
14. What is an embedded SQL dashboard?
An embedded SQL dashboard is a dashboard that lives inside your own application, not in a separate BI tool. It queries your SQL database directly and shows charts, tables, and KPIs in your product's UI under your branding, with each customer limited to their own data.
15. Do I need to know SQL to build embedded dashboards?
No. Most embedded analytics tools pair a visual query builder, and often AI querying, with a SQL editor for people who want full control. In Draxlr, you can build each chart with the visual query builder, generate the SQL from a plain-English question, or write it yourself in the SQL editor. Your customers never need SQL to view the embedded dashboards.
About the author

Ameena is the founder of Draxlr, a modern business intelligence platform focused on making data analysis simpler and faster. She writes about embedded analytics, databases, SQL, dashboards, and building scalable data products for modern teams.
If you have questions about anything in this guide, or want to compare options for your specific stack, you can try Draxlr free, or reach out directly through the Draxlr team.