How to Add Self-Serve Customer-Facing Analytics to Your SaaS
Four decisions to make before you build self-serve customer-facing analytics, then a full app embed walkthrough with row-level security and a two-account test.
A customer asks for last quarter's numbers split by region. You build the view. Two weeks later they want the same thing split by region and plan tier. The request after that arrives from a different account, same shape, different columns. At some point the honest answer stops being "we'll add that chart" and becomes "you should be able to build that chart yourself."
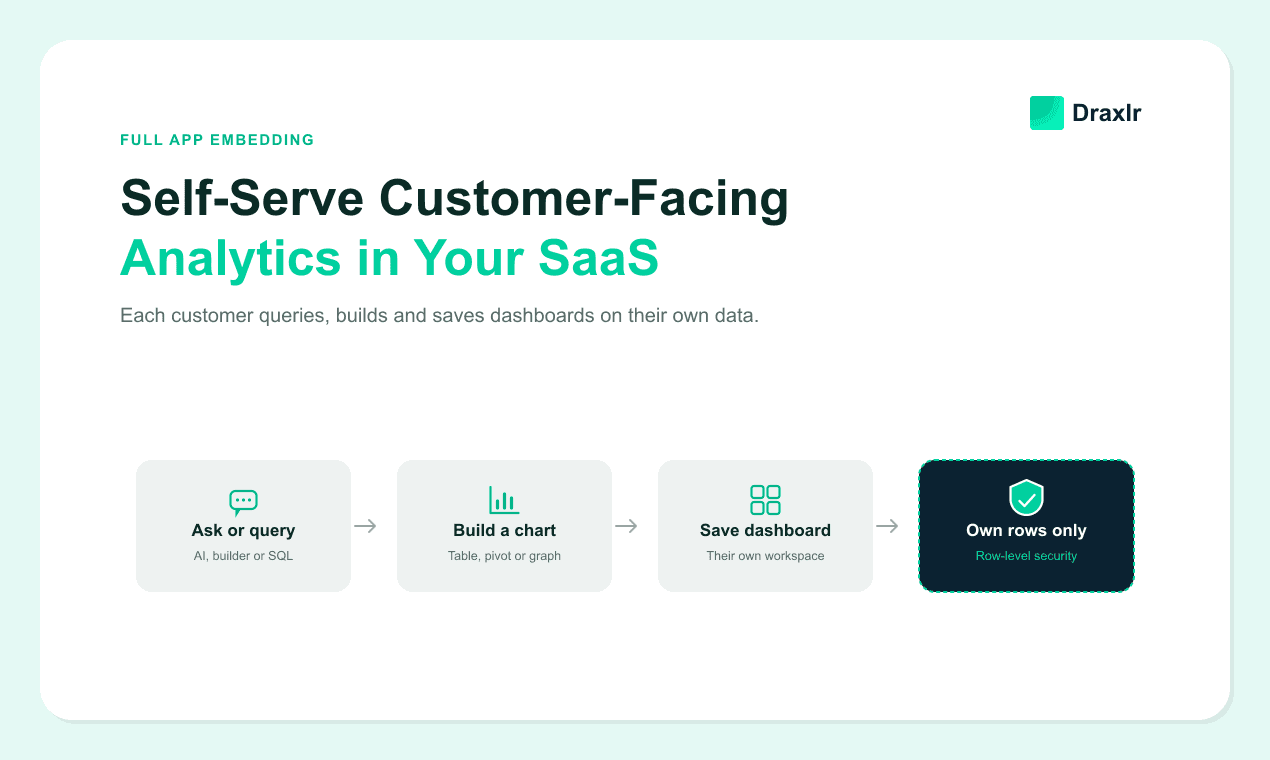
That shift is what self-serve customer-facing analytics means in practice. Instead of shipping fixed views and absorbing every follow-up as a ticket, you give each customer a place inside your product where they can query their own data, build their own dashboards, and get answers nobody on your team anticipated, while still seeing nothing but their own rows.
This guide covers the four decisions that determine how hard the build turns out to be, then walks the whole thing end to end with Draxlr's full app embed, including the row-level security setup and the two-account test that proves the isolation actually holds.
Key Takeaways
- 69% of product leaders say analytics still aren't easily accessible, and 65% of teams make decisions without referencing data they already have (Sisense and UserEvidence, "The State of Analytics 2026," survey of 267 product leaders).
- 86% of embedded analytics buyers rate self-service as of key importance, and 80% say customizable dashboards influenced their buying decision (insightsoftware and Hanover Research, "Embedded Analytics Insights for 2024").
- Four decisions set the difficulty before you write any code, and the hardest one is your tenant rule, not your chart library.
- Draxlr applies row-level security at the analytics layer using a group and the attribute values your backend sends. It does not ride on Postgres native row-level security, which cannot work when one stored credential runs every customer's query.
- The two-account test is the only thing that proves tenant isolation. Run the broadest query you can from two accounts and compare the counts.
What self-serve customer-facing analytics actually is
Self-serve customer-facing analytics is analytics inside your product where the customer, not your team, decides what question gets asked. They pick the dimensions, the date range, and the chart. Your job shifts from producing views to defining the boundary around what each account is allowed to touch.
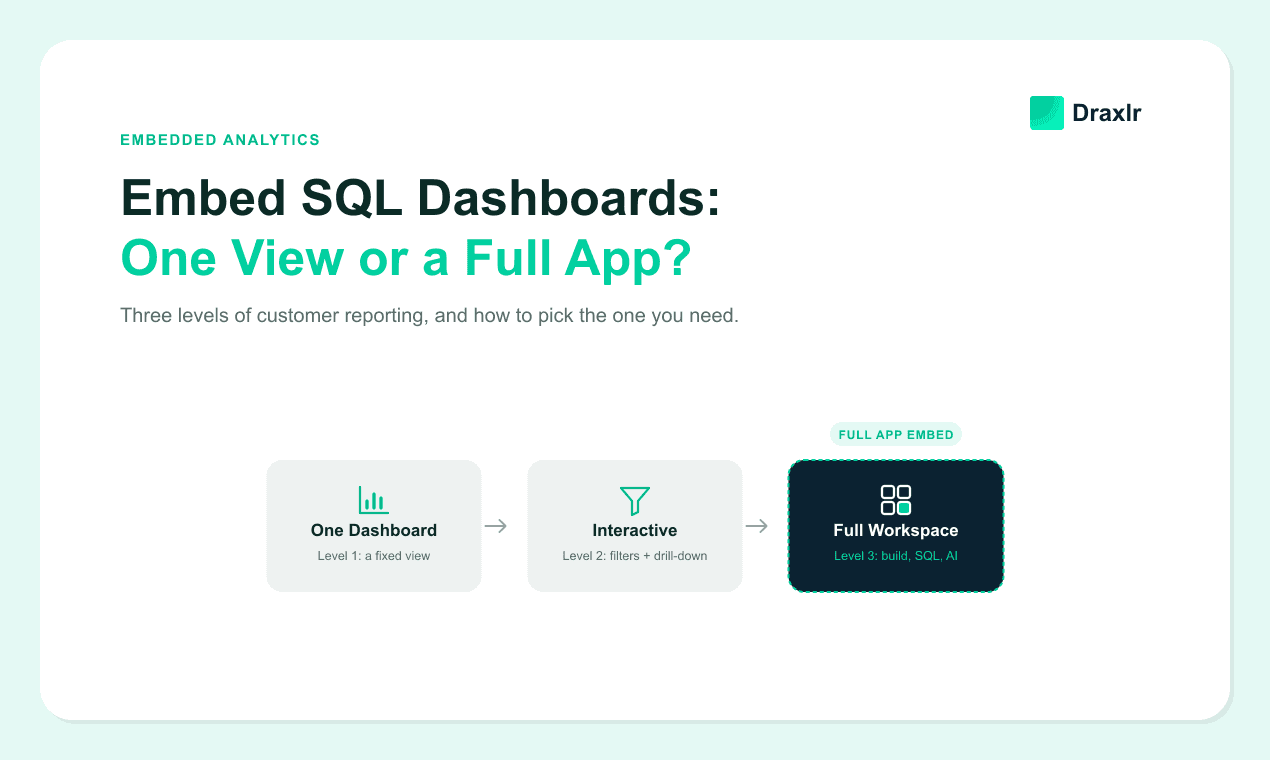
The distinction matters because three very different things all get called "analytics in the product," and they cost wildly different amounts to ship.
Most teams start at level one, spend a year at level two, and only reach level three when the chart requests outgrow the roadmap. The signals that you have arrived at that point show up as the same request repeating across unrelated accounts rather than one loud customer, which is worth checking against the five readiness signals before you commit engineering time to the wrong fix.
The market data says customers notice when you get there. In the insightsoftware and Hanover Research survey of embedded analytics buyers, 86% rated self-service as of key importance and 80% said customizable dashboards influenced their decision to buy (insightsoftware, "Embedded Analytics Insights for 2024"). Those are the two capabilities that separate level three from level two.
The four decisions to make before you build
Every expensive rebuild I have seen traces back to one of these four being answered implicitly instead of deliberately. None of them are about chart libraries.
Decision 1: What is your tenant rule?
Write down the single column that identifies a customer, then check that every table you plan to expose either carries that column or reaches it through exactly one join. That sentence is the whole decision, and it is the one that quietly fails.
The failure mode is specific. Your orders table has account_id, so the first dashboard works. Then you expose order_items, which only has order_id, and the tenant boundary now depends on a join the filter does not know about. You either add the column, add a view that resolves it, or leave that table out. Picking the third option on day one is far cheaper than discovering the problem after a customer sees someone else's line items.
Do this inventory on paper before you touch a tool. For each table, note the tenant column, or the one join that resolves it, or the decision to exclude it.
Decision 2: Where do the analytics live in your UI?
A fixed dashboard on a page you already own is a different product than a workspace with its own navigation. The fixed dashboard fits neatly between your existing header and sidebar. A workspace needs real estate, usually a full-width route, because the customer will be clicking into a query builder and back out.
The cost difference between the two is mostly about how much surface you are agreeing to support, and the comparison of one dashboard versus a full app embed comes down to whether new customer questions should reach your backlog or not. If a handful of fixed charts genuinely covers what customers ask for, level two is the right stopping point and this guide is premature.
Screen size follows from that choice rather than being a separate decision. A fixed dashboard reads fine on a phone, and Draxlr's dashboard embed builder has a responsive preview so you can check yours on both before you ship it. A full workspace is a desktop surface by nature, because nobody composes a query or lays out a dashboard on a phone, so give it a full-width desktop route rather than a slot in your mobile nav.
Decision 3: Where do the queries run?
Three options, in rising order of cost. Point the analytics layer at your production database, point it at a read replica, or build a warehouse and pipeline into it.
Production works for small datasets and breaks the first time a customer writes a query with an accidental cross join. A read replica is the right default for most B2B SaaS, because customer-facing queries stop competing with your application's writes and a slow query degrades a dashboard rather than your checkout flow. A warehouse earns its cost when the questions span sources your product database never held.
Teams routinely over-build here. Running customer-facing analytics against a read replica with no warehouse and no ETL covers far more products than the category's marketing suggests, and the replica costs a fraction of a pipeline you then have to keep correct. Start there, and move to a warehouse when a real query forces you to.
Decision 4: Build the query layer or embed one?
Building means a query builder UI, a SQL sandbox with guardrails, a chart renderer, a dashboard layout engine, a sharing model, an export pipeline, and a tenant filter that holds across all of it. Embedding means configuring those and writing one backend call.
The honest version of the build case is that you only control the roadmap if you own the code. The honest version of the buy case is arithmetic. At a US senior engineer's fully loaded cost, the budget math for embedded analytics tends to put a from-scratch workspace past six figures before it ships anything a customer sees, and the maintenance never ends because chart requests do not stop arriving.
If you are buying, the thing to compare is not the chart gallery. Compare how each tool isolates tenants, what it costs when 5,000 of your customers log in, and whether it needs a warehouse before it works, which is how the customer-facing SQL analytics tools in this category actually differ from each other. Draxlr sits at the low-overhead end of that comparison because it connects straight to your SQL database with no semantic layer to model first, applies tenant filters at the analytics layer rather than asking you to build them, and charges a flat monthly price with unlimited customer viewers, so the bill does not move when adoption does.
That survey also found teams spending 40% of their time validating AI-generated insights and 29% of AI initiatives stuck in pilot. Worth holding onto when you plan the AI assistant part of this, because an assistant that answers from a correctly scoped dataset is a different proposition than one answering from a pile the customer cannot verify.
Watch the whole thing end to end
The six steps below are the same flow in text, with the exact parameter names and the test at the end.
Step 1: Get the tenant column onto every table you expose
Start from the inventory in Decision 1. For each table you want customers to query, you need the tenant column present on the table itself or available through one join you can express as a filter.
Three ways to close a gap, cheapest first.
- Add the column. Denormalizing
account_idonto a child table is the boring, fast answer. It costs a migration and a backfill, and it makes every downstream filter trivial. - Expose a view instead of the table. Create a database view that joins the child table up to its parent and selects the tenant column alongside the columns customers need. Point the analytics layer at the view.
- Leave it out. A table nobody has asked about does not need to be in the first release.
Do not skip this and plan to "filter it in the dashboard." A filter on a chart is a presentation choice. A customer with a SQL editor can write their own query, and anything that was only filtered at the chart level is wide open.
Step 2: Write the row-level security permission and group
This is where the tenant rule becomes enforcement. In Draxlr, row-level security for embeds has three parts that fit together.
- A permission sets which tables are available and adds the row filters, written against an attribute rather than a hardcoded value, for example
account_id = {accountId}. - A group attaches that permission. The group is the thing your backend names later.
- The embed URL carries the group name plus the signed-in customer's attribute values, such as
accountId: 42.
Draxlr applies those rules to everything the customer does inside the embed. Shared dashboards, their own dashboards, filters, drill-downs, exports, saved queries, the query builder, the SQL editor, and the AI assistant all run inside the same boundary. Tables the permission does not allow are unavailable, and a query that reaches for one returns a permission error instead of rows. The full app embed row-level security docs cover the permission builder in detail.
Attribute values accept numbers, text, booleans, lists of numbers, and lists of text, so an account that spans several regions can be scoped with ["EU", "US"] against an "is one of" rule rather than needing a separate group.
Step 3: Configure the full app embed
Open the Dashboard page, open the dashboard you want customers to see, click Embed at the top right, then Configure full app embed. On a plan without full app embedding the button reads Preview full app embed instead, which still lets you build and preview the whole configuration before you commit.
The builder puts a live preview on the left and Embed Settings on the right. The dashboard you started from is already selected as a shared dashboard. Changes only take effect when you click Apply.
Work through the panels in this order.
- Row-level security. Choose the group from Step 2 first, before you look at anything else. The builder lists the attributes the group uses and lets you type a value so the preview renders as a specific customer. Getting this right first means every later panel is previewed through the same filter your customers will get.
- Shared dashboards. Pick the dashboards every customer sees. These are your opinion about what matters, and they are what stops a new customer landing in an empty room.
- Permissions. Decide what customers can create, with Create and save queries and Create dashboards as separate switches, and which browse-data tools they get from AI assistant, SQL editor, and Query builder. A reasonable first release gives everyone the query builder and dashboards, and holds the SQL editor back for accounts that ask.
- Allowed domains. Add the hosts allowed to load the embed, such as
app.example.com. An empty list allows any site, wildcards are not supported, and local testing needs the port included. - Colors. Set Background color, Card background color, and Primary color. The background color also decides whether the embed renders light or dark. This panel covers the theming most teams need, though matching a product's full design system goes further than three colors, and the work of white-labeling embedded dashboards without forking the tool is mostly about how far a vendor's theming reaches before you are patching CSS.
- Exports. Turn PDF export, Excel export, and CSV export on or off.
- Preview as user. Type a user ID to render the preview as that user. It is sent as
userIdentifier, and each distinct ID gets its own workspace, which makes this the fastest way to sanity-check that two customers really do land in separate spaces.
Only members with Admin or Full access can open the builder, so if the Embed button does nothing useful, check your own access level before you debug anything else.
Step 4: Generate the embed URL from your backend
The builder's Copy the code panel hands you a backend request and a frontend snippet already filled in with your settings. The backend half calls the Generate Embed URL API, and it has to run server-side because the request carries your API secret.
curl -X POST https://api.draxlr.com/api/full-app-embed/generate-embed-url \
  -H "Content-Type: application/json" \
  -d '{
    "apiKey": "YOUR_API_KEY",
    "apiSecret": "YOUR_API_SECRET",
    "databaseId": "665f1c2a9...",
    "userIdentifier": "user_1234",
    "dashboardGroupIds": ["6690aa11bc..."],
    "allowCreateQuery": true,
    "allowCreateDashboard": true,
    "browseDataModules": ["ai", "sql", "visual"],
    "rlsGroup": "Customers",
    "attributes": { "accountId": 42 },
    "configuration": {
      "backgroundColor": "#ffffff",
      "primaryColor": "#6d28d9",
      "showExport": true,
      "showExportPdf": true,
      "showExportExcel": true
    }
  }'
The response is small.
{
  "success": true,
  "embedUrl": "https://app.draxlr.com/embed/full-app?token=iJIUzI1NiIserwdfInR5cCI6IkpXVCJ9..."
}
Four details in that request decide whether this is secure or not.
userIdentifieris your own ID for the signed-in user, and each ID gets its own workspace. Read it from your session on the server. Never accept it from a query string or a request body the browser controls, because that is a one-line account-switching bug.rlsGroupnames the group from Step 2. Leave it out and the embedded user can reach every table and every row in the database. Draxlr's own docs are blunt about this, saying "For customer-facing embeds, always use an RLS group."attributescarries the values your row filters interpolate. Derive them from the server-side session too. Values sent here override values set on the group itself, and any attribute you omit falls back to the group's value.browseDataModulesaccepts any of"ai","sql", and"visual", defaulting to all three. Trimming this list is how you hold back the SQL editor for a first release.
Embed URLs are valid for 24 hours, so generate a fresh one each time the page loads rather than storing one per customer. They also cannot be revoked individually, which means the moment a customer loses access you stop issuing URLs for them and wait out the window. If you are also handling your own tokens around this, the same rules that make token-based dashboard embedding safe apply here, and the most important one is that every tenant-identifying value is read server-side and never round-tripped through the client.
Step 5: Render the embed in your frontend
The frontend half is two elements. Pass the embedUrl your backend returned into data-embedUrl and load the script.
<div
  class="draxlr-embed"
  data-embedUrl="EMBED_URL_FROM_YOUR_BACKEND"
  data-height="1000px"
></div>
<script src="https://app.draxlr.com/embed-full-app.js"></script>
data-height defaults to 1000px and data-width defaults to 100%. A workspace wants room, so give it a full-width route and a generous height rather than squeezing it into a card in your existing layout. The workspace renders above 640px wide, which is the practical reason to route to it from a desktop nav entry rather than a mobile one. If you are rendering this from a framework, fetch the embed URL in whatever server-side data function your router gives you and pass it down as a prop, so the secret stays on the server and the customer always gets a fresh URL.
Step 6: Run the two-account test
Configuration that looks right in a preview is not proof. This is the test that is, and it takes about twenty minutes.
- Pick two real accounts in your own app with genuinely different data, and note the true row count for one table in each. Pull those numbers straight from your database so you have an answer to check against.
- Generate an embed URL for each, through your actual backend code rather than by hand, with each account's own
userIdentifierand attribute values. - Open both in separate browser profiles so sessions cannot bleed into each other.
- Run the broadest query you can from each. Something like
select count(*) from orderswith no where clause. The two counts should differ, and each should match the number you pulled in step one. If both sides show the same total, your filter is not being applied. - Ask the AI assistant a greedy question, such as total revenue across all customers. A correctly scoped embed answers with that account's revenue only. This is worth doing explicitly because the assistant is the surface people forget to test.
- Try a table the permission does not allow. You want a permission error, not an empty result and definitely not rows.
- Swap the attribute value. In your backend call for account A, send account B's value, confirm the data changes to match account B, then put it back. This is the step that proves the boundary is actually driven by what you send rather than by something incidental like which dashboard you opened.
Keep step 4 and step 7 as an automated test if you can. They are cheap to assert and they catch the regression that matters most.
What it costs and how to package it
Full app embedding and row-level security for embeds both sit on Draxlr's Power plan at $250 a month, which also includes 5 databases and 30 internal users. The Premium plan at $75 a month covers dashboard embedding, white labeling, all the embed options, and multi-tenant filters with 2 databases and 10 internal users, which is the right plan if Decision 2 landed you at level two.
The number that changes the packaging conversation is that customer viewers are unlimited on every plan at no additional cost. The customers who log into your product and use the embedded workspace are not billed as users. That means your analytics cost is flat whether 50 accounts use it or 5,000, which points strongly toward bundling it into a tier rather than metering it per seat.
Three packaging patterns that work.
- Bundle it into your mid or top tier. The simplest option, and the one that fits flat upstream pricing. Analytics becomes a reason to upgrade rather than a line item to negotiate.
- Sell it as a flat add-on. Works when a minority of accounts want it badly and the rest would not notice. Keep the add-on price flat for the same reason your cost is flat.
- Split by capability. Give every account the shared dashboards, and gate the query builder, SQL editor, and AI assistant to a higher tier. The builder's Permissions panel already makes this a configuration change rather than a code change, since you can issue different
browseDataModulesper account from the same backend call.
Two cost details worth knowing before you promise anything internally. Customer questions to the AI assistant draw on your organization's AI credits, and queries, dashboard elements, and filters your customers create count toward your plan limits. Neither is large at early volumes, but both scale with adoption in a way the viewer count does not, so watch them once the workspace catches on.
A four-week rollout that does not scare anyone
| Week | What you ship | What you learn |
|---|---|---|
| 1 | The table inventory from Decision 1, plus the permission and group from Step 2, previewed in the builder with two different attribute values. | Which tables are not ready. This is where schema surprises surface, while they are still free to fix. |
| 2 | Two or three shared dashboards, the backend call behind a feature flag, and the two-account test from Step 6. | Whether isolation holds. Nothing goes to a customer until step 4 and step 7 of that test pass. |
| 3 | The flag on for three to five design-partner accounts, with the SQL editor off. | Which saved queries they build. Every one is a shared dashboard you should have shipped. |
| 4 | The queries from week 3 promoted into shared dashboards, the tier opened up, a help doc, and the announcement. | Whether the support queue moves. Track the reporting-request tag against total tickets, not raw count. |
The week 3 observation is the most valuable thing in this schedule. Whatever customers build for themselves in the first fortnight is a direct list of what your fixed reporting was missing, assembled by the people who actually needed it. Promote those into shared dashboards and the next cohort lands somewhere useful on day one.
Mistakes that cost teams a rebuild
- Omitting
rlsGroup"just for now." Without it the embedded user reaches every table and every row. There is no partially-scoped state here. - Exposing a table whose tenant column is two joins away. Add the column or expose a view. A chart-level filter is not a boundary once the customer has a query builder.
- Caching one embed URL for all customers. Each
userIdentifiergets its own workspace, and the URL carries that customer's RLS values. Shared URLs mean shared workspaces. - Leaving allowed domains empty in production. An empty list allows any site to load the embed. Add your app's hosts, with ports for local testing.
- Shipping an empty workspace. A customer dropped into a blank query builder with no shared dashboards does not explore, they leave. Two or three good dashboards are the on-ramp.
- Trusting anything the browser sent.
userIdentifierand every attribute value come from the server-side session. Reading either from a request parameter turns account switching into a URL edit.
FAQ
1. What is the difference between embedded analytics and self-serve customer-facing analytics?
Embedded analytics is the broad category of putting analytics inside another product. Self-serve customer-facing analytics is the specific version where your customers compose their own questions rather than reading views you built. The practical test is whether a new question from a customer creates work for your team. If it does, the analytics are embedded but not self-serve.
2. Do I need a data warehouse to offer self-serve analytics to customers?
No. Most B2B SaaS products can serve customer-facing analytics from a read replica of the production database, which keeps customer queries away from application writes without a pipeline to maintain. A warehouse earns its cost when questions span data sources your product database never held.
3. How do I stop one customer from seeing another customer's data?
Enforce the boundary at the analytics layer, not in the charts. In Draxlr that means a permission holding the row filters, a group attaching it, and a backend call that names the group in rlsGroup and sends the signed-in customer's values in attributes. The filter then applies to dashboards, saved queries, the query builder, the SQL editor, and the AI assistant alike. Prove it with the two-account test rather than trusting the preview.
4. Can customers write their own SQL safely?
Yes, if the row filters sit underneath the editor rather than beside it. A SQL editor inside a correctly configured embed can only read tables the permission allows, and the row filters apply to whatever query gets written. That said, holding the SQL editor back for the first release is a reasonable call, since browseDataModules lets you ship the query builder and AI assistant first and turn SQL on per account later.
5. How long does this take to build?
The configuration work is days, not months. The schedule above puts a design-partner release in week 3, and the long pole is almost always Decision 1, because getting a tenant column onto every table you want to expose can mean migrations and backfills. Teams that already have a clean tenant column on their main tables tend to run the whole thing inside a week.
6. What does it cost to add self-serve customer-facing analytics?
With Draxlr, full app embedding and row-level security for embeds are on the Power plan at $250 a month, and customer viewers are unlimited on every plan, so the cost does not rise as more of your customers use it. Building the same workspace in-house means a query builder, a SQL sandbox, a chart renderer, a dashboard layout engine, and a tenant filter that holds across all of them, which is engineering time measured in quarters rather than a monthly line item.
Start with the two-account test
The shortest path through this is to do Step 2 and Step 6 first and let everything else follow. Write the permission, build the group, generate two embed URLs through your own backend, and compare the counts. Once that passes, the shared dashboards, the colors, and the rollout are all configuration.
Draxlr's Power plan includes a 7-day free trial with no credit card, which is enough to connect a read replica, write the RLS permission, and get both halves of the two-account test passing before you decide anything. Start the trial and configure the embed against your real schema rather than reasoning about it.
About the author

Vivek is a coder and the founder of Draxlr who cares deeply about building good products. He works at the intersection of AI, SQL, dashboards, and embedded analytics, with a strong focus on making complex data workflows feel simple, useful, and fast for real teams.
If you have questions about anything in this guide, or want to compare options for your specific stack, you can email Vivek at vivek@draxlr.com, try Draxlr free, or reach out directly through the Draxlr team.