Best Customer-Facing SQL Analytics Tools for SaaS Teams in 2026
Compare 9 customer-facing SQL analytics tools for SaaS on tenant isolation, cost at 5,000 users, latency, and whether you need a warehouse, with real pricing.
Customer-facing analytics means shipping dashboards to the customers who pay for your product, usually straight from the SQL database your product already runs on, with each customer seeing only their own data. That last part is the whole difficulty. Getting a chart to render inside your app is a weekend project. Getting a thousand different customers to each see their own numbers, correctly and securely, fast enough, and at a predictable cost, is what actually separates these platforms.
This is a technical buyer's guide to nine tools built for that job: Draxlr, Luzmo, GoodData, Sisense, Domo Everywhere, ThoughtSpot Embedded, Metabase, Qrvey, and Power BI Embedded. It focuses on the four things that decide whether customer-facing analytics holds up in production: tenant isolation, cost at scale, latency, and whether you need a data warehouse at all. Every price, plan detail, and feature claim below was verified against each vendor's current pricing and documentation pages, with sources noted where a figure came from a third party rather than the vendor directly. For a broader comparison of 18 platforms, including ones aimed at internal BI, see our embedded analytics tools roundup.
What Customer-Facing Analytics Means
Customer-facing analytics is not the same thing as customer analytics. Tools like Mixpanel, Amplitude, or Zendesk's analytics suite exist so you can understand your customers, tracking their behavior, funnels, and support interactions from the inside. Customer-facing analytics is the opposite direction. It's the dashboards you build so your customers can understand their own data, inside the product they already use. If a support agent is reading the chart, that's customer analytics. If your customer is reading it, that's customer-facing analytics.
It's also a different problem than internal BI. An internal dashboard in Metabase or Looker serves your own team, who can be trusted with broad data access and the occasional broken query. A customer-facing dashboard lives inside a live product, has to look like it belongs there, and has to guarantee that customer A can never see a row of customer B's data. That requirement, tenant isolation, is why this category exists separately from general-purpose BI. If you're new to the broader idea of putting dashboards inside an application, start with what embedded analytics is.
How We Evaluated These Customer-Facing Analytics Tools
Every profile below covers the same ground: what the product is, who it's best for, its strengths and limitations, embedding methods, dashboard depth, how white-labeling is gated, how multi-tenancy is handled, security, pricing, and how fast a team can realistically ship with it. The weight, though, goes on four questions that matter far more for customer-facing analytics than for internal BI:
- Tenant isolation: Is it structurally impossible for one customer to see another's rows, or does that depend on a filter being configured correctly every time?
- Cost at scale: What happens to the bill between 10 customers and 5,000?
- Latency: How fresh is the data a customer sees, and does it stay fast when hundreds of customers open dashboards at once?
- Data warehouse: Can the tool query your production SQL database or a read replica directly, or does it need a warehouse first?
Each of these gets its own section after the tool profiles.
Customer-Facing SQL Analytics Tools Compared at a Glance
| Tool | Best For | Starting Price | White-Labeling | Multi-Tenancy | Embed Method |
|---|---|---|---|---|---|
| Draxlr | SaaS teams wanting fast, flat-rate embedding | $75/month | Included | Row-level security via embed token | HTML, React SDK, Vue SDK, API |
| Luzmo | Design-forward, self-service dashboards | $1,995/month | Included | Row-level security, native | SDK, web components, iframe |
| GoodData | Governed metrics across many workspaces | Quote-based | Included on Professional | Hierarchical workspaces, native | iframe, Web Components, React SDK |
| Sisense | Full React-level UI control | Not published | Enterprise only | Enterprise only | iframe, Compose SDK |
| Domo Everywhere | Enterprises already running Domo | Custom, ~$30k/year cited | Custom deployment | Not native, built manually | Domo Everywhere (custom) |
| ThoughtSpot Embedded | Natural-language self-service | Free Developer tier | Included | Enterprise only, by org | Visual Embed SDK, REST API |
| Metabase | Teams already using it internally | Free (static) / $575/mo Pro | Pro and above | Row/column sandboxing, Pro+ | Static (free) or interactive (billed) |
| Qrvey | SaaS at large tenant scale | Quote-based, flat | Included | Native, 1 to 10,000+ tenants | JS widgets, API (no iframe) |
| Power BI Embedded | Teams already on Azure / Power BI | ~$735/month (A1) | Supported | Row-level security within capacity | JS embedding API |
Pricing verified against each vendor's official pricing page as of September 2026, with third-party corroboration noted individually where a vendor does not publish a dollar figure directly.
The 9 Best Customer-Facing Analytics Tools in 2026
1. Draxlr
Best for SaaS teams that want to ship customer-facing dashboards in days, on flat pricing, without a data-modeling layer.
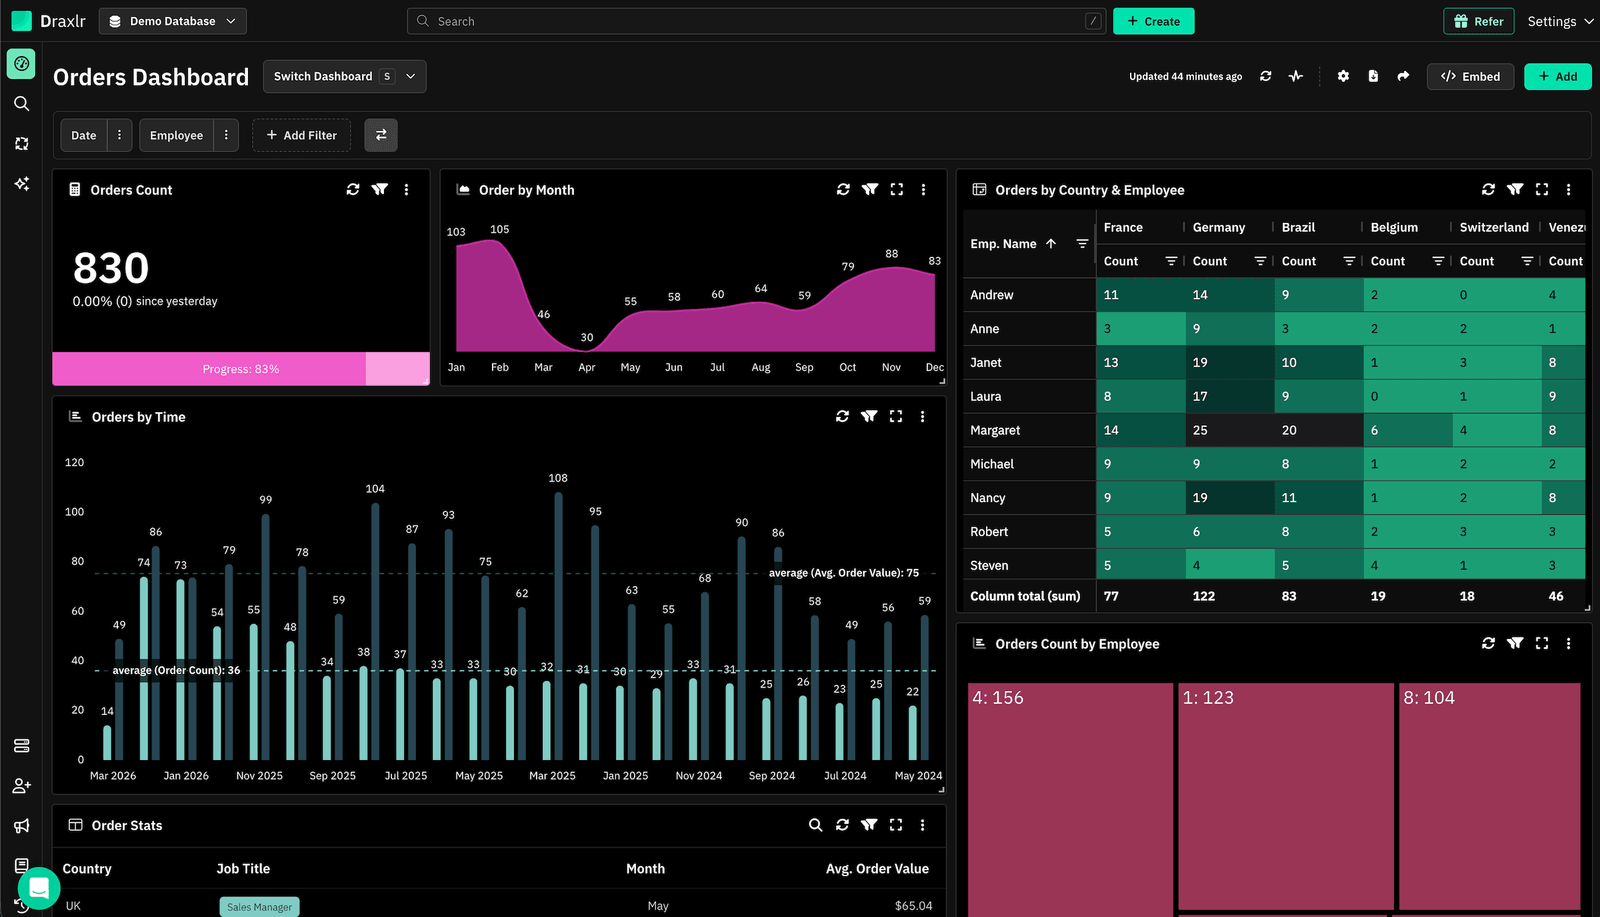
Draxlr is an embedded analytics platform that connects directly to your SQL database and skips the semantic modeling layer most enterprise tools require before you can show a single chart. It supports HTML, React SDK, Vue SDK, and backend API embedding, with ready-to-use code snippets available straight from the dashboard. Non-technical team members can build queries in plain English using the AI SQL tool and technical team members can drop to raw SQL when they need to.
Strengths.
- No semantic layer to build before shipping.
- White-labeling included from the first embedding-capable plan.
- Row-level security for embeds scopes each customer to their own rows across dashboards, saved queries, the SQL editor, and the AI assistant, driven by values your backend sends with the embed token.
- Every embedding plan includes unlimited customer viewers at no additional cost, which matters once your dashboard is in front of hundreds of paying customers rather than a handful of internal teammates.
- Full app embedding goes past fixed dashboards to self-serve customer-facing analytics, giving each customer a query builder, a SQL editor, an AI assistant and dashboards of their own.
Limitations. Draxlr is SQL-native rather than semantic-layer-native, so teams that specifically want a LookML-style governed metrics layer across dozens of data sources will find other tools fit that requirement more directly.
Dashboard capabilities. Interactive charts with drill-down, filters, tooltips, and zoom, configurable real-time refresh intervals, responsive layouts for desktop and mobile, and per-embed export controls.
White-labeling. Included from the $75/month Premium plan. No 'Powered by Draxlr' label.
Multi-tenancy. Built in, through row-level security. You define a permission once, choosing which tables are visible and adding a row rule such as account_id = {accountId}, and attach it to an RLS group. When a customer opens the embed, your backend requests a token with that group's name and the customer's attribute values, for example "rlsGroup": "Customers", "attributes": { "accountId": 42 }. Draxlr then applies the rule to everything that customer does: shared dashboards and their drill-downs and exports, their own saved queries and dashboards, the query builder, the SQL editor, and the AI assistant. Tables the permission doesn't allow return a permission error. Because the rules live in the RLS group, every new dashboard is covered automatically, and there's no JWT scheme to hand-build.
Security and access. Internal users get role-based access levels (Admin, Full, Read, Dashboard) on Premium, with per-user row-level security added on the $250/month Power plan, and SSO plus audit logs available on Enterprise. Row-level security for embeds is included on the $250/month Power plan and above, and the same rules scope embedded customers to their own tenant on every query they run. At the data layer, Draxlr connects to your database over a read-only transaction and never copies or writes to it, stored credentials are encrypted at rest with AES and protected by TLS in transit, query results travel over SSL, and the production stack runs inside a private VPC subnet with daily backups. Live chat and email support are included on every plan. See row-level security for multi-tenant analytics for how the isolation model works underneath, and Draxlr's security practices for the full data-protection detail.
Pricing. Every tier uses flat pricing with no per-viewer or per-embed fee, and customer viewers are always unlimited.
| Plan | Price | Databases | Internal Users | Customer Viewers | Embedding & White-Labeling |
|---|---|---|---|---|---|
| Premium | $75/month | 2 | 10 | Unlimited | All embed options, white-labeling included |
| Power | $250/month | 5 | 30 | Unlimited | Everything in Premium, plus full app embedding and row-level security for embedded customers and internal users |
A 7-day free trial is available with no credit card required. Supported databases include PostgreSQL, MySQL, MariaDB, Microsoft SQL Server, Supabase, PlanetScale, CockroachDB, YugabyteDB, Redshift, BigQuery, Snowflake, ClickHouse, Databricks, Neon, Airtable, and Google Sheets.
Ease of implementation. Teams typically reach their first embedded dashboard in one to two days, since there's no modeling layer standing between the database and the embed.
Who should choose it. SaaS startups and mid-market product teams who need a real embedded dashboard shipped this week, want white-labeling and multi-tenancy included rather than gated behind an enterprise contract, and don't want their bill to grow just because their customer base does.
2. Luzmo
Best for SaaS teams who can who can model MAU growth, want a design-forward, native-feeling embedded experience non-engineers can build themselves.
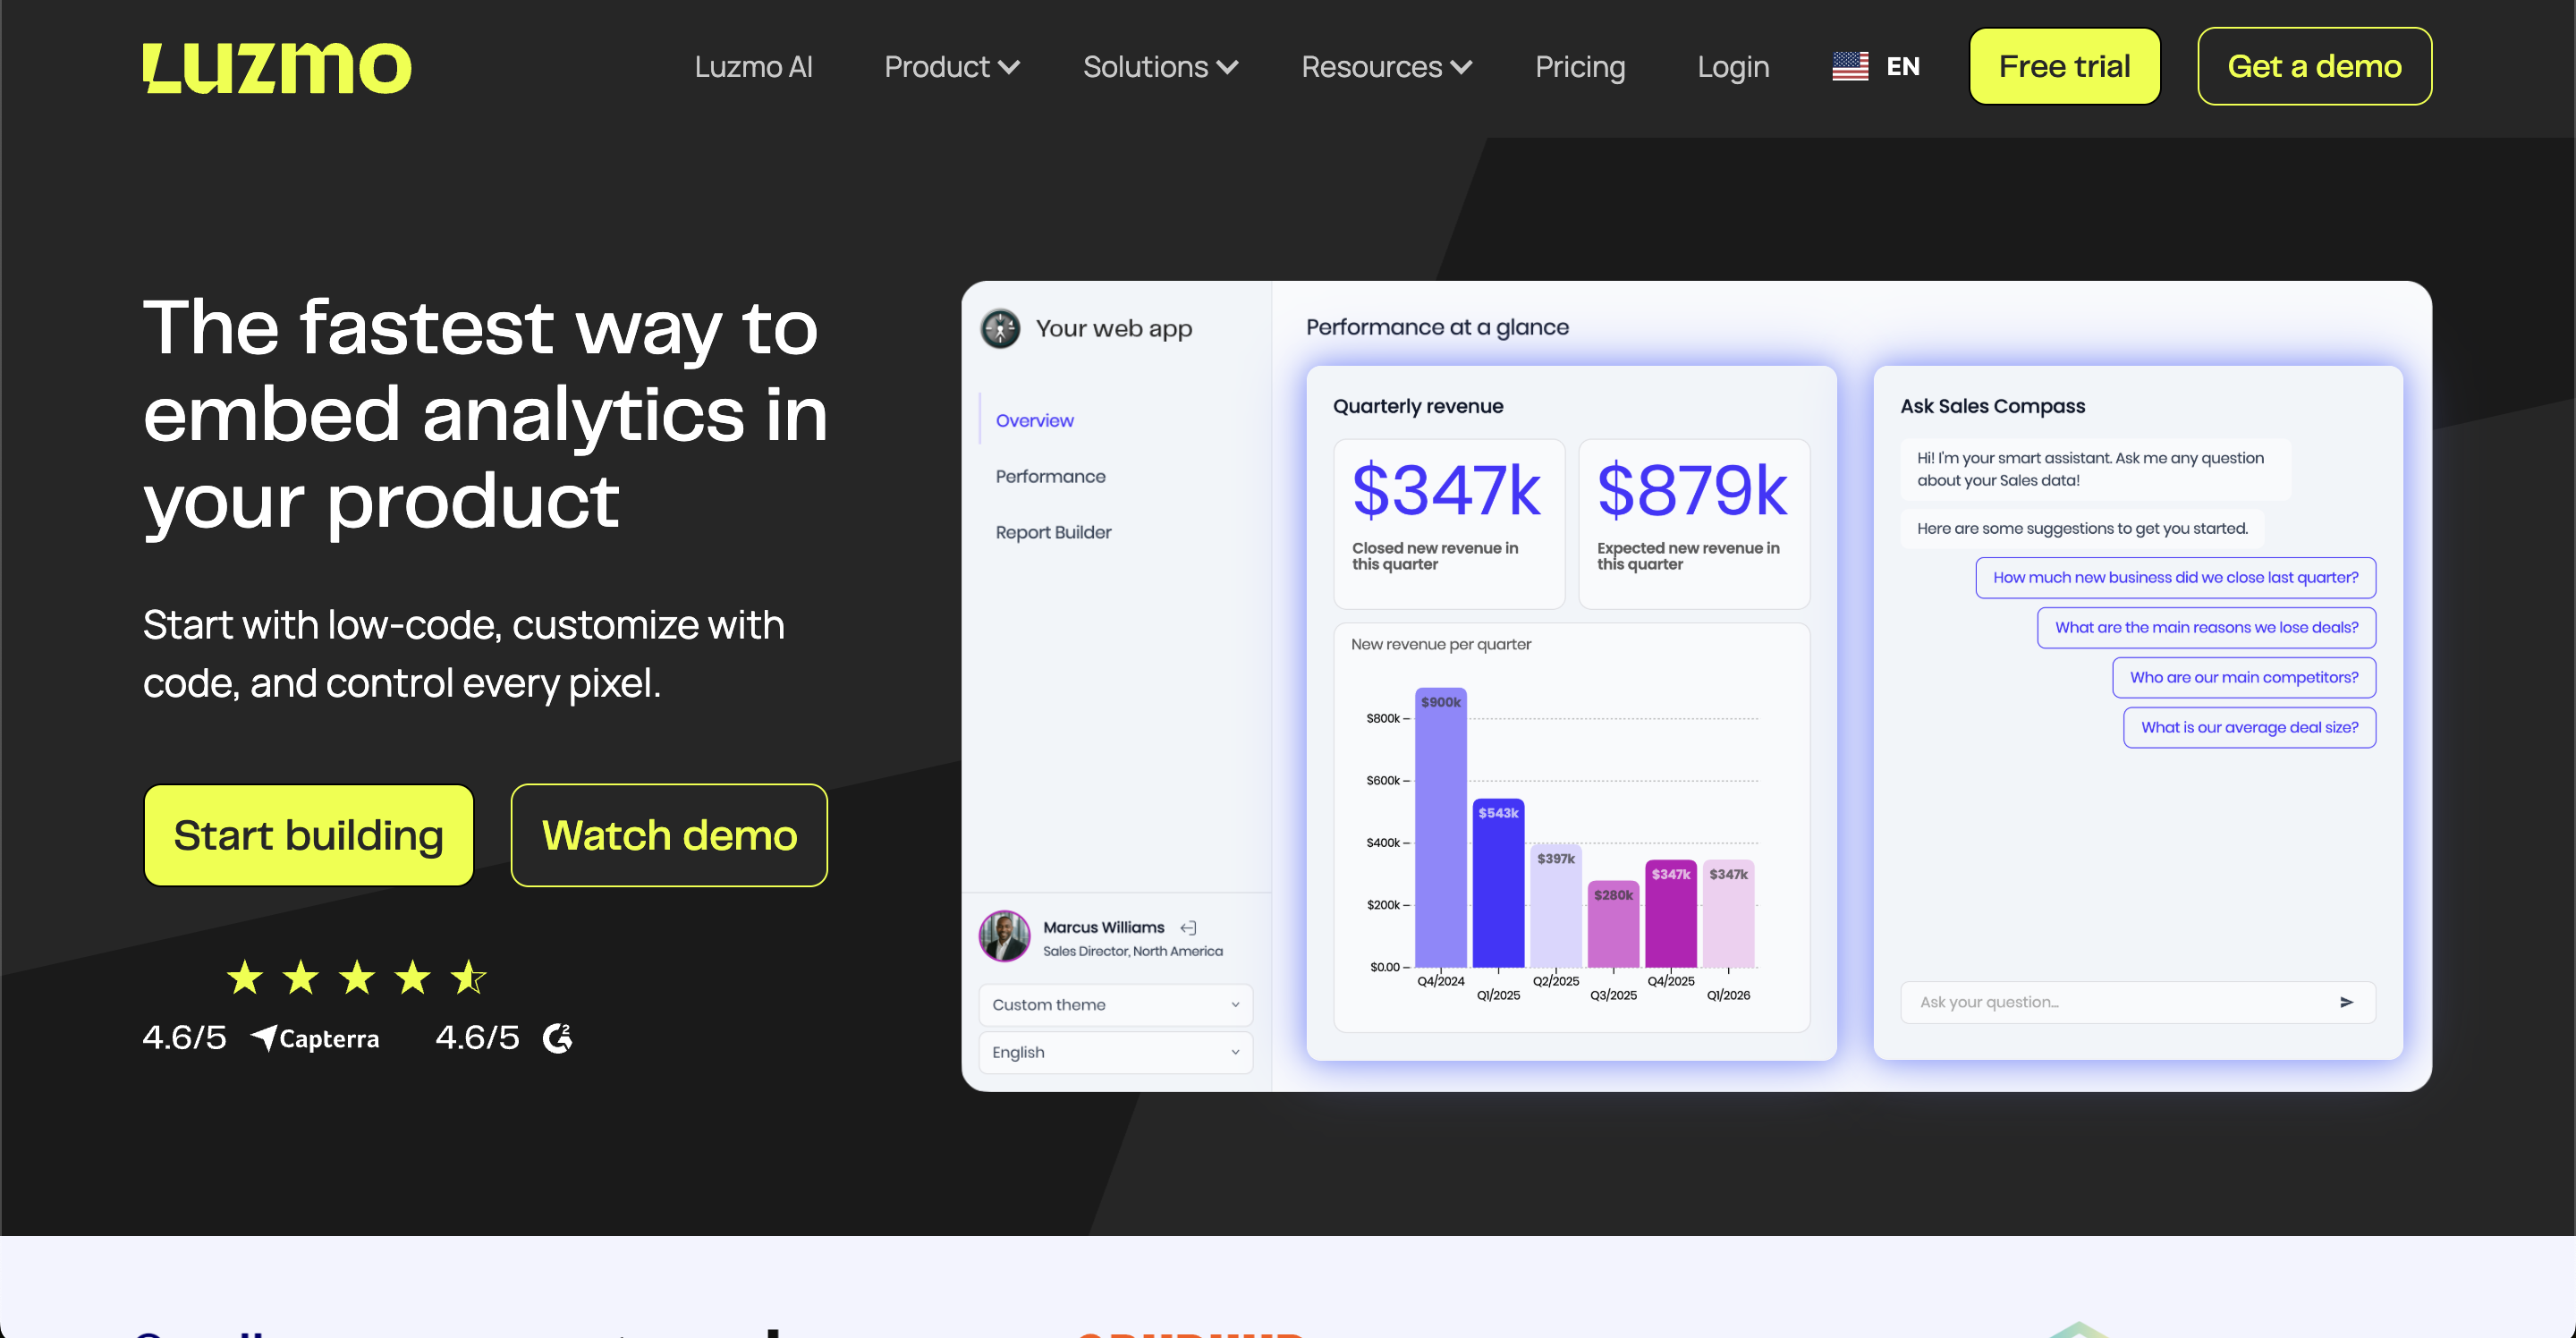
Luzmo pairs a JavaScript SDK and web components with a drag-and-drop dashboard builder, so product managers and designers can build and iterate on dashboards without pulling in engineering for every change. It's a strong fit where the visual quality of the embedded experience is itself a product differentiator.
Strengths. Over 20+ chart types out of the box. Full SDK support across React, Vue, and Angular rather than iframe-only embedding. Luzmo now ships a single plan with the whole product included from day one, so white-labeling, end-user self-service, and its governed AI are all on from the start rather than gated behind a higher tier.
Limitations. The floor is high and annual. The single plan starts at $1,995/month billed annually, so there is no low monthly entry point to validate a feature on before committing. On top of that flat platform fee, usage is metered on monthly active users and AI conversations, so a spike in customer engagement produces a corresponding spike in cost.
Dashboard capabilities. Live and cached data modes, drill-down and cross-filtering, multi-language, multi-timezone, and multi-currency support, and themed components that inherit your app's design system rather than looking bolted on.
White-labeling. Included from day one, with no Luzmo branding.
Multi-tenancy. Secure multitenant authentication with row-level security enforced via JWT and user attributes.
Security and access. Row-level security on every plan. Enterprise adds SSO via OIDC, a dedicated VPC, and custom SLAs with 24/7 escalation.
Pricing. Luzmo publishes one plan, Embedded Everywhere, starting from €1,995/month billed annually. The whole product is included rather than split into tiers, covering white-labeling, end-user self-service, governed AI with 500 AI conversations a month, and embedding across app, chat, and agents, with internal builders and 100 million rows of data capacity included instead of sold as seats. The bill is a flat platform fee plus usage metered on monthly active users, AI conversations, or both, and extra data capacity is an optional add-on. Enterprise changes only the deployment, such as private infrastructure, custom SLAs, or a deeper compliance path, not the product you get. A free trial is available.
Ease of implementation. SDK-based, native embedding is fast to wire up technically, though the MAU-based pricing means implementation planning has to include usage forecasting, not just engineering time.
Who should choose it. Teams where dashboard design quality is a real product differentiator and who can model MAU growth into their cost projections up front.
3. GoodData
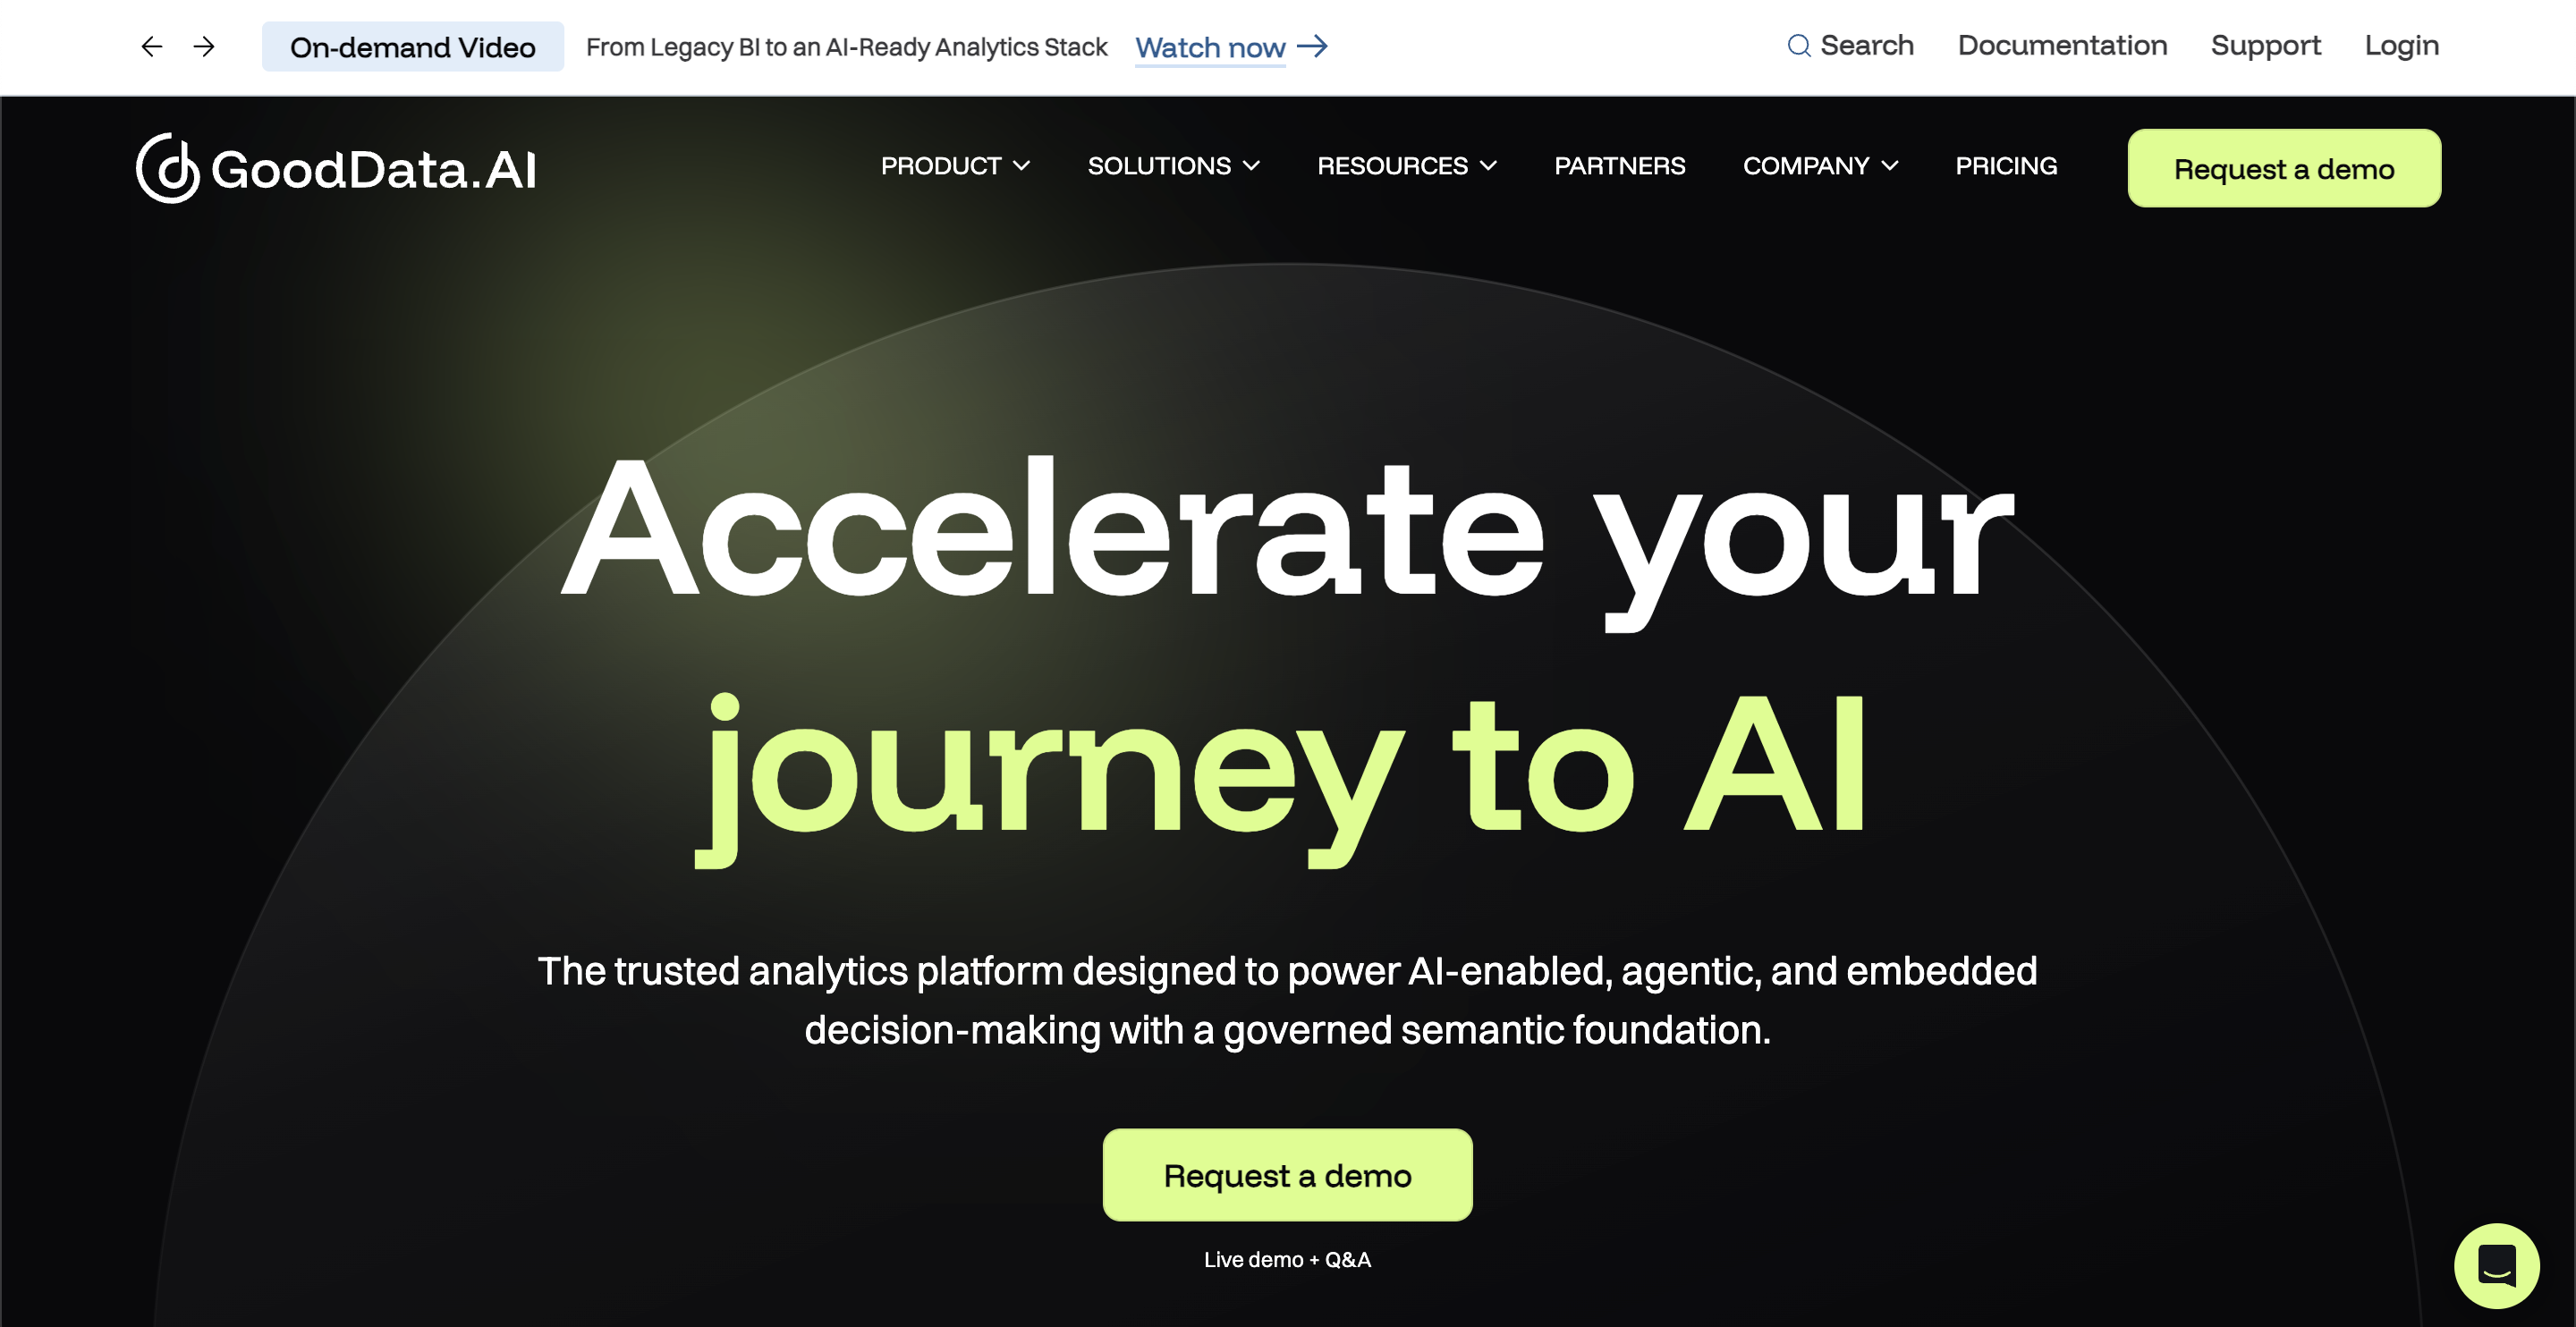
Best for enterprise SaaS teams that need one governed set of metric definitions reused consistently across many customer workspaces.
GoodData is built around a semantic layer and hierarchical multi-tenant workspaces, meaning tenant isolation and consistent metric definitions are structural to the product rather than something layered on top. It has also been adding AI-agent features, including Custom Agents, an Agent Builder, and a Dashboard Copilot, though those are Enterprise-only.
Strengths. Native hierarchical workspace architecture handles multi-tenancy structurally rather than through row-level filters bolted onto a shared schema. White-labeling on Professional supports custom themes and branding per individual customer. Users and data volume are unlimited on Professional rather than metered.
Limitations. Professional includes only a single environment, so teams wanting separate dev, staging, and production environments with CI/CD need Enterprise. Advanced AI and machine learning features, anomaly detection, forecasting, key driver analysis, are Enterprise-only. No public pricing or free trial exists. Every engagement starts with a sales conversation.
Dashboard capabilities. Unlimited self-service reports and dashboards built on top of the semantic layer, so metric definitions stay consistent across every customer workspace.
White-labeling. Included on Professional. Custom themes and branding configurable per customer.
Multi-tenancy. Native, hierarchical workspace architecture, this is the core structural feature of the product rather than an add-on.
Security and access. SOC 2, GDPR, and ISO 27001 on Professional. Enterprise adds SAML, multiple OIDC providers, audit logs, WCAG AA accessibility, HIPAA and FedRAMP on demand, and dedicated or multi-region cluster deployment.
Pricing. Professional is priced per workspace, a platform fee plus workspace count, with unlimited users and data, quote-based. Enterprise is custom, use-case-based pricing. No dollar figures are published and no free trial is listed, both tiers require contacting sales.
Ease of implementation. The semantic layer requires real upfront modeling investment compared to SQL-native tools, the trade-off for the governance and consistency it buys you across many workspaces.
Who should choose it. Teams serving many distinct customer workspaces who need one consistent, governed definition of every metric across all of them, and who have the modeling capacity to invest in that layer upfront.
4. Sisense
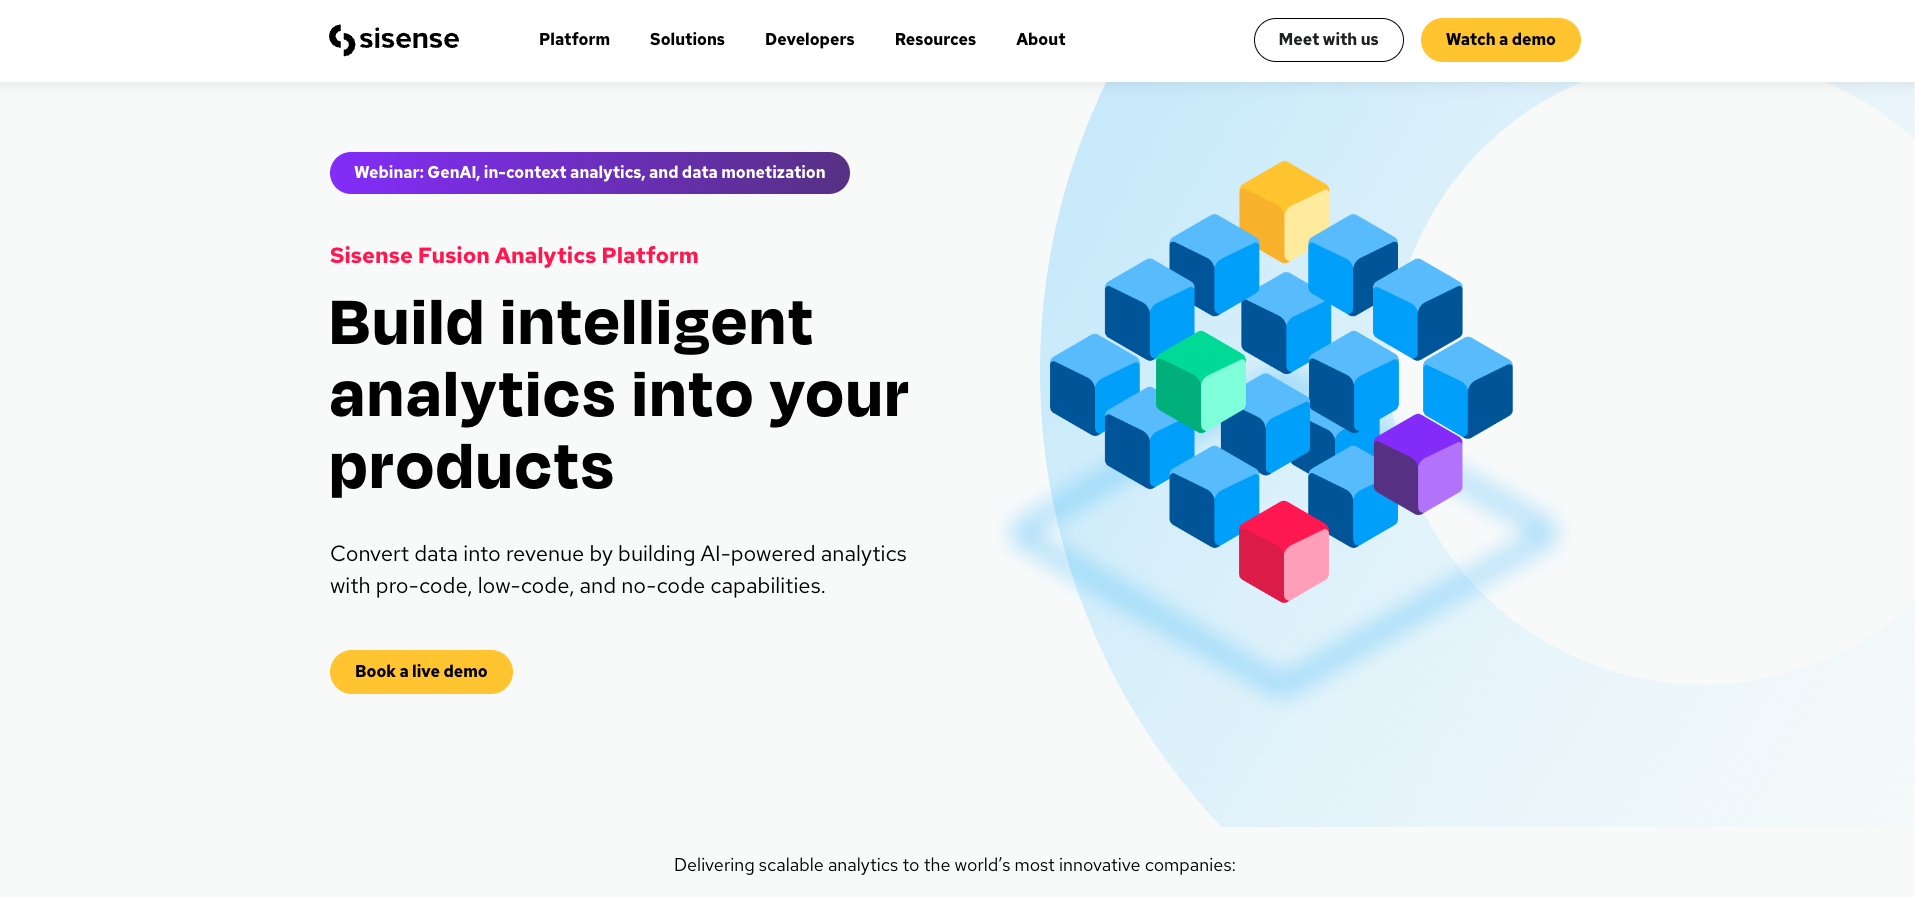
Best for product teams that want full React-level control over how embedded analytics look and behave, and are prepared to move to Enterprise once white-labeling or multi-tenancy is required.
Sisense's Compose SDK enables fully custom embedded experiences built from React components rather than a fixed iframe or widget, which makes it a strong option for teams that want analytics to feel like a native part of their product's own codebase rather than an inserted third-party block.
Strengths. Connects to any warehouse, database, or cloud app. A public self-serve entry tier with a free trial lowers the barrier to actually trying the product before a sales call. The built-in AI suite, Sisense Intelligence, covers natural-language queries, auto-narratives, and an AI assistant.
Limitations. Full white-labeling and multi-tenant architecture with data isolation across environments are Enterprise-tier features, they are not available on the self-serve entry plan. Sisense also does not list dollar figures on its pricing page at all, so the self-serve entry cost has to be confirmed through a product signup rather than read off the site.
Dashboard capabilities. Component-level embedding through the Compose SDK, or simpler iframe embedding for teams that don't need that depth of customization, plus natural-language query and auto-narrative generation.
White-labeling. Enterprise plan only.
Multi-tenancy. Multi-tenant architecture with data isolation across environments is an Enterprise-tier feature.
Security and access. HIPAA-ready compliance, column-level security, and SSO on Enterprise, with a 99.99% Premium SLA, auto-scaling, and a dedicated customer success manager.
Pricing. Sisense does not publish any pricing on its own site. The self-serve tier is available through a free trial, and Enterprise is custom-quoted.
Ease of implementation. Fast to start via the free trial for basic embedding, but any deployment that needs white-labeling or genuine multi-tenant isolation requires moving to Enterprise, which is a sales-scoped process.
Who should choose it. Teams that specifically want code-level control over the embedded UI through the Compose SDK, and who are budgeting for an Enterprise plan once white-labeling or multi-tenancy becomes a requirement rather than a nice-to-have.
5. Domo Everywhere
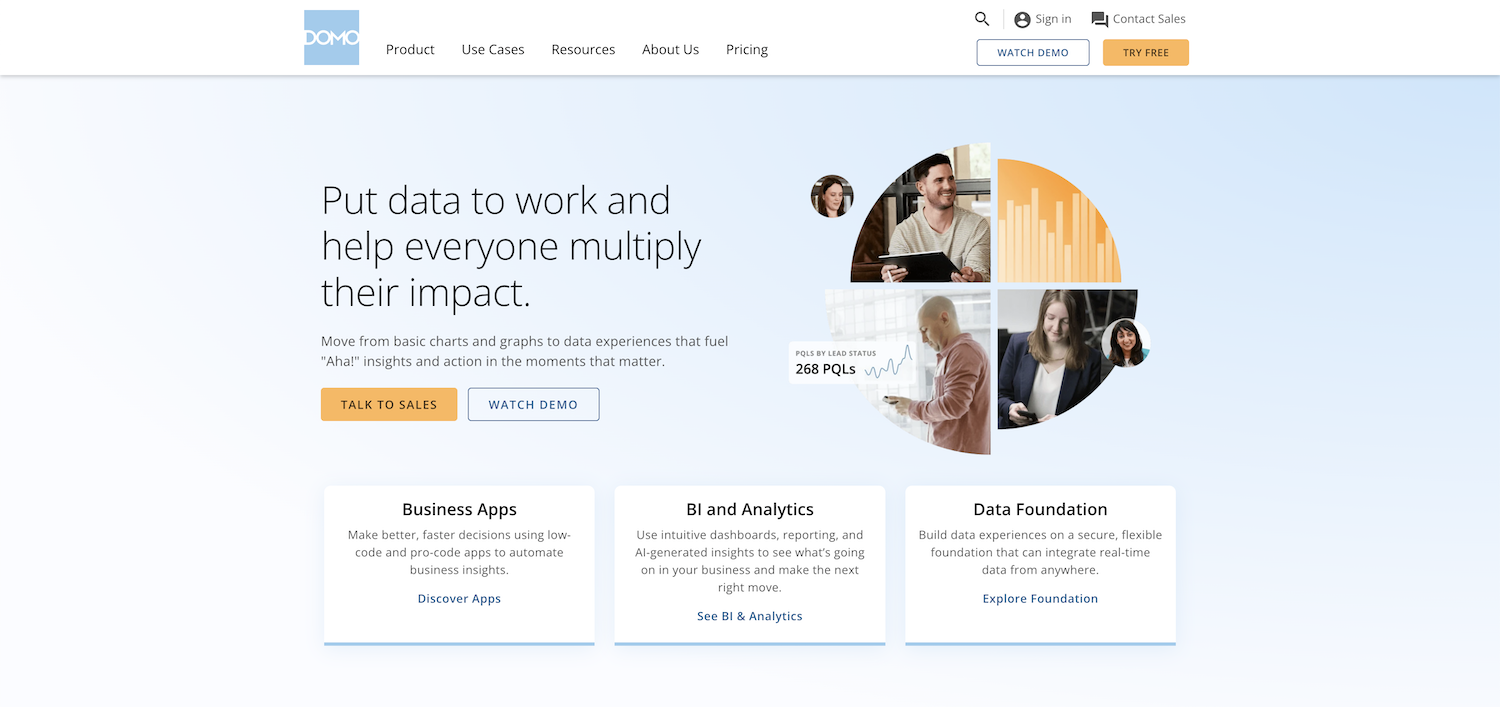
Best for large enterprises already standardized on Domo internally who want to extend existing dashboards to external customers, not for lean SaaS teams starting from scratch.
Domo Everywhere is Domo's embedding product line, built on top of Domo's broader BI platform and its library of many native connectors. It's a reasonable extension for a company that already runs its internal analytics on Domo, less so as a first embedded analytics purchase.
Strengths. Access to Domo's full connector library and AI-powered insights. Flexible deployment options for teams already inside the Domo ecosystem.
Limitations. Domo does not handle multi-tenancy automatically. Serving multiple customers with properly isolated data requires building row-level security and content hierarchy logic for each tenant yourself, this is not a native, out-of-the-box capability. Pricing is not published. Domo uses a credit-based consumption model tied to data rows, refresh rate, and users, which makes forecasting per-tenant cost difficult in advance. A starting point around $30,000 per year is commonly cited, before the specific costs of an ISV or embedded deployment.
Dashboard capabilities. The full Domo BI suite, multiple connectors and AI-powered insight generation, applied to embedded contexts.
White-labeling. Available, but configured as part of a custom Domo Everywhere deployment rather than a self-serve toggle.
Multi-tenancy. Not native. Tenant isolation has to be engineered by your own team using Domo's row-level security and content hierarchy primitives.
Security and access. Enterprise-grade platform security overall, but the tenant-isolation layer specifically is a build-it-yourself exercise on top of those primitives.
Pricing. Not published. Credit-based consumption tied to data rows, refresh frequency, and user count, with a commonly cited starting point of roughly $30,000 per year that scales unpredictably for embedded, customer-facing use cases. A custom quote is required.
Ease of implementation. Higher implementation lift than purpose-built embedded platforms, since multi-tenancy isn't native. Best suited to teams with dedicated data engineering resources who can build that layer.
Who should choose it. Enterprises already running Domo internally, with engineering capacity to build tenant isolation themselves, who want one platform serving both internal and external analytics rather than adding a second tool.
6. ThoughtSpot Embedded
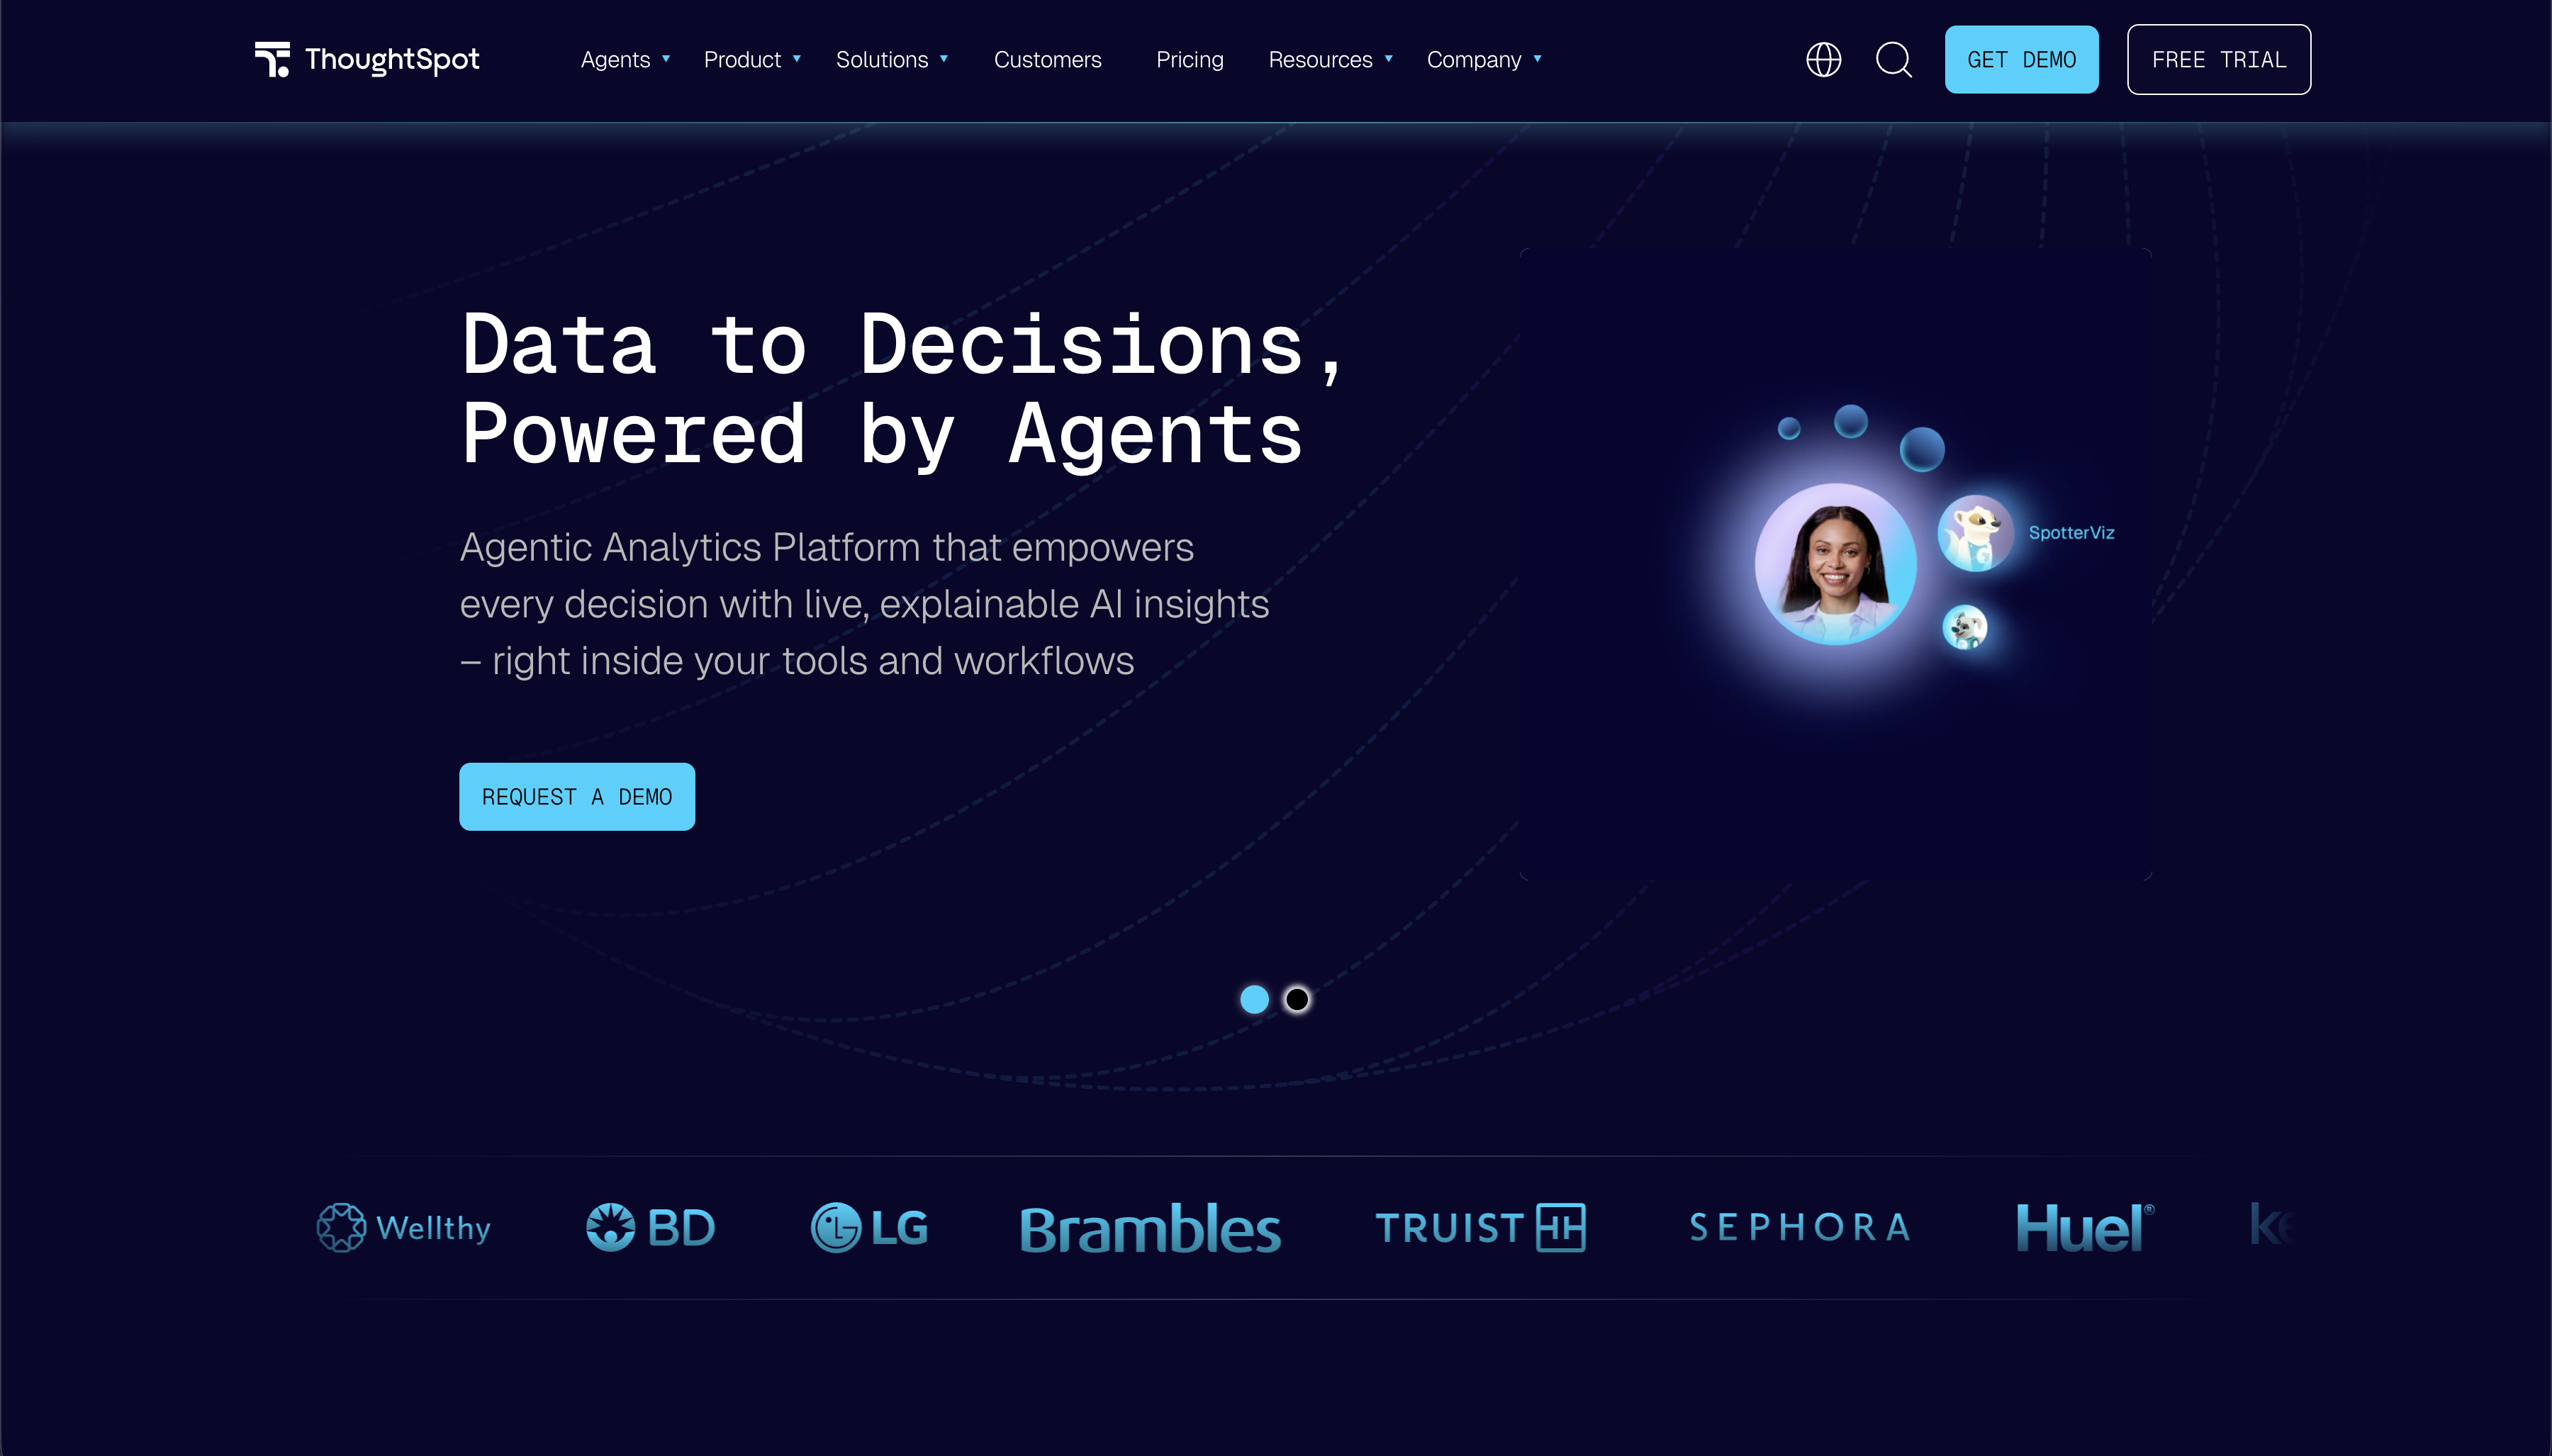
Best for products where letting end users ask their own questions of the data, in natural language, is a real differentiator, not just a nice-to-have on top of fixed dashboards.
ThoughtSpot, now positioned as an Agentic Analytics Platform, is built around Spotter, its AI agent for natural-language search, rather than pre-built dashboards as the primary interface. Its Embedded product line is separate from its general analytics pricing and includes a genuinely free tier for evaluation.
Strengths. The Developer tier is free for a full year, up to 10 users and 25 million rows, which is a real hands-on trial rather than a time-boxed demo. LLM tokens are not metered or charged for separately. Row-level security and SSO via SAML, OAuth, or OIDC are included on all tiers, and prebuilt connectors exist for Snowflake, Databricks, and Redshift.
Limitations. Multi-tenant deployment by organization is only available on the Embedded Enterprise tier, which is custom-priced and requires a sales conversation. The free Developer tier's 10-user, 25-million-row cap is suitable for a proof of concept but not production scale. Realizing a genuinely useful natural-language search experience requires meaningful data modeling and schema preparation upfront, this is not a plug-and-play SQL connection.
Dashboard capabilities. Embeddable Liveboards that respond to filters in real time, an Analyst Studio add-on for deeper SQL, Python, or R analysis, and SpotterCode for AI-assisted embed code generation.
White-labeling. Included on both the Developer and Enterprise embedded tiers.
Multi-tenancy. Enterprise tier only, scoped by organization.
Security and access. Row-level security, SSO across SAML, OAuth, and OIDC, advanced encryption, and VPC/VPN support on Enterprise.
Pricing. The Embedded Developer tier is free for one year, up to 10 users and 25 million rows. Embedded Enterprise is flexible, custom pricing aligned to use case, sales-gated.
Ease of implementation. The free tier lowers the barrier to a real proof of concept, but production multi-tenant embedding requires an Enterprise sales conversation and real upfront data modeling.
Who should choose it. Teams whose product's core value is letting end users freely ask questions of their own data rather than consume a fixed set of charts.
7. Metabase
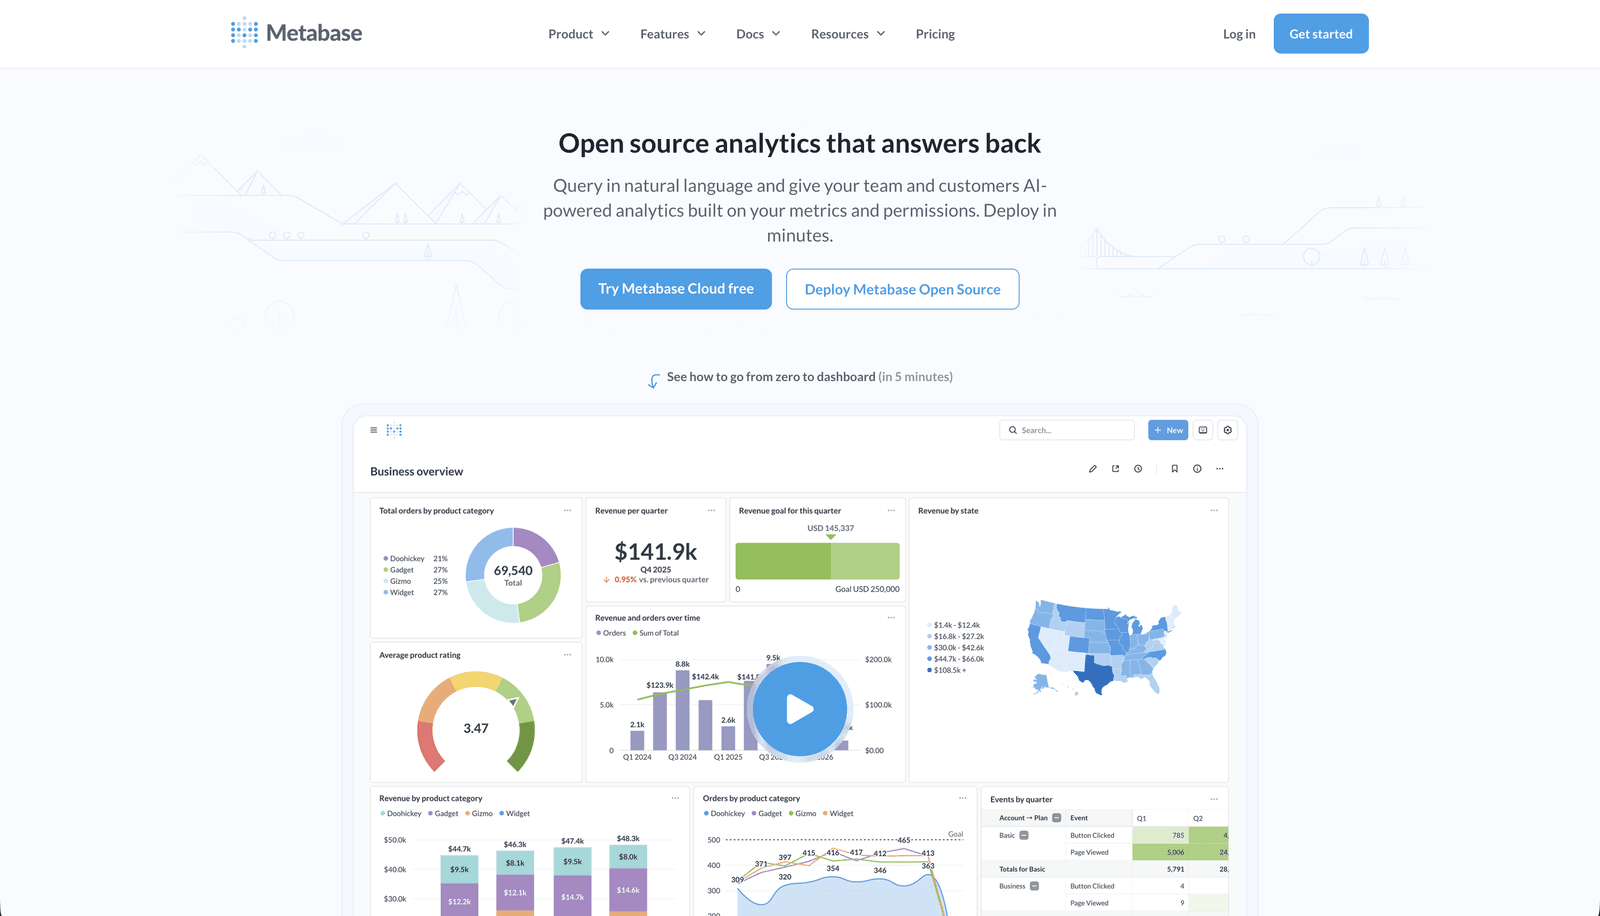
Best for teams already running Metabase internally who want to extend a limited, view-only slice of it to customers, especially where the interactive viewer count stays small.
Metabase is one of the most widely used BI tools, free and open-source to self-host, known for its accessible query builder. For customer-facing use specifically, it offers two distinct embedding modes with very different cost and interactivity trade-offs.
Strengths. The open-source tier is genuinely free to self-host with unlimited users. Guest, or static, embedding requires no customer login and carries no per-viewer cost on any plan, including the free tier. The Pro plan adds row and column-level permissions, referred to as data sandboxing, for multi-tenant segregation, along with SSO and usage analytics.
Limitations. This is the important one, guest embedding is view-only. Customers can see the dashboard exactly as pre-configured, but cannot filter, drill down, or otherwise interact with it. Interactive embedding, the mode that unlocks filters and drill-through, requires every customer to sign in via SSO or a Metabase account, and every signed-in viewer counts toward your plan's billed user total. At scale, that structure gets expensive fast. A customer base of even a few hundred interactive viewers can add thousands of dollars a month in per-user charges on top of the base plan.
Dashboard capabilities. A visual query builder, a full SQL editor, an extensive chart library, and scheduled reports and alerts.
White-labeling. Pro plan and above.
Multi-tenancy. Row and column-level permissions, Metabase's data sandboxing feature, available on Pro and above.
Security and access. SSO and SCIM, usage analytics, and caching controls on Pro, air-gapped deployment available on Enterprise.
Pricing. For embedded analytics, Pro is the entry plan at $575/month billed monthly, or about $517.50/month billed yearly, and it covers unlimited embedded charts and dashboards, full white-label branding, and multi-tenant row and column-level security. The first 10 users are included, and every user after that is $12 per month. The catch for customer-facing use is that both your internal builders and every end customer who signs in to an embed count as billed users, so an interactive embed with hundreds of signed-in viewers scales the bill quickly. Enterprise is custom, starting around $20,000/year, and adds tailored embedding packages for products scaling to a large number of end customers where per-seat pricing no longer fits. A 14-day free trial is available.
Ease of implementation. Fast if you only need view-only, static customer dashboards. Meaningfully more setup, and more cost planning, if customers need to filter or drill into their own data, since that requires SSO configuration and a growth-aware budget for per-user fees.
Who should choose it. Teams already running Metabase for internal reporting who want to extend a static, view-only slice of it to customers without adopting a second platform, or who have a small and predictable interactive-viewer count.
8. Qrvey
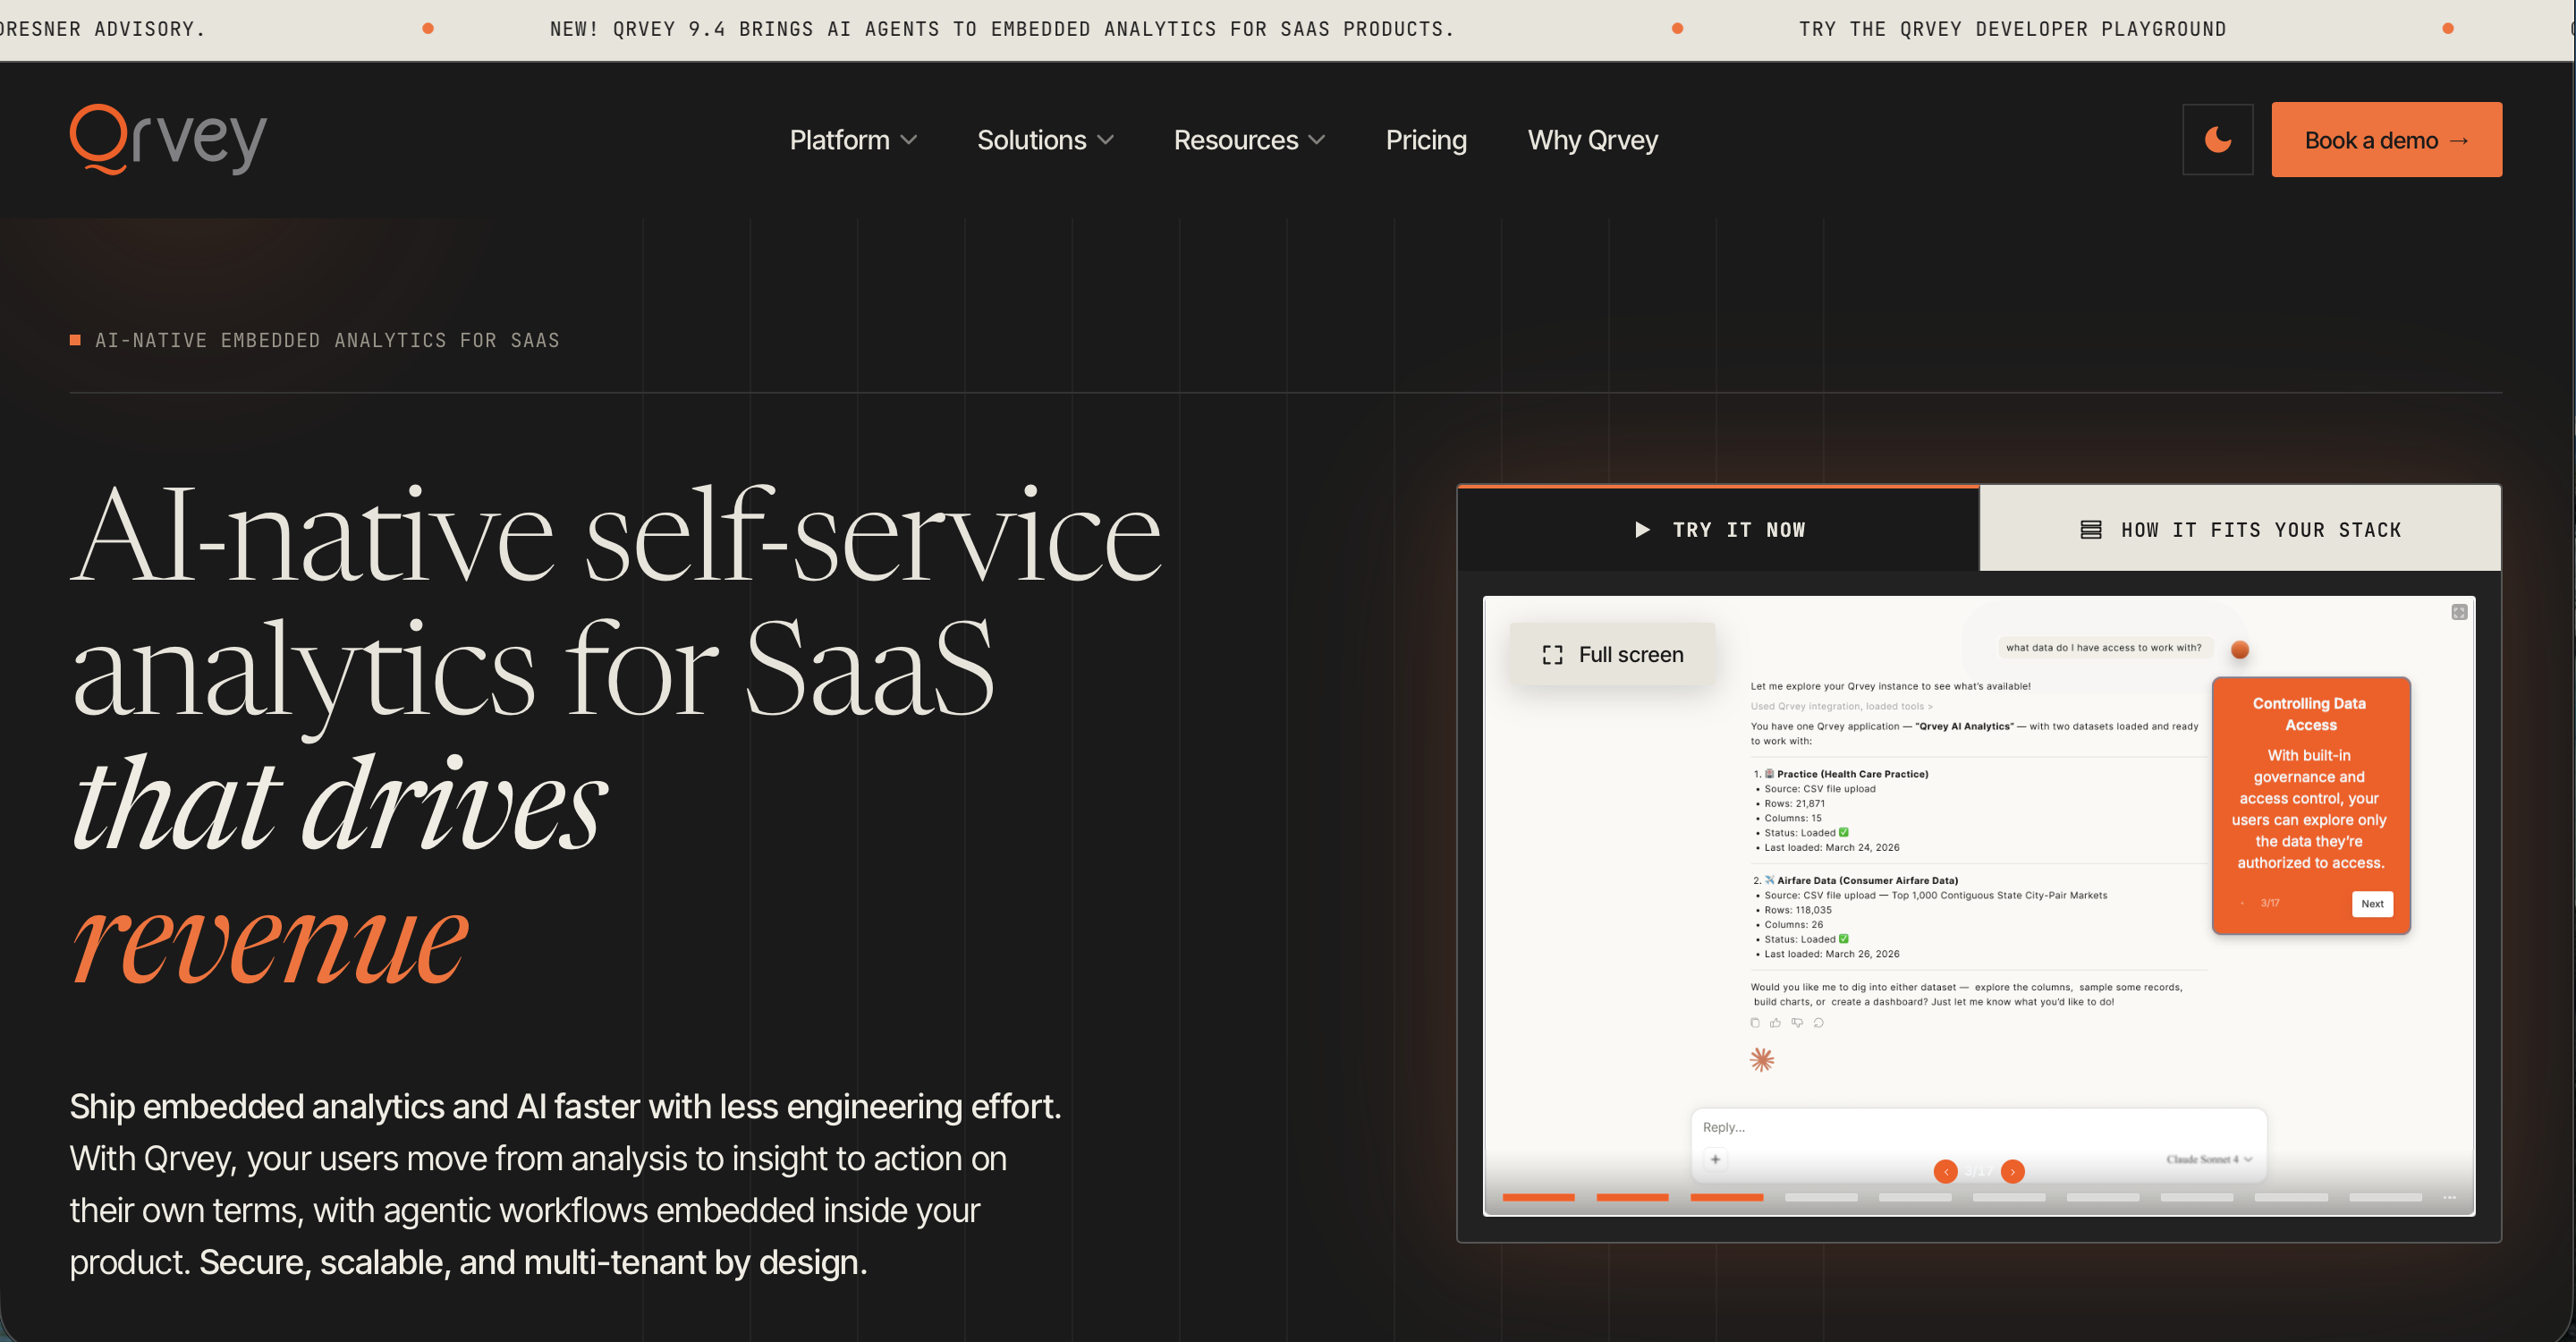
Best for SaaS platforms operating at real multi-tenant scale, hundreds or thousands of customers, who want the isolation model solved natively rather than engineered themselves.
Qrvey is an AI-native embedded analytics platform built specifically for SaaS, offered in two editions. Pro suits teams that already have an analytics-ready database, and Ultra adds Qrvey's own data engine and transformation layer for teams that don't.
Strengths. Security is enforced natively at the row, column, and schema level, inheriting your SaaS app's own security framework rather than being bolted on through database views after the fact. Embedding is fully native with zero vendor chrome, no iframe involved. A single deployment is built to scale from your first tenant to your ten-thousandth without architectural changes. A perpetual license option exists as an alternative to ongoing subscription.
Limitations. No pricing is published, every quote is custom. The Pro edition assumes your database is already analytics-ready, teams without that in place need to step up to Ultra, which adds cost and complexity for its built-in data engine.
Dashboard capabilities. A drag-and-drop dashboard builder, interactive reports with drill-down and filtering, a full visualization library, custom formulas, responsive layouts, and AI-generated dashboards from natural language.
White-labeling. Full white-labeling via design tokens and typography, included.
Multi-tenancy. Native multi-tenant security enforced at every level of the stack, explicitly built to scale from one tenant to over ten thousand on a single deployment.
Security and access. Row-, column-, and schema-level security that inherits your SaaS app's own security framework, plus deployment in your own cloud such as AWS or Azure.
Pricing. Qrvey does not publish any dollar figures. Pricing is quote-based, and you request it through the site to get a quote within about 24 hours. Both the Pro and Ultra editions use flat-rate licensing with unlimited users, dashboards, instances, data, and connections, so the bill does not scale with tenant or user count. A perpetual license is also available on both editions as a one-time alternative to an ongoing subscription.
Ease of implementation. Faster for teams whose database is already modeled for analytics, teams starting from raw operational data will need the Ultra edition's data engine, which extends the implementation timeline.
Who should choose it. SaaS companies serving a large and growing number of tenants who want native, provably scalable isolation without building and maintaining that layer themselves, and who are comfortable with a sales-led buying process.
9. Power BI Embedded
Best for organizations that already have Power BI content and Azure infrastructure and want to reuse that investment for customer-facing embedding rather than adopt a new platform.
Power BI Embedded is Microsoft's Azure capacity offering for embedding Power BI reports and dashboards into external applications. It's built around what Microsoft calls the app-owns-data model, where your app authenticates using a service principal or master user rather than requiring each external customer to hold their own Power BI license.
Strengths. Because pricing is capacity-based rather than per-user, external customers don't need individual Power BI licenses, a real advantage over per-seat BI tools once your customer count grows. Deep integration with Microsoft Entra ID and Microsoft Fabric. Row-level security supports tenant-based data isolation within a single embedded model. A large marketplace of custom visuals is available.
Limitations. You're billed for the capacity node itself, hourly, to the second, regardless of whether customers are actively viewing dashboards at any given moment, so cost tracks provisioned compute rather than actual usage. R and Python visuals are not supported in the app-owns-data embedding scenario. The platform is tightly coupled to Microsoft's ecosystem, which adds real infrastructure overhead for teams not already running on Azure, and the white-labeling and UI flexibility are more limited than purpose-built embedded platforms like Draxlr or Luzmo. Microsoft's own Azure pricing page does not list dollar figures directly, routing instead to a pricing calculator or sales, though third-party trackers consistently report the entry A1 SKU at roughly $735 per month running always-on.
Dashboard capabilities. Reports, dashboards, tiles, and Q&A experiences, using the full Power BI visual set, with the R and Python visual caveat noted above for app-owns-data embedding specifically.
White-labeling. Supported, configured through the embedding API.
Multi-tenancy. Row-level security supports tenant-based data isolation within a single embedded report or model.
Security and access. Token-based authentication via service principal or master user for app-owns-data scenarios, integration with Microsoft Entra ID, and row-level security.
Pricing. Capacity is billed hourly by A-SKU. The entry A1 SKU, 1 virtual core and 3GB RAM, is reported at roughly $735 per month running continuously by third-party pricing trackers, with higher A-SKUs (A2 through A8) scaling compute and memory, and cost, accordingly. Free embed trial tokens exist for development and testing only, a purchased capacity is required before going to production.
Ease of implementation. Requires Azure capacity planning and provisioning before launch, more infrastructure setup than a SaaS-native embedded tool, but straightforward for a team already fluent in Azure.
Who should choose it. Organizations with existing Power BI reports and Azure infrastructure who want to reuse that investment for external, customer-facing embedding rather than stand up a second analytics platform.
Multi-Tenant Data Isolation, the Decision That Matters Most
Every tool on this list will happily show you a chart in a demo. The question that actually matters is what happens when customer A and customer B are both looking at their dashboards at the same time, and whether it is structurally impossible for A to ever see a row of B's data, or whether that guarantee depends on someone configuring a filter correctly and never making a mistake.
Three isolation models show up across this list, and they are not interchangeable.
Row-level security at the database. The database itself enforces which rows a given query can return, based on the identity of the tenant making the request. This is the strongest guarantee, because the isolation lives below the application layer, but it requires a data model that supports it. Draxlr, Luzmo, and Power BI Embedded all rely on some form of row-level security at this layer.
Token-scoped queries at the app layer. A signed embed token carries the tenant's identity, and the application layer filters what that token can retrieve. This is faster to stand up than database-level RLS but depends on every query path correctly respecting the token, which is a discipline problem as much as a technical one. See secure token-based dashboard embedding for how that mechanism actually works end to end.
Separate schema or hierarchical workspace per tenant. Instead of filtering rows within a shared table, each tenant gets a structurally separate space. GoodData's hierarchical workspaces and Qrvey's native multi-tenant architecture both work this way. It's the most airtight model and the easiest to reason about for compliance, but it's also the most architecturally opinionated, adopting it usually means adopting the vendor's full data model.
The practical takeaway is simple. If multi-tenancy is a plan-gated add-on rather than a structural property of the product, as it is with Sisense, ThoughtSpot, and Domo Everywhere, budget for that gap to show up as an Enterprise conversation later, not a checkbox today. For a deeper look at how these isolation models compare directly, see multi-tenant database isolation models.
What Customer-Facing Analytics Costs at Scale
Sticker price is close to useless for this category, because almost none of these tools charge a flat number regardless of how many customers actually use the dashboards. The real question is what happens to the bill between 10 customers and 5,000.
Flat-rate tools, Draxlr, and GoodData's per-workspace model, are the most predictable, because your cost is a function of your plan tier, not your customer count. MAU-based tools, Luzmo chief among them, scale your bill with actual usage, which is fair in principle but means a successful product launch produces a cost spike alongside the growth. Per-user tools, Metabase's interactive embedding and ThoughtSpot's per-user pricing outside the free embedded tier, are the ones to model carefully before committing, since a few hundred customers using interactive dashboards can turn a $500/month plan into a five-figure annual line item once viewer fees are added.
A rough model at 5,000 end users shows the difference. A flat-rate plan stays at its listed tier price. A MAU-based plan moves up a pricing band as active usage crosses defined thresholds. A per-user interactive-embed plan adds a line-item cost of roughly $10 to $13 per active viewer per month on top of the base plan, which at 5,000 users is $50,000 to $65,000 a month before any other cost is added. Run this math against your own projected customer count before signing, not after. For a full worked breakdown, see the embedded analytics cost and budget guide.
Do You Need a Data Warehouse for This?
Several tools in this category, and a good portion of the infrastructure vendors adjacent to it, assume you'll stand up a dedicated analytical database or warehouse before you can embed anything meaningful. For most SaaS teams shipping customer-facing dashboards, that assumption is wrong, or at least premature.
If your product already runs on PostgreSQL, MySQL, or a managed variant like Supabase or PlanetScale, that database can serve embedded dashboards directly, provided the tool you're using can query it live and enforce tenant isolation at the query level, which is exactly what Draxlr is built to do. A dedicated warehouse earns its cost when your dashboards need to aggregate across genuinely large historical volumes or join data from many disparate sources, not simply to show a customer their own usage and billing data. See adding analytics to a SaaS product without a separate data platform for the specific case for skipping that step.
Latency Expectations for Dashboards Your Customers See
Internal BI has a different latency budget than customer-facing analytics. If a teammate's internal dashboard is 20 minutes stale, that's an inconvenience. If a customer's usage dashboard, the one they're checking to decide whether your product is worth renewing, is 20 minutes behind what actually happened in their account, that reads as broken.
Real-time refresh is not always necessary, but near-real-time, typically under a few minutes, usually is for anything customer-facing. Confirm each tool's actual refresh behavior rather than assuming "live data" means what you think it means, some platforms cache aggressively by default and treat sub-minute refresh as a premium-tier feature. See real-time versus near-real-time dashboards for how to set that expectation correctly before your customers do it for you.
Build vs. Buy
Building customer-facing analytics in-house is not hard in principle, since charting libraries are commodity. The engineering time goes into the parts every vendor in this article sells: tenant isolation that survives a security review, a query layer that holds up under concurrent load from hundreds of customers, and ongoing maintenance as your data model changes. Weighed against a $75 to $400 a month purpose-built tool, the build path rarely wins unless the analytics experience is core to your product's differentiation. For the full numbers, see our build-vs-buy cost breakdown.
How to Choose Based on Where You Are
Under 10 customers, validating the feature. Prioritize speed and a low floor. Draxlr's flat $75/month Premium plan or Sisense's free self-serve trial let you get a real embedded dashboard in front of customers within days, without a sales process standing between you and a working prototype.
Scaling past a few hundred customers. This is where pricing model matters more than sticker price. Confirm whether your chosen tool's cost is flat, MAU-based, or per-viewer, and model the bill at your projected customer count, not your current one, before you're locked into a contract you can't easily change.
Enterprise procurement, compliance requirements, many distinct customer workspaces. GoodData's governed workspace model or Qrvey's native scale-to-thousands architecture are built for this specifically. Expect a sales-led process and a custom quote rather than a self-serve signup, and budget the extra implementation time that comes with a semantic layer or data engine.
Frequently Asked Questions
1. What is customer-facing analytics?
Customer-facing analytics is dashboards and reporting built into a software product specifically for the product's own customers to view, rather than for the internal team. Each customer sees only their own data.
2. How is customer-facing analytics different from embedded analytics?
Customer-facing analytics is a specific case of embedded analytics, embedded analytics is the general practice of placing dashboards inside an application rather than a separate BI tool, customer-facing analytics narrows that to dashboards served to external customers rather than internal teammates, which is what makes multi-tenant isolation a hard requirement rather than a nice-to-have.
3. What is the best pricing model for customer-facing analytics at scale?
Flat-rate or capacity-based pricing, like Draxlr's or Power BI Embedded's, is the most predictable as your customer count grows, since the bill doesn't move with usage. MAU-based pricing, like Luzmo's, scales with actual engagement, which is fair but harder to forecast. Per-viewer pricing, like Metabase's interactive embedding, is the model most likely to produce an unpleasant surprise at scale and should be modeled carefully against your real customer count before signing.
4. Do I need a data warehouse to use customer-facing analytics?
Not necessarily. If your product already runs on a standard operational database like PostgreSQL or MySQL, tools that query it directly, such as Draxlr, can serve embedded dashboards without standing up separate warehouse infrastructure. A warehouse becomes worthwhile when you need to aggregate large historical volumes or join many disparate data sources, not simply to show a customer their own account data.
5. How do I prevent customers from seeing each other's data?
Through one of three isolation models. Row-level security can be enforced at the database, queries can be token-scoped at the application layer, or each tenant can be given a structurally separate schema or workspace. Confirm which model a given tool uses natively versus which requires you to build it yourself, Domo Everywhere, for example, requires the tenant-isolation logic to be built by your own team rather than providing it out of the box.
6. Can customer-facing analytics generate revenue directly?
Yes, indirectly and sometimes directly. Customer-facing dashboards are consistently cited as a retention driver, since they increase the perceived value and stickiness of a product, and some SaaS companies package advanced analytics as a paid upsell tier on top of a base product.
7. How long does it take to implement customer-facing analytics?
It varies widely by tool. SQL-native platforms like Draxlr typically reach a first embedded dashboard in one to two days. SDK-based tools like Luzmo target under two weeks. Platforms requiring a semantic layer or data engine setup, GoodData, Qrvey's Ultra edition, or ThoughtSpot's natural-language search, typically require several weeks to a few months for a production-ready deployment.
8. Should I build customer-facing analytics in-house or buy a platform?
Buying is the right default for most teams. A realistic in-house build runs six to ten weeks of engineering time for a production-safe first version before ongoing maintenance, against $75 to $400 a month for a purpose-built platform. Building in-house starts to make sense only when the analytics experience is itself a core competitive differentiator for your product.
9. Is iframe embedding good enough for customer portals?
For simple, view-only dashboards, yes. Iframe embedding is fast to set up but tends to create visual inconsistencies with the host application and handles poorly on mobile. If your customers need the dashboard to feel like a native part of your product, especially on mobile, a script or SDK-based embed, like Draxlr's HTML, React, and Vue options or Luzmo's web components, is worth the extra setup time.
About the author

Vivek is a coder and the founder of Draxlr who cares deeply about building good products. He works at the intersection of AI, SQL, dashboards, and embedded analytics, with a strong focus on making complex data workflows feel simple, useful, and fast for real teams.
If you have questions about anything in this guide, or want to compare options for your specific stack, you can email Vivek at vivek@draxlr.com, try Draxlr free, or reach out directly through the Draxlr team.