Best GoodData Alternatives for Embedded Analytics in 2026
Not sure GoodData is the right fit for embedding analytics? This blog covers 7 GoodData alternatives with pros, cons, and pricing to help you shortlist faster.

GoodData is one of the more established platforms in the embedded analytics space. Its multi-tenant workspace architecture, semantic layer, and support for iframe, React SDK, and web component embedding make it a credible option for SaaS companies that want to deliver analytics to their customers. But for many product teams, GoodData creates more friction than it removes, particularly around pricing, deployment complexity, and the learning curve of its proprietary query language.
This guide covers seven GoodData alternatives worth evaluating if you are building embedded analytics into a software product and GoodData is not the right fit. Each tool is assessed on what it offers for embedding specifically, who it suits, and what it costs.
What Is GoodData and What Is It Used For?
GoodData is a cloud-based business intelligence and embedded analytics platform. It lets organizations connect to data sources, build dashboards and reports, and embed those dashboards into their own software products.
Its core architecture is built around a semantic layer that centralizes business metrics and data relationships. This means you define a metric once and it stays consistent across every dashboard that references it. GoodData also supports multi-tenancy, meaning a single deployment can serve many separate customer environments, each seeing only their own data.
The platform offers three main embedding methods: iframes for basic integration, a React SDK for deeper frontend customization, and web components for modern application architectures. It also supports analytics-as-code workflows, letting data teams manage analytics configuration through Git and CI/CD pipelines rather than only through a UI.
GoodData's target users are primarily product teams at SaaS companies and enterprise data teams that need governed, scalable analytics at the customer level.
Why Teams Look for GoodData Alternatives
GoodData suits certain use cases well, but consistent patterns emerge across user reviews on G2, Capterra, TrustRadius, and SelectHub that explain why teams start evaluating other options for embedding.
-
Pricing that requires a sales conversation. GoodData does not publish prices for either of its plans. The Professional plan is structured as a platform fee plus a per-workspace charge, with each workspace representing a separate customer environment. The Enterprise plan is fully custom. Because neither plan shows a number without contacting sales, it is difficult to estimate costs or compare them against other tools without going through a discovery call first. For teams that prefer to evaluate pricing independently before speaking to a vendor, this is a meaningful friction point.
-
A proprietary query language with a steep learning curve. GoodData uses MAQL (Multi-Dimensional Analytical Query Language) for metric definitions and data modeling. Product teams that want to move fast and already know SQL have to invest time in a new language before they can build anything. This slows down time to first embedded dashboard.
-
Limited visual customization. While GoodData offers multiple embedding methods, deep visual customization, going beyond color palette changes and basic layout adjustments, requires significant developer time. The chart library is narrower than competitors, and users report that it can feel dated compared to more modern embedded analytics tools.
-
Support that depends on your plan tier. Dedicated customer success managers and priority support are only available on GoodData's Enterprise plan. Teams on lower tiers submit tickets and rely on community forums. For companies embedding analytics into customer-facing products where downtime has a direct business impact, this creates meaningful risk.
-
Limited customization of dashboard layout. Several reviewers note that modifying existing dashboard layouts as business requirements change is more time-consuming than expected. The platform can be rigid when you need to restructure how content is organized.
-
Implementation takes longer than expected. Beyond the query language, configuring workspace hierarchies, setting up row-level security for multi-tenancy, and working through GoodData's deployment process typically takes several weeks before the first dashboard is live in a product.
These are not edge-case complaints. They appear across enough independent reviews to represent genuine structural limitations of the platform rather than individual user errors. If any of these match your situation, the GoodData alternative tools below are worth investigating.
What to Look for in a GoodData Alternative
Before comparing GoodData alternatives, it helps to know which capabilities matter most for embedded analytics use cases. These are the criteria that separate tools that work for embedding from general-purpose BI platforms that technically support it as a feature.
-
Embedding method flexibility. Iframes are the most common embedding method and the easiest to implement, but they have real drawbacks like slower loading, limited responsiveness, and styling constraints. The best tools also offer React components, Vue components, or web components that integrate directly into your application's DOM. This makes dashboards feel native rather than bolted on.
-
Multi-tenancy and row-level security. If you are embedding analytics for multiple customers, you need to guarantee that each customer sees only their own data. Row-level security and multi-tenant architecture are not optional features. They are requirements. Confirm how each tool implements this before committing.
-
White labeling. Your customers should see your product's branding throughout. Confirm which plan tier includes white labeling and whether there are any limits on what can be customized, such as colors, fonts, logo, and domain.
-
Pricing model transparency. Per-customer or per-workspace pricing can escalate quickly as you scale. Look for flat-rate models or per-seat structures that are easy to forecast. Published pricing is a meaningful advantage over contact-sales-only models.
-
Time to first embedded dashboard. Developer hours are expensive. A tool that takes three months and a professional services engagement to go live has a much higher true cost than its monthly fee suggests. Look for realistic deployment timelines and self-service onboarding.
-
Self-service analytics for end users. The best embedded analytics tools let your customers explore their own data through filter controls, drill-downs, and natural language querying without filing requests to your team. This requires row-level security as a foundation, since customers can only safely self-serve on data that is properly isolated to their environment.
-
Data source compatibility. Confirm the tool connects to the databases and warehouses you already use. Most tools support the major options (PostgreSQL, MySQL, Snowflake, BigQuery, Redshift), but if your stack includes less common databases, verify before shortlisting.
-
Support quality. For customer-facing products, analytics downtime has a business cost. Understand what level of support is included in each pricing tier and what the expected resolution time is for critical issues.
GoodData Alternatives Comparison Table
| Tool | Starting Pricing | Best For | Free Trial |
|---|---|---|---|
| GoodData | Contact sales | Enterprise SaaS needing governed multi-tenant embedding | No |
| Draxlr | $75/month | SaaS teams wanting fast, affordable embedding with transparent pricing | Yes, 7 days |
| Looker | Contact sales | Google Cloud teams needing analytics-as-code with embedding | No |
| Power BI Embedded | From ~$500/month (capacity) | Teams already standardized on Microsoft 365 and Azure | Yes |
| Sisense | $399/month | Organizations with large datasets that need fast query performance | Yes |
| Luzmo | $495/month, Billed annually | Product teams that want a modern, developer-friendly analytics platform | Yes |
| Omni(Explo) | Contact sales | Teams wanting governed BI and embedded analytics in one platform | Yes |
| Metabase | $575/month + $12/user(interactive) | Teams that want dev-focused tool | Yes |
1. Draxlr
Best GoodData Alternative For: SaaS teams that want a fast, affordable embedded analytics with transparent pricing and no proprietary query language.
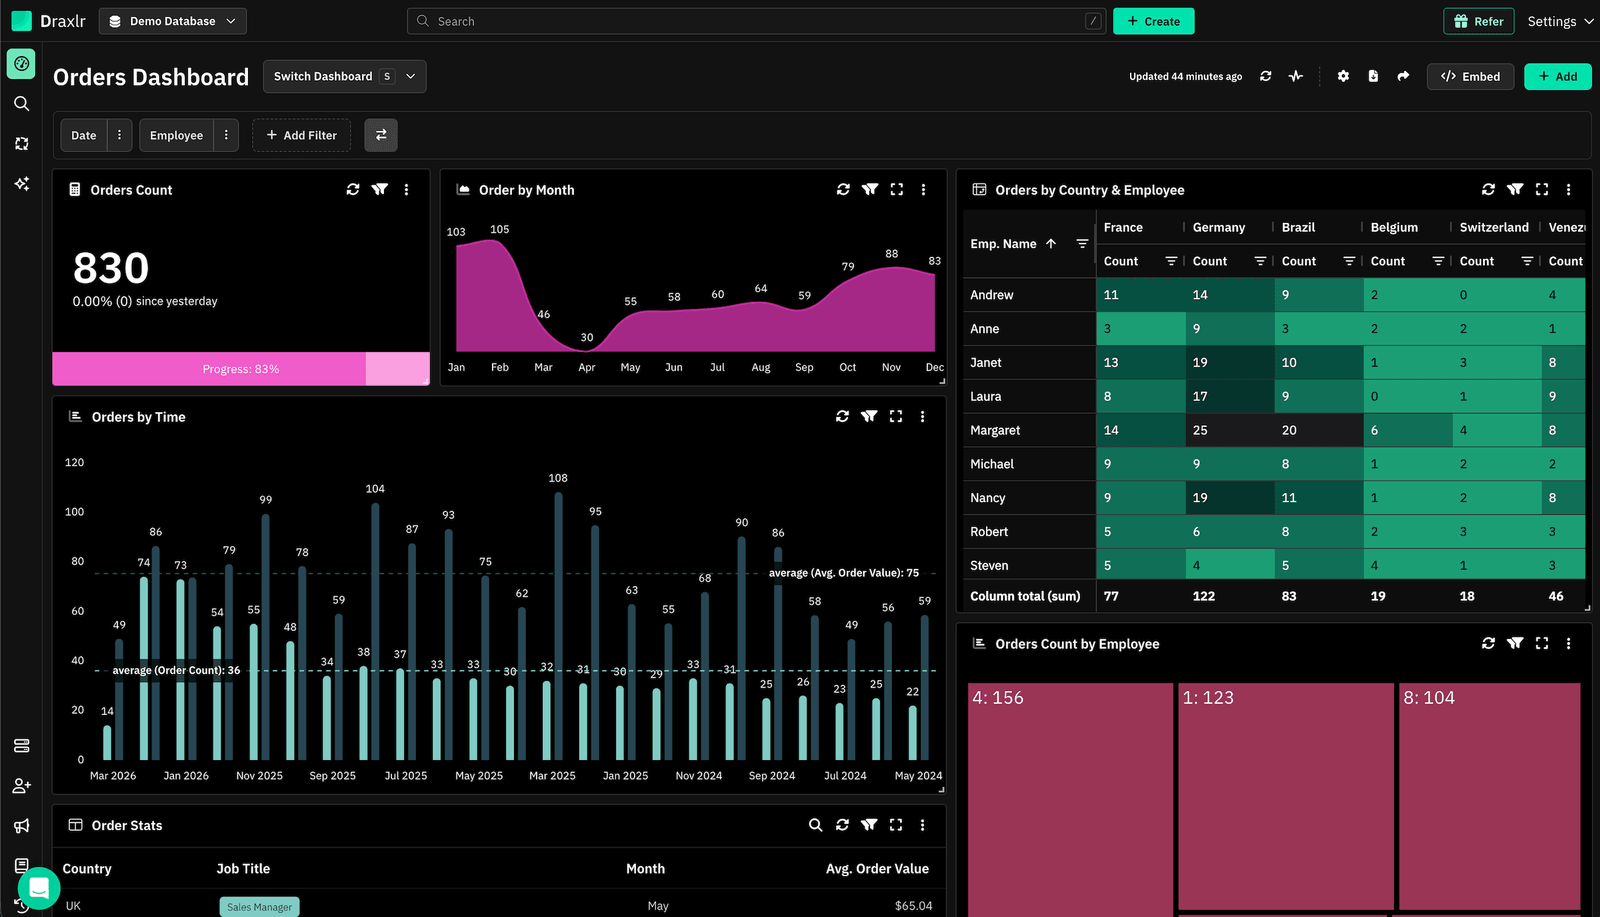
Draxlr is an analytics platform that connects directly to your SQL database and gets dashboards into your product quickly. Unlike GoodData, which requires learning MAQL before you can build anything useful, Draxlr works with what your team already knows. Technical users write SQL. Non-technical users can use the visual query builder or AI. Anyone can ask questions in plain English using AI-powered natural language querying. All three modes work from the same platform without switching tools or licenses.
Embedding is available via iframe, React JS SDK, Vue JS SDK, and Backend APIs across all embedded plans. Most teams have their first dashboard live in one to two weeks. Full production deployment typically lands in two to four weeks, considerably faster than the multi-month implementations common with enterprise platforms. Pricing is published on the website with no surprises i.e., the Premium plan at $75 per month includes all embedding methods, white labeling, and unlimited external viewers. As your customer base grows, your analytics cost does not.
Connect your DatabaseKey features for embedding
- Embedding methods: iFrame, React JS SDK, Vue JS SDK, and Backend APIs available across all embedded plans, giving engineering teams flexibility over how dashboards integrate into the host application without being forced into a single approach
- White labeling: Remove Draxlr branding entirely and apply your own colors, logo, and custom domain. Your customers see your product throughout, with no third-party branding in sight. Available on Premium plan and above
- Interactive dashboards: Embedded dashboards are not static reports. End users can apply filters, drill down into specific data points, and explore their data independently without filing requests to your team, reducing the analytics support burden on your side
- Multi-tenant support: Each customer environment is kept fully isolated from others. One deployment serves your entire customer base, with data separation enforced at the platform level
- Row-level security (coming soon): Per-tenant data isolation enforced at the query level, ensuring each customer sees only the rows they are authorized to access. Currently in development and expected to be available by end of May 2026
- Responsive dashboards: Embedded dashboards adapt automatically to different screen sizes, so your customers get a consistent experience whether they are viewing on desktop, tablet, or mobile within your application
- Export and sharing options: End users can export dashboard data to common formats and share views directly from within the embedded experience, without needing to leave your product or contact your team
- Unlimited external viewers: No per-seat charges for customers viewing embedded dashboards. Whether you have ten customers or ten thousand, your analytics cost stays predictable and flat
- Three query modes: Visual query builder for non-technical users who need answers without writing code, raw SQL for analysts who want full control, and AI-powered natural language querying for anyone who wants to ask a question in plain English and get a chart back. All three available from the same interface
- Alerts: Configure threshold-based alerts so users are notified automatically when data crosses conditions that matter to them, without having to check dashboards manually
- Fast implementation: Most teams have their first embedded dashboard live in one to two weeks. Full production deployment with multi-dashboard setups and access controls typically lands in two to four weeks
Pros
- Fully transparent pricing published on the website, no sales call required to understand what deployment will cost
- Unlimited external viewers at a flat rate means pricing stays predictable as your customer base grows, unlike per-seat or per-workspace models
- Short deployment timeline, most teams are live in one to two weeks
- No proprietary query language, SQL and visual query builder work out of the box
- White labeling, all embedding methods, and unlimited viewers available from $75 per month without needing an enterprise contract
Cons
- No formal semantic layer.
- Supports SQL Databases only.
Pricing
Premium $75/month, Power $125/month, Enterprise custom. 7-day free trial, no credit card required.
What G2 users say about Draxlr
Exactly what we needed for embedded analytics at a fair price. Draxlr gives us everything we need for embedded analytics at a fraction of what other tools charge. The pricing is transparent and we didn't have to compromise on features to stay within budget. — All Draxlr reviews
2. Looker
Best GoodData Alternative For: Google Cloud organizations that need analytics-as-code with deep BigQuery integration and strong governance.
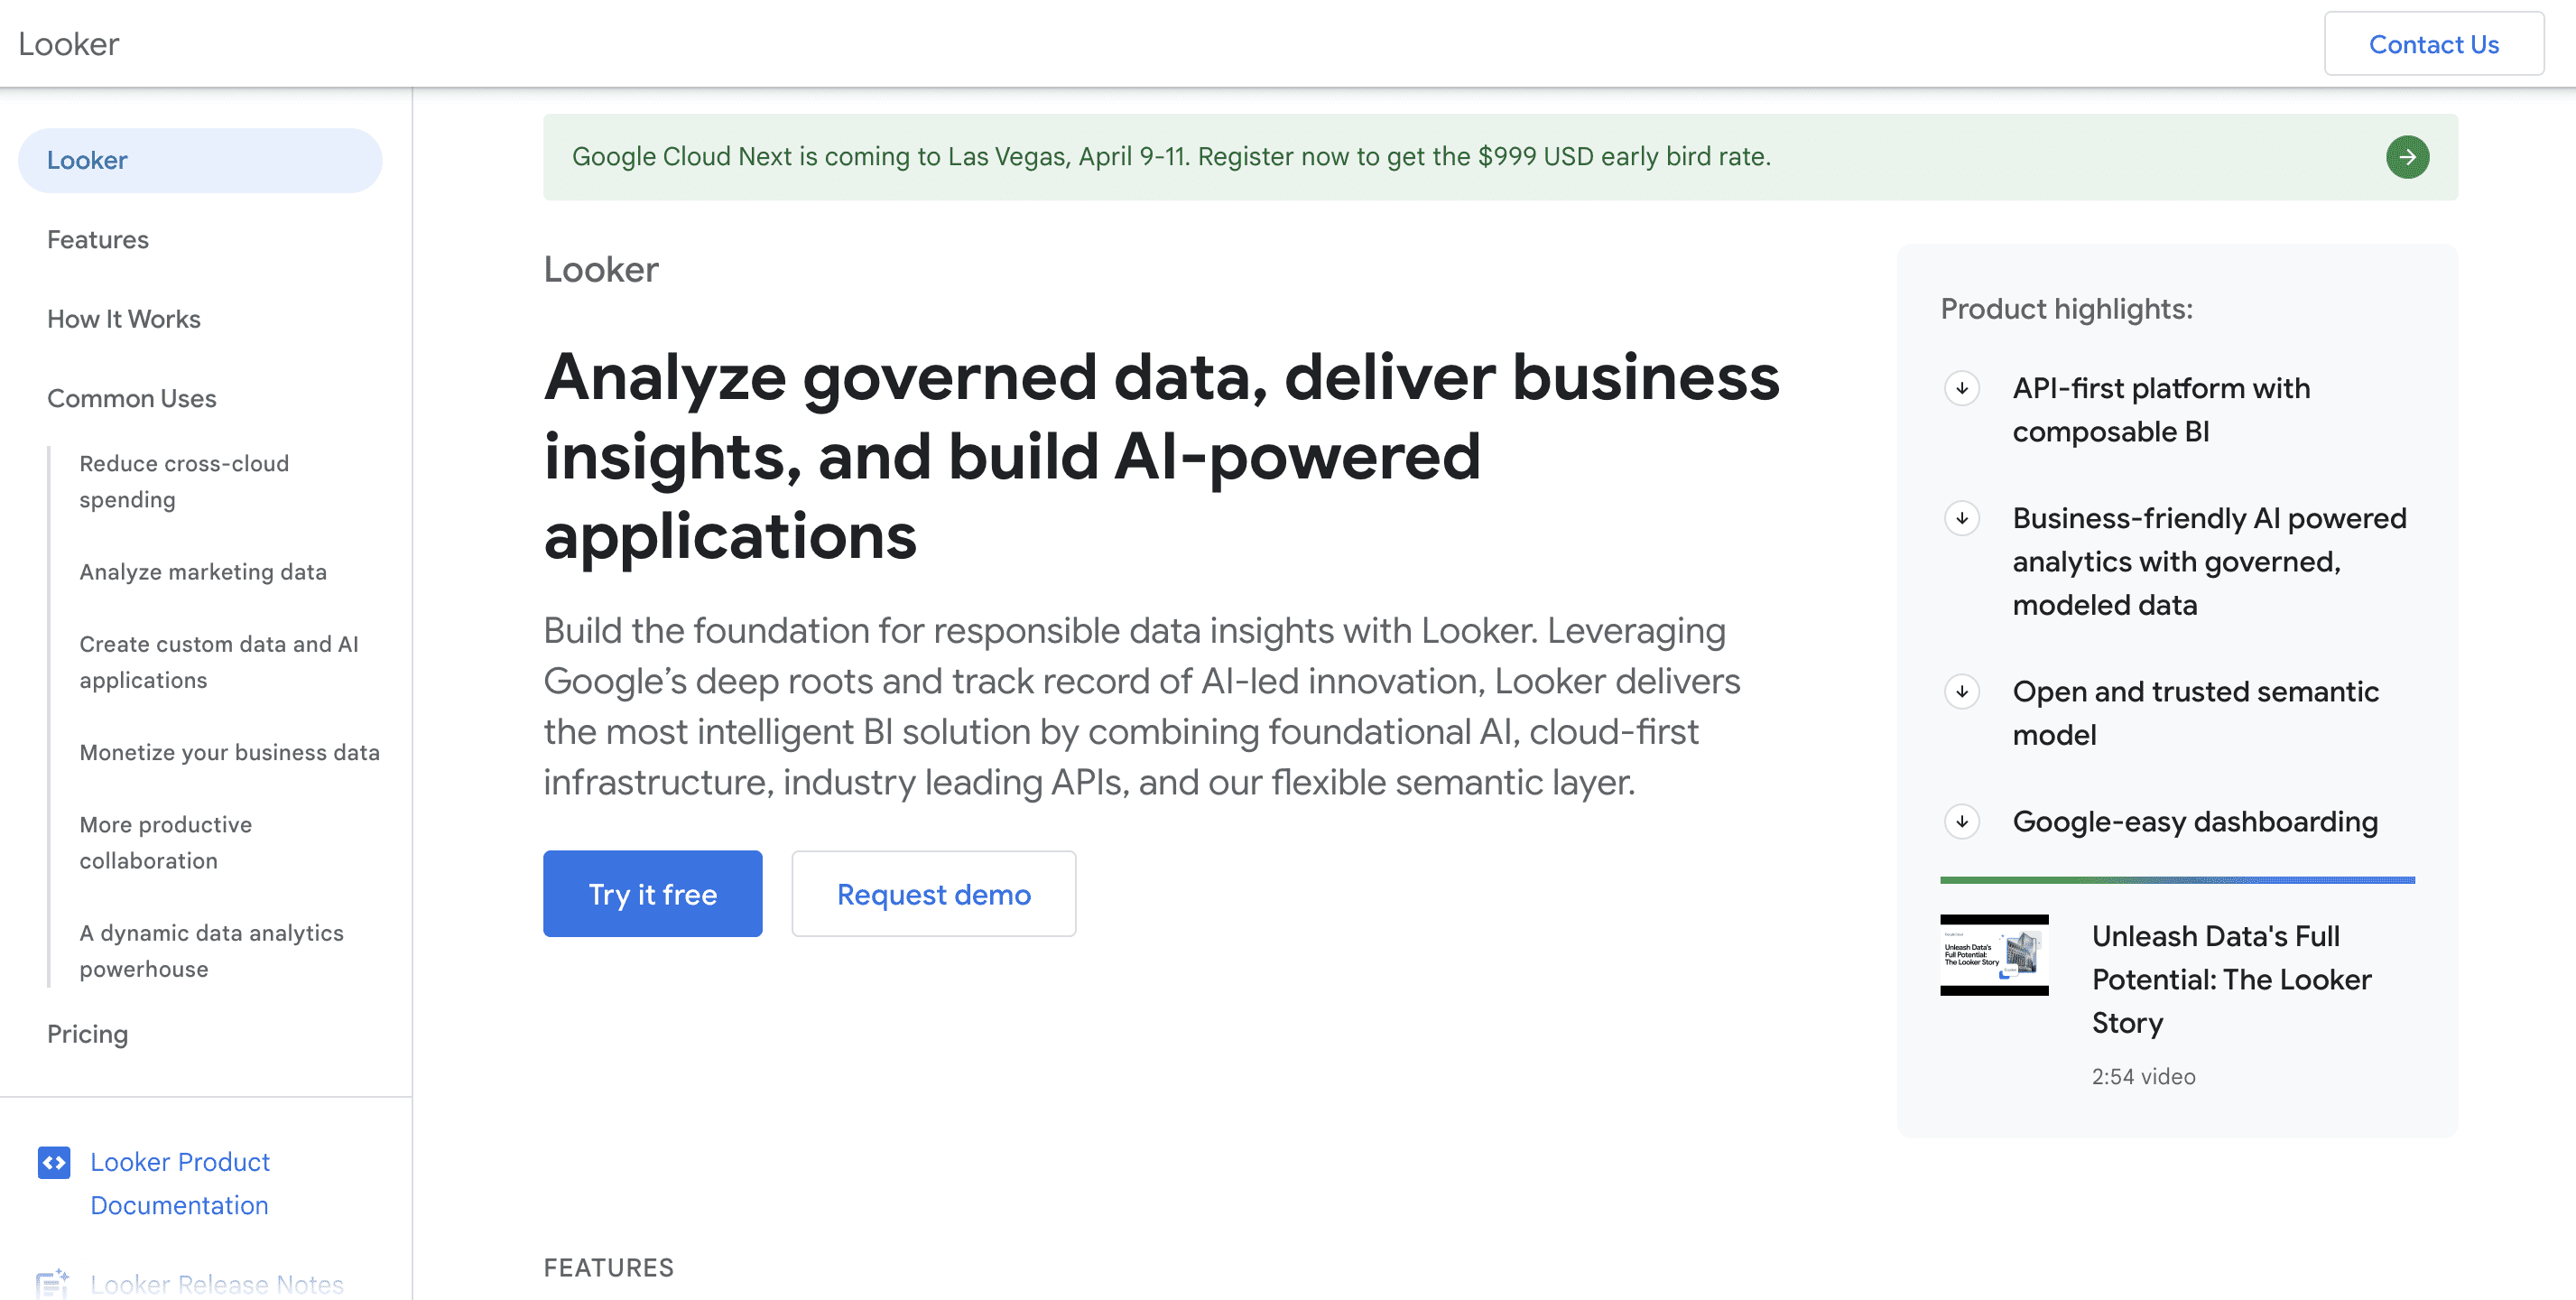
Looker takes a code-first approach to analytics through LookML, a modeling language that treats metric definitions and data relationships as versioned, testable code. For teams that want Git workflows, code review, and CI/CD pipelines applied to their analytics layer, this is a meaningful differentiator. For embedding, Looker offers iframe and SDK-based integration with row-level security handled at the semantic layer level. The Gemini AI integration adds natural language querying for end users. Pricing is custom and typically starts around $3,000 per month, and full deployment takes 6 to 12 weeks.
Key features for embedding
- Embedding methods: Signed iframe embedding and JavaScript SDK for authenticated, secure customer-facing dashboards with per-session URL generation
- Row-level security: Data isolation for individual customers is enforced through LookML rather than application-level code, making it more consistent across dashboards
- Multi-tenancy: Single Looker deployment serves multiple isolated customer environments through LookML-defined access rules
- White labeling: Custom themes, branding, and domain available on the Embed edition
- Gemini AI integration: Natural language querying for end users, allowing customers to ask questions without navigating dashboard controls
- LookML governance: Business metric definitions are version-controlled, testable code, ensuring consistency across every embedded dashboard and query
Pros
- Consistent metric definitions enforced at the semantic layer prevent dashboard drift across teams
- Deep BigQuery integration with native querying and no data duplication
- Strong access controls and role-based permissions suited to enterprise compliance requirements
- Broad connector support across 50+ SQL dialects and cloud data warehouses
Cons
- LookML has a steep learning curve, replacing one proprietary language (MAQL) with another
- Pricing is custom and typically starts around $3,000 per month with no published tiers
- Implementation takes 6 to 12 weeks, one of the longest timelines on this list
Pricing
Custom, typically $3,000+ per month. No free trial.
What G2 users say about Looker
Looker provides flexible, extensible data visualization. There is not full feature parity in embed. — Review from on G2
3. Power BI Embedded
Best GoodData Alternative For: Organizations already on Microsoft 365 and Azure that want to reuse existing Power BI reports in their product.
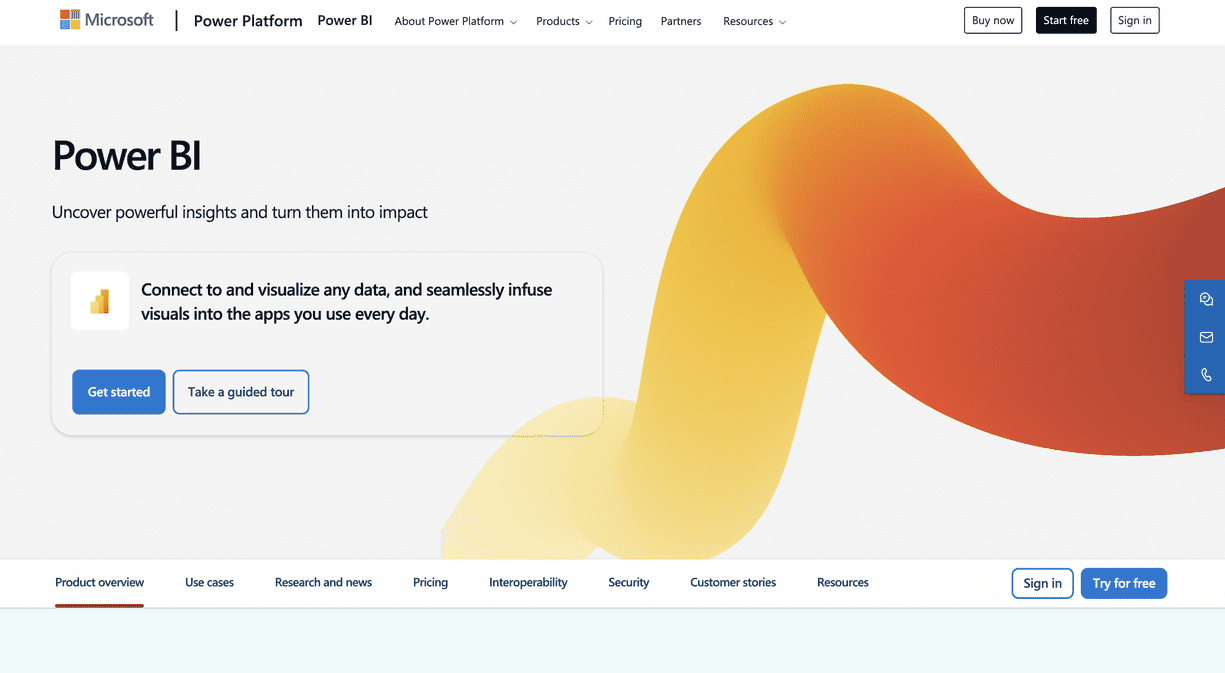
Power BI Embedded lets you take Power BI reports and dashboards and embed them into your own application using Azure capacity. For organizations already using Power BI internally, report investments carry over rather than being rebuilt in a new tool. Embedding is handled through the Power BI JavaScript API, with row-level security and multi-tenancy supported through careful configuration. The Copilot integration adds AI-powered natural language querying for embedded end users. Pricing is based on Azure capacity SKUs and can range from roughly $500 to several thousand dollars per month depending on usage patterns.
Key features for embedding
- Embedding methods: JavaScript API for direct DOM integration and iframe embedding, allowing reports to be surfaced inside external applications
- Row-level security: Enforced per user or group, restricting what data each embedded viewer can access. Requires careful configuration for multi-tenant SaaS environments
- Multi-tenancy: Separate customer environments supported through service principal authentication and workspace isolation
- White labeling: Power BI branding can be removed from embedded reports. Available on Power BI Embedded capacity plans
- Copilot AI: Natural language querying for embedded end users, powered by Microsoft's AI stack. Lets customers ask questions and receive visual answers without building custom queries
- Azure integration: Capacity-based pricing through Azure SKUs scales with usage, and integrates with other Microsoft infrastructure your team may already use
Pros
- Familiar interface for business users already using Excel or Power BI internally
- Extensive chart library with both native and community-built visualization types
- Copilot AI integration for natural language querying without custom development
- Strong Microsoft ecosystem integration across Azure, Teams, and SharePoint
Cons
- Capacity-based Azure pricing is harder to forecast than flat-rate alternatives, costs can escalate quickly
- DAX (the calculation language) has a steep learning curve, consistently the top complaint in G2 reviews
- Performance degrades with large datasets, cited in roughly 95% of reviews mentioning speed
- Multi-tenancy and row-level security configuration requires careful architectural planning
Pricing
Capacity-based, approximately $500 to $5,000+ per month depending on Azure SKU and usage.
What G2 users say about Power BI Embedded
Easy to learn BI tool. Not as powerful nor as customizable as some of its competitors. It uses DAX for many things, which can be difficult for some to use. The tool is very rigid sometimes, not giving you the flex quite to do what you want to do, and sometimes you have to settle for what IT wants something to look like. The ability to embed analytics is not as flexible as competitors. — Review from on G2
4. Sisense
Best GoodData Alternative For: Mid-market and enterprise SaaS teams with large datasets that need fast query performance and published pricing.
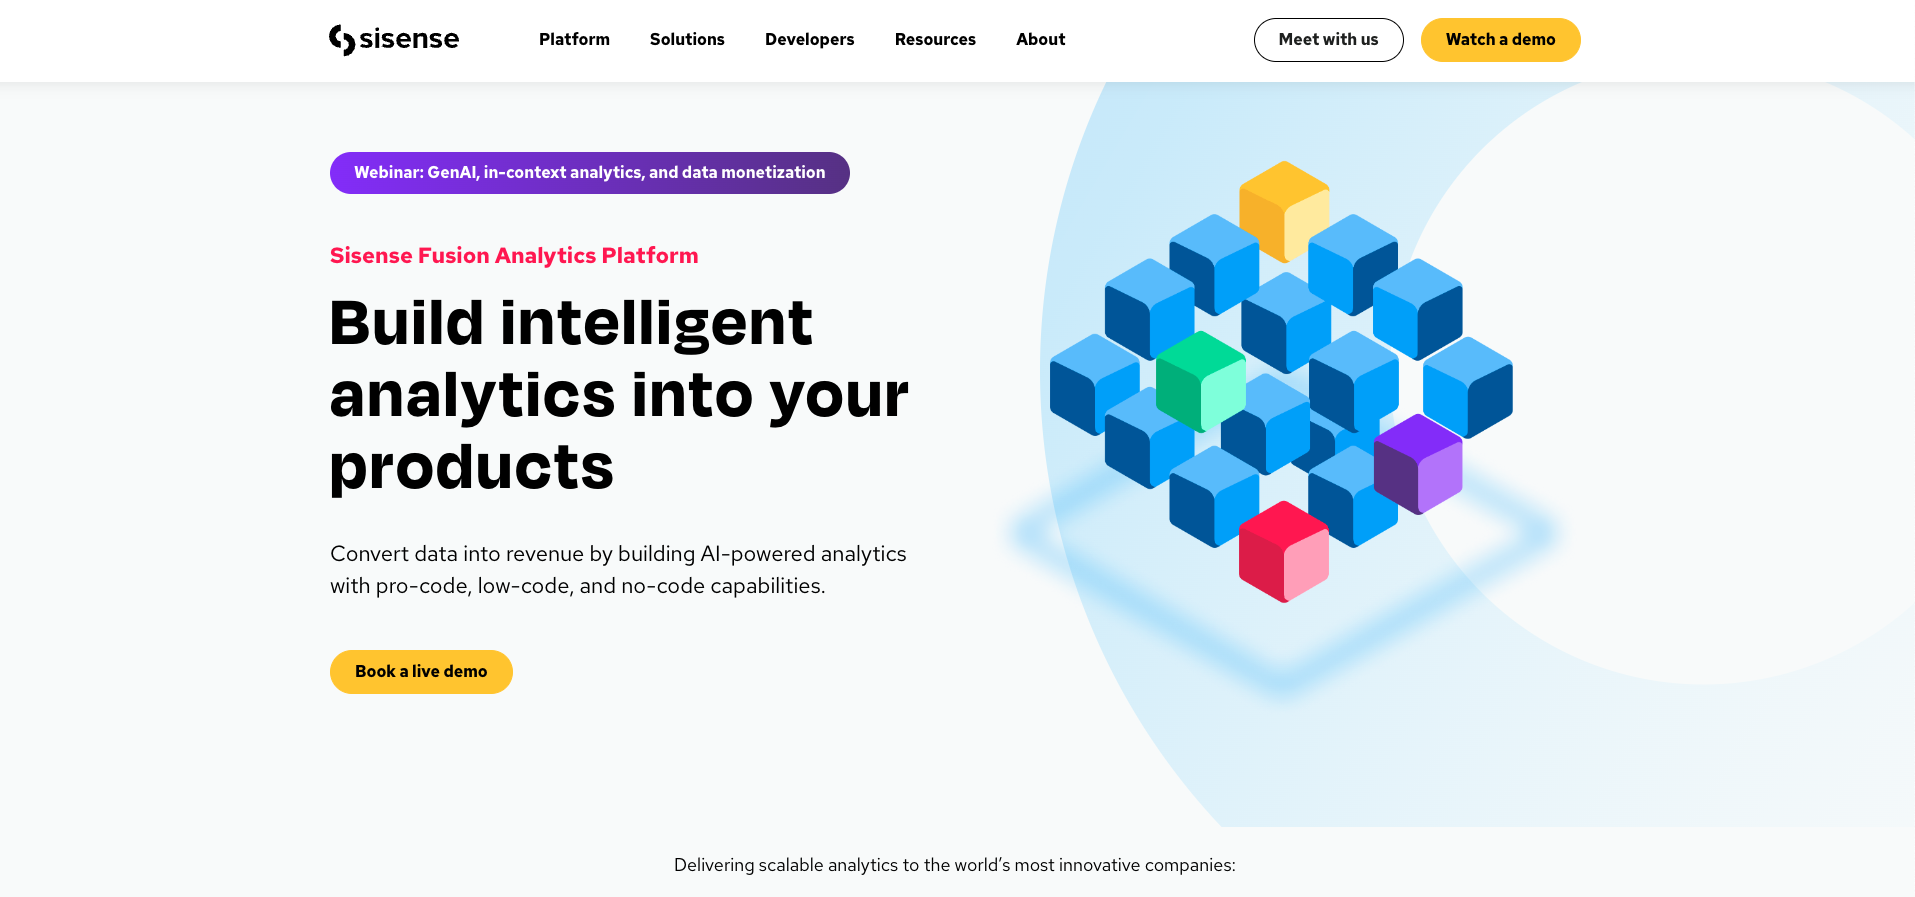
Sisense is a business intelligence and analytics platform with an in-chip data engine that processes queries in memory, which generally means faster dashboard loading on large datasets. For embedding, it supports SDK and API-based integration alongside iframes, with white labeling and multi-tenancy available on higher plans. AI-powered insight surfacing can highlight anomalies and trends automatically in embedded dashboards. Unlike GoodData, Sisense publishes pricing. The Launch plan starts at $399 per month and the Grow plan at $1,299 per month includes white labeling, both with a 7-day free trial.
Key features for embedding
- Embedding methods: Compose SDK for React-based native embedding, Sisense.JS for widget-level embedding, and iframe for standard integration
- In-chip analytics engine: Processes queries in memory, which generally means faster dashboard loading on large datasets compared to traditional query engines
- White labeling: Full brand customization including colors, fonts, and logo. Available on Grow plan ($1,299/month) and above
- Multi-tenancy: Separate customer environments supported through role-based permissions and data model configuration
- Row-level security: Column and row level security available, though reviewers note tenant isolation requires intentional design and ongoing configuration
- AI-powered insights: Automatically surfaces anomalies, trends, and narrative summaries within embedded dashboards without end users needing to explore manually
- Published pricing: Unlike GoodData and Looker, Sisense publishes plan tiers with a 7-day free trial, allowing cost evaluation without a sales call
Pros
- Published pricing tiers with a 7-day free trial, no sales call required to evaluate
- In-chip engine handles large datasets faster than traditional query-based tools
- Strong data connector support
Cons
- Deep visual customization is harder than it appears, matching your product's branding requires significant engineering effort
- Learning curve is steeper than marketed, multiple G2 reviewers note it was described as low-code but required more technical skill in practice
- Documentation quality is frequently criticized, with outdated links and gaps in guidance
- Bugs in the database cache system are flagged repeatedly across G2 and Reddit reviews
Pricing
Launch $399/month (50 viewer seats, 2 designer seats), Grow $1,299/month (100 viewer seats, 5 designer seats, white labeling), Scale custom. 7-day free trial on Launch and Grow.
What G2 users say about Sisense
Lots of potential but not delivering on all of its promise. The conceptual approach of the product is exactly what we were looking for, a straightforward embedded analytics tool. The tool makes creating visualizations pretty easy and has a lot of flexibility in data sources. — Review from on G2
5. Luzmo
Best GoodData Alternative For: Product teams that want a purpose-built embedded analytics platform with a clean developer experience.
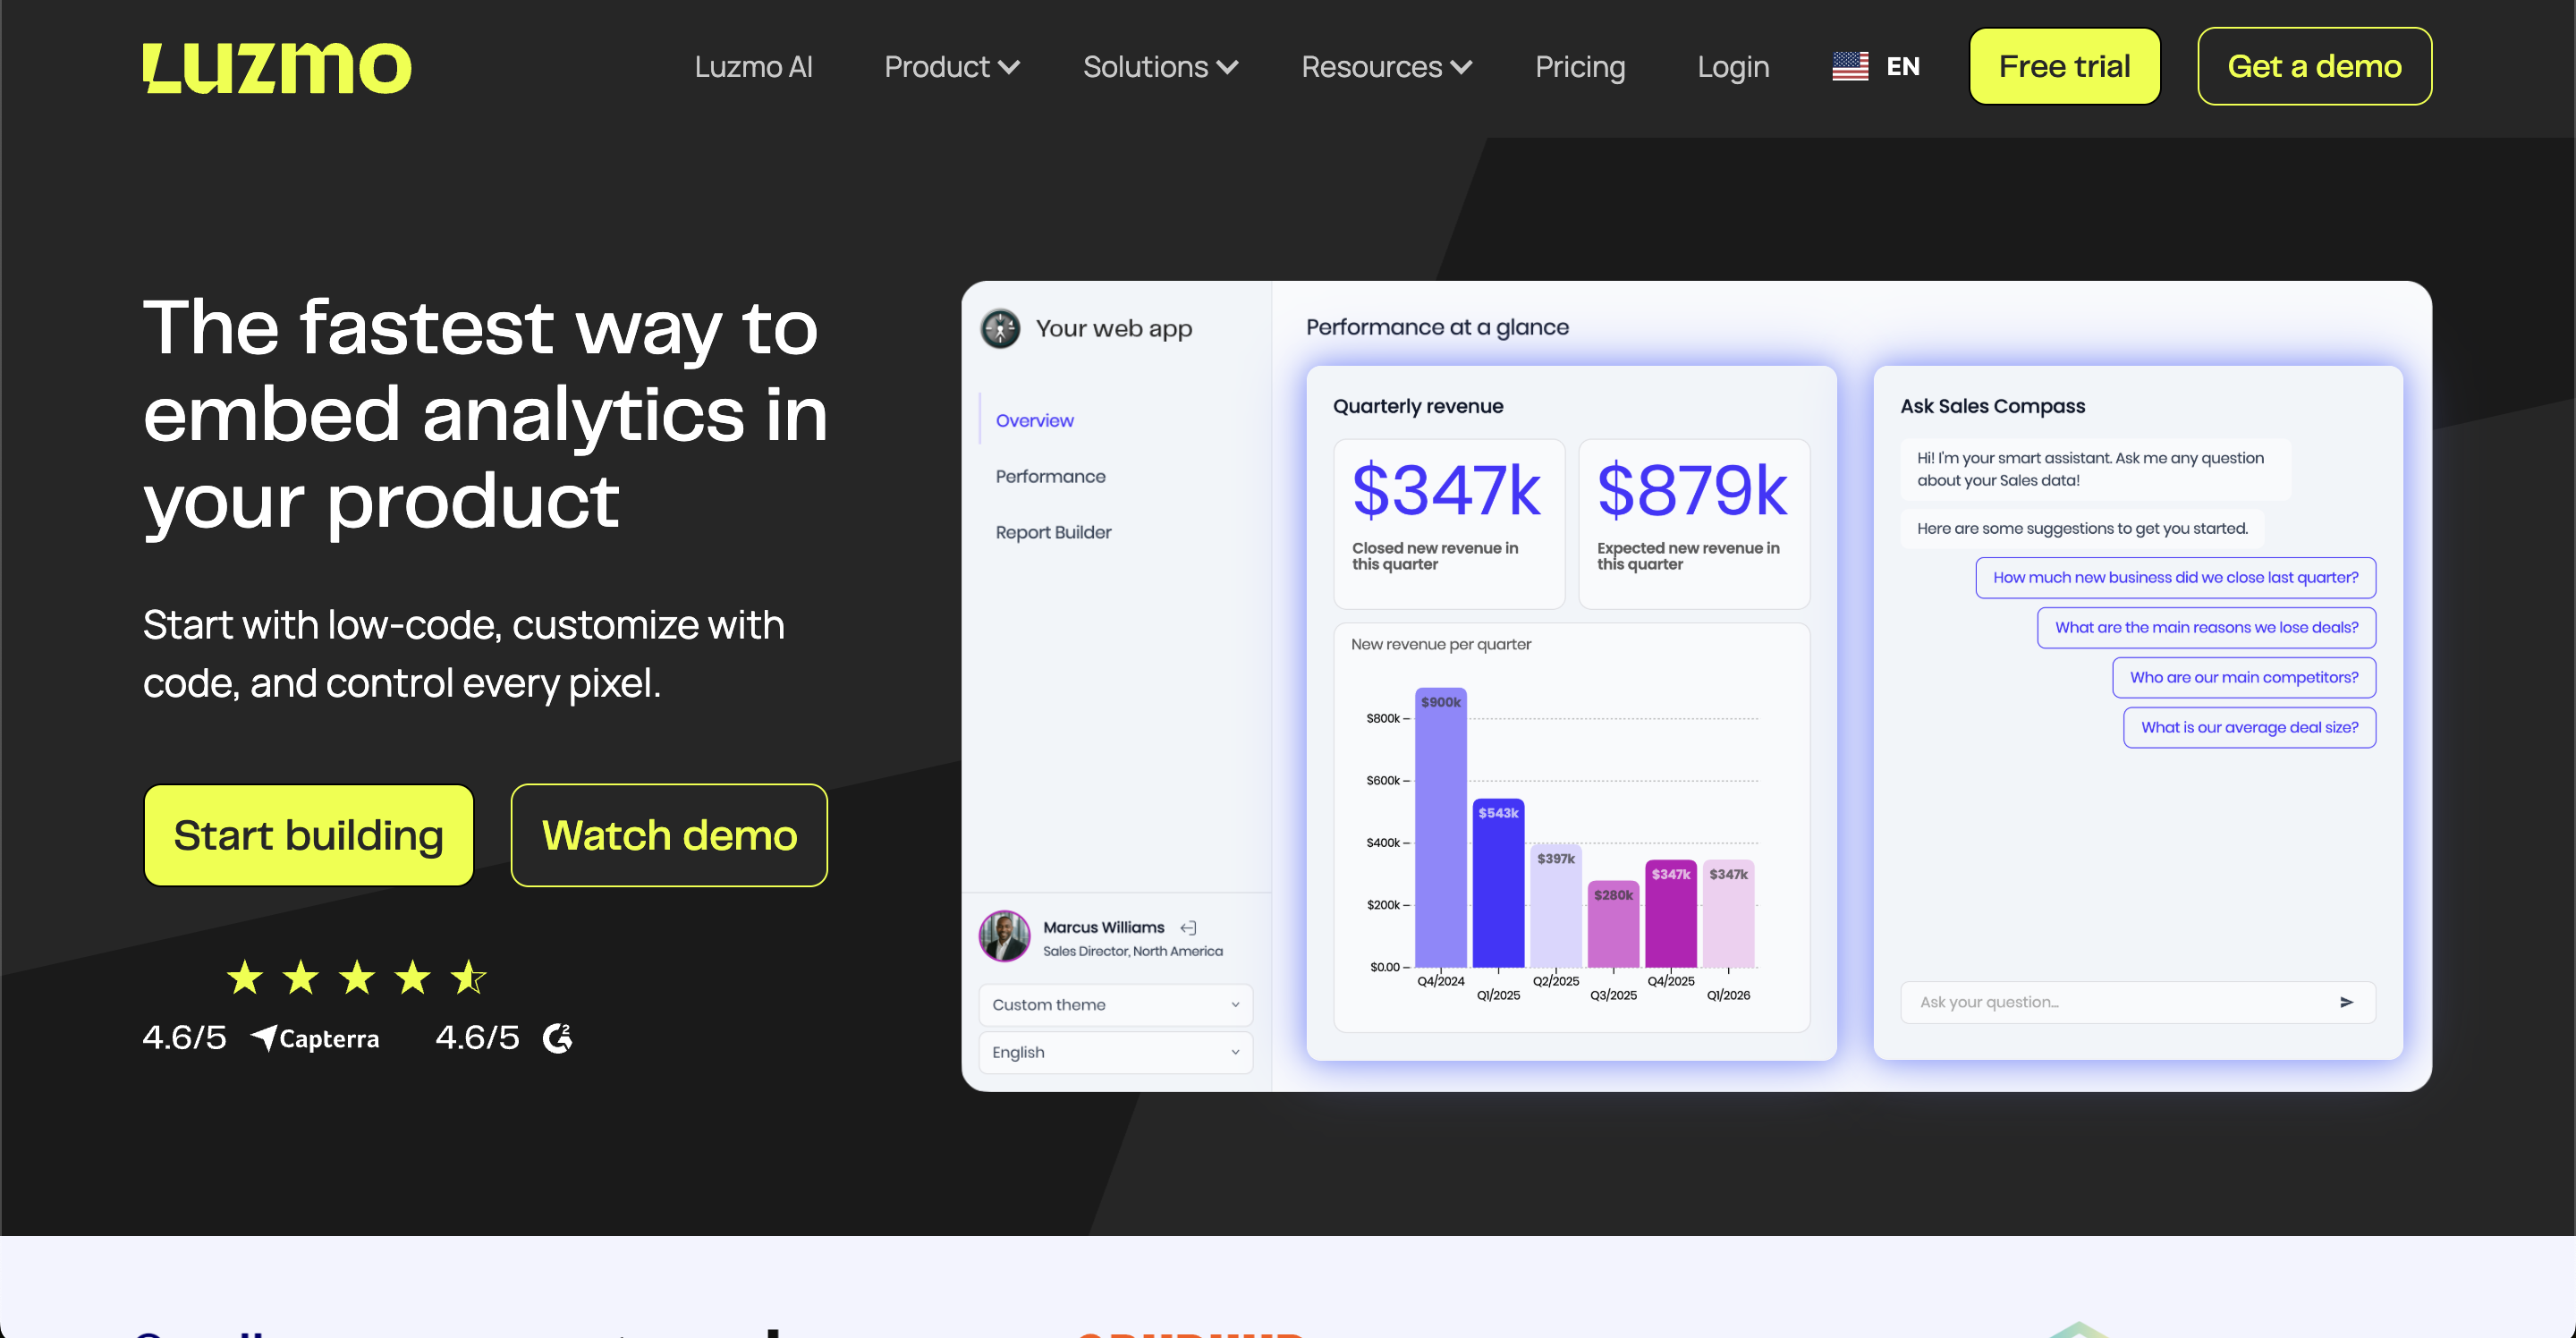
Luzmo (formerly Cumul.io) focuses on embedding analytics into SaaS products rather than adapting an internal BI tool for external use. It offers separate tracks for non-technical users (Studio, a no-code builder) and developers (Flex SDK, for programmatic control). Natural language querying for end users is available through Luzmo IQ. White labeling requires the Premium plan. Pricing is billed annually, and scales with Monthly Active Users, which means costs increase as your customer base becomes more active.
Key features for embedding
- Embedding methods: Studio offers a no-code drag-and-drop interface for building dashboards without engineering involvement. Flex SDK gives developers programmatic control over layout, data binding, interactivity, and styling
- Multi-tenancy: Customer data isolation handled through account overrides at the platform level
- White labeling: Brand customization of embedded dashboards available on Premium plan (€1,995/month) and above
- Natural language querying: Luzmo IQ allows end users to ask questions about their data in plain English within embedded dashboards
- Chart library: Multiple chart types including standard charts, maps, and custom options
- MAU-based pricing: Costs scale with Monthly Active Users rather than per seat or per workspace
Pros
- Purpose-built for embedding, documentation and APIs are designed for SaaS product teams
- Dual no-code and SDK tracks serve both technical and non-technical dashboard builders
- Fast to get first dashboard live, reviewers consistently praise ease of initial setup
Cons
- MAU-based pricing means costs grow as your customer base becomes more active, harder to forecast at scale
- Limited querying capabilities for complex SQL use cases, reviewers note it can feel restrictive
- Performance issues with large datasets and certain connector configurations, particularly Databricks
- Some missing features compared to more mature platforms, components have occasional bugs
Pricing
Starter $495/month, Premium $1,995/month (both billed annually), Enterprise custom.
What G2 users say about
Fast and user-friendly tool, sometimes a bit restrictive. Very fast to create dashboards, user friendly so easy to build those. Nice embedding in pages and also very nice support to help us solve our issues ! They also give our company some visibility in their roadmap so that we can see what is coming and if it can solve our issues. — Review from on G2
6. Omni (Explo)
Best GoodData Alternative For: Teams that want governed analytics powering both internal BI and customer-facing embedded dashboards from a single semantic platform.
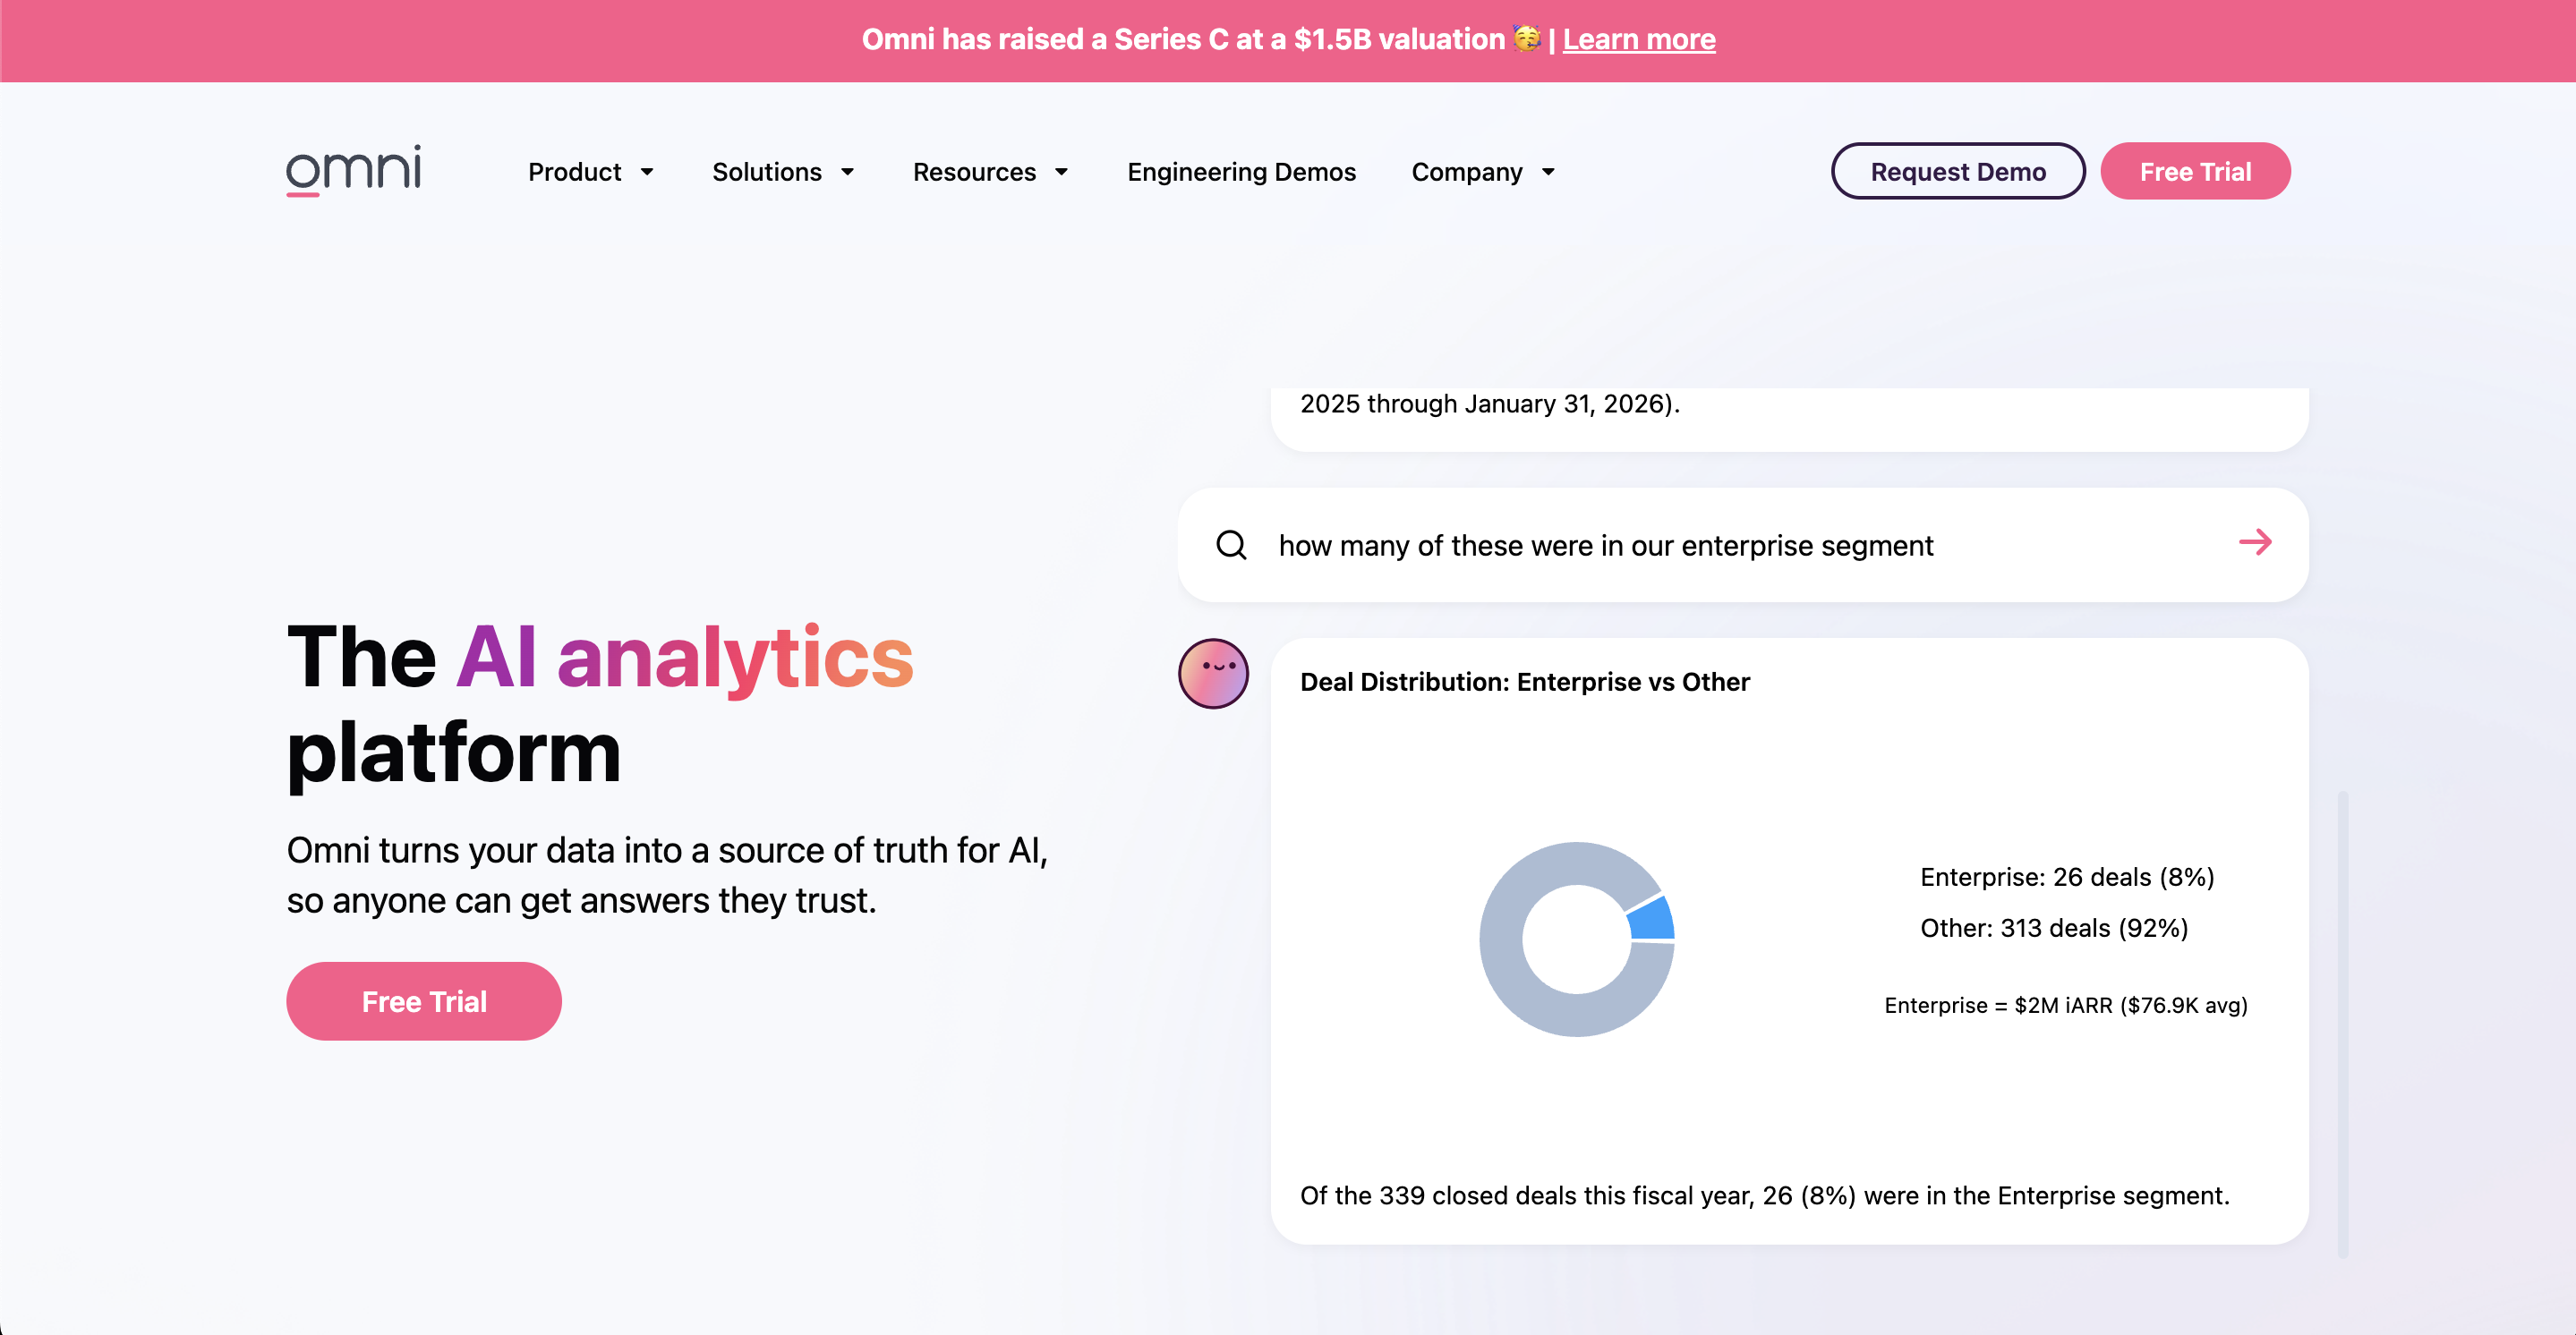
Omni is a BI and analytics platform built around a semantic layer that centralizes metric definitions and ensures consistency across dashboards, queries, and AI-generated answers. It supports SQL, spreadsheet-style formulas with Excel-compatible syntax, and point-and-click exploration from the same interface. Omni acquired Explo in 2024, integrating its customer-facing embedded analytics capabilities into the broader platform. For teams that need both governed internal reporting and embedded product analytics, Omni offers a single semantic foundation for both use cases. Pricing is not publicly listed. If you are evaluating Explo, see our Explo alternatives guide for current options.
Key features for embedding
- SDK embedding: Embedded dashboards integrate into your product via SDK, inheriting the same semantic layer definitions used for internal analytics
- Semantic layer: Centralizes metric definitions so embedded customer dashboards and internal dashboards reference the same calculations, preventing metric drift between products
- SQL and spreadsheet-style exploration: Technical users can write SQL, non-technical users can use Excel-compatible formula syntax, both working from the same governed layer
- AI-powered queries: Natural language querying allows customers and internal users to ask data questions without writing SQL or building custom queries
- Row-level security: Data isolation enforced at the semantic layer level, ensuring customers see only their own data in embedded dashboards
- Single platform for internal and embedded analytics: Omni acquired Explo in 2024, consolidating customer-facing embedded analytics and internal BI under one semantic foundation
Pros
- Balances governance and flexibility, described by reviewers as the middle ground between Looker's rigidity and Metabase's looseness
- Accessible to non-technical users, workbook model lets analysts build on a shared governed layer without writing LookML
- Single semantic foundation for internal and customer-facing analytics reduces metric drift between products
Cons
- Pricing is not publicly listed, requires a sales conversation before evaluating cost
- Semantic layer is still maturing, reviewers note it is less developed than Looker's equivalent
- Fewer reviews than more established tools, harder to assess at scale
- Integration can be challenging, data accuracy during setup requires validation
Pricing
Not publicly listed, requires contact. Free trial available.
What G2 users say about
A modern plug and play BI tool. A little difficult for non-SQL folks and prices seem a little high compared to other alternatives available. — Review from on G2
7. Metabase
Best GoodData Alternative For: Teams that want to validate an embedding use case at low upfront cost before committing to a dedicated platform.
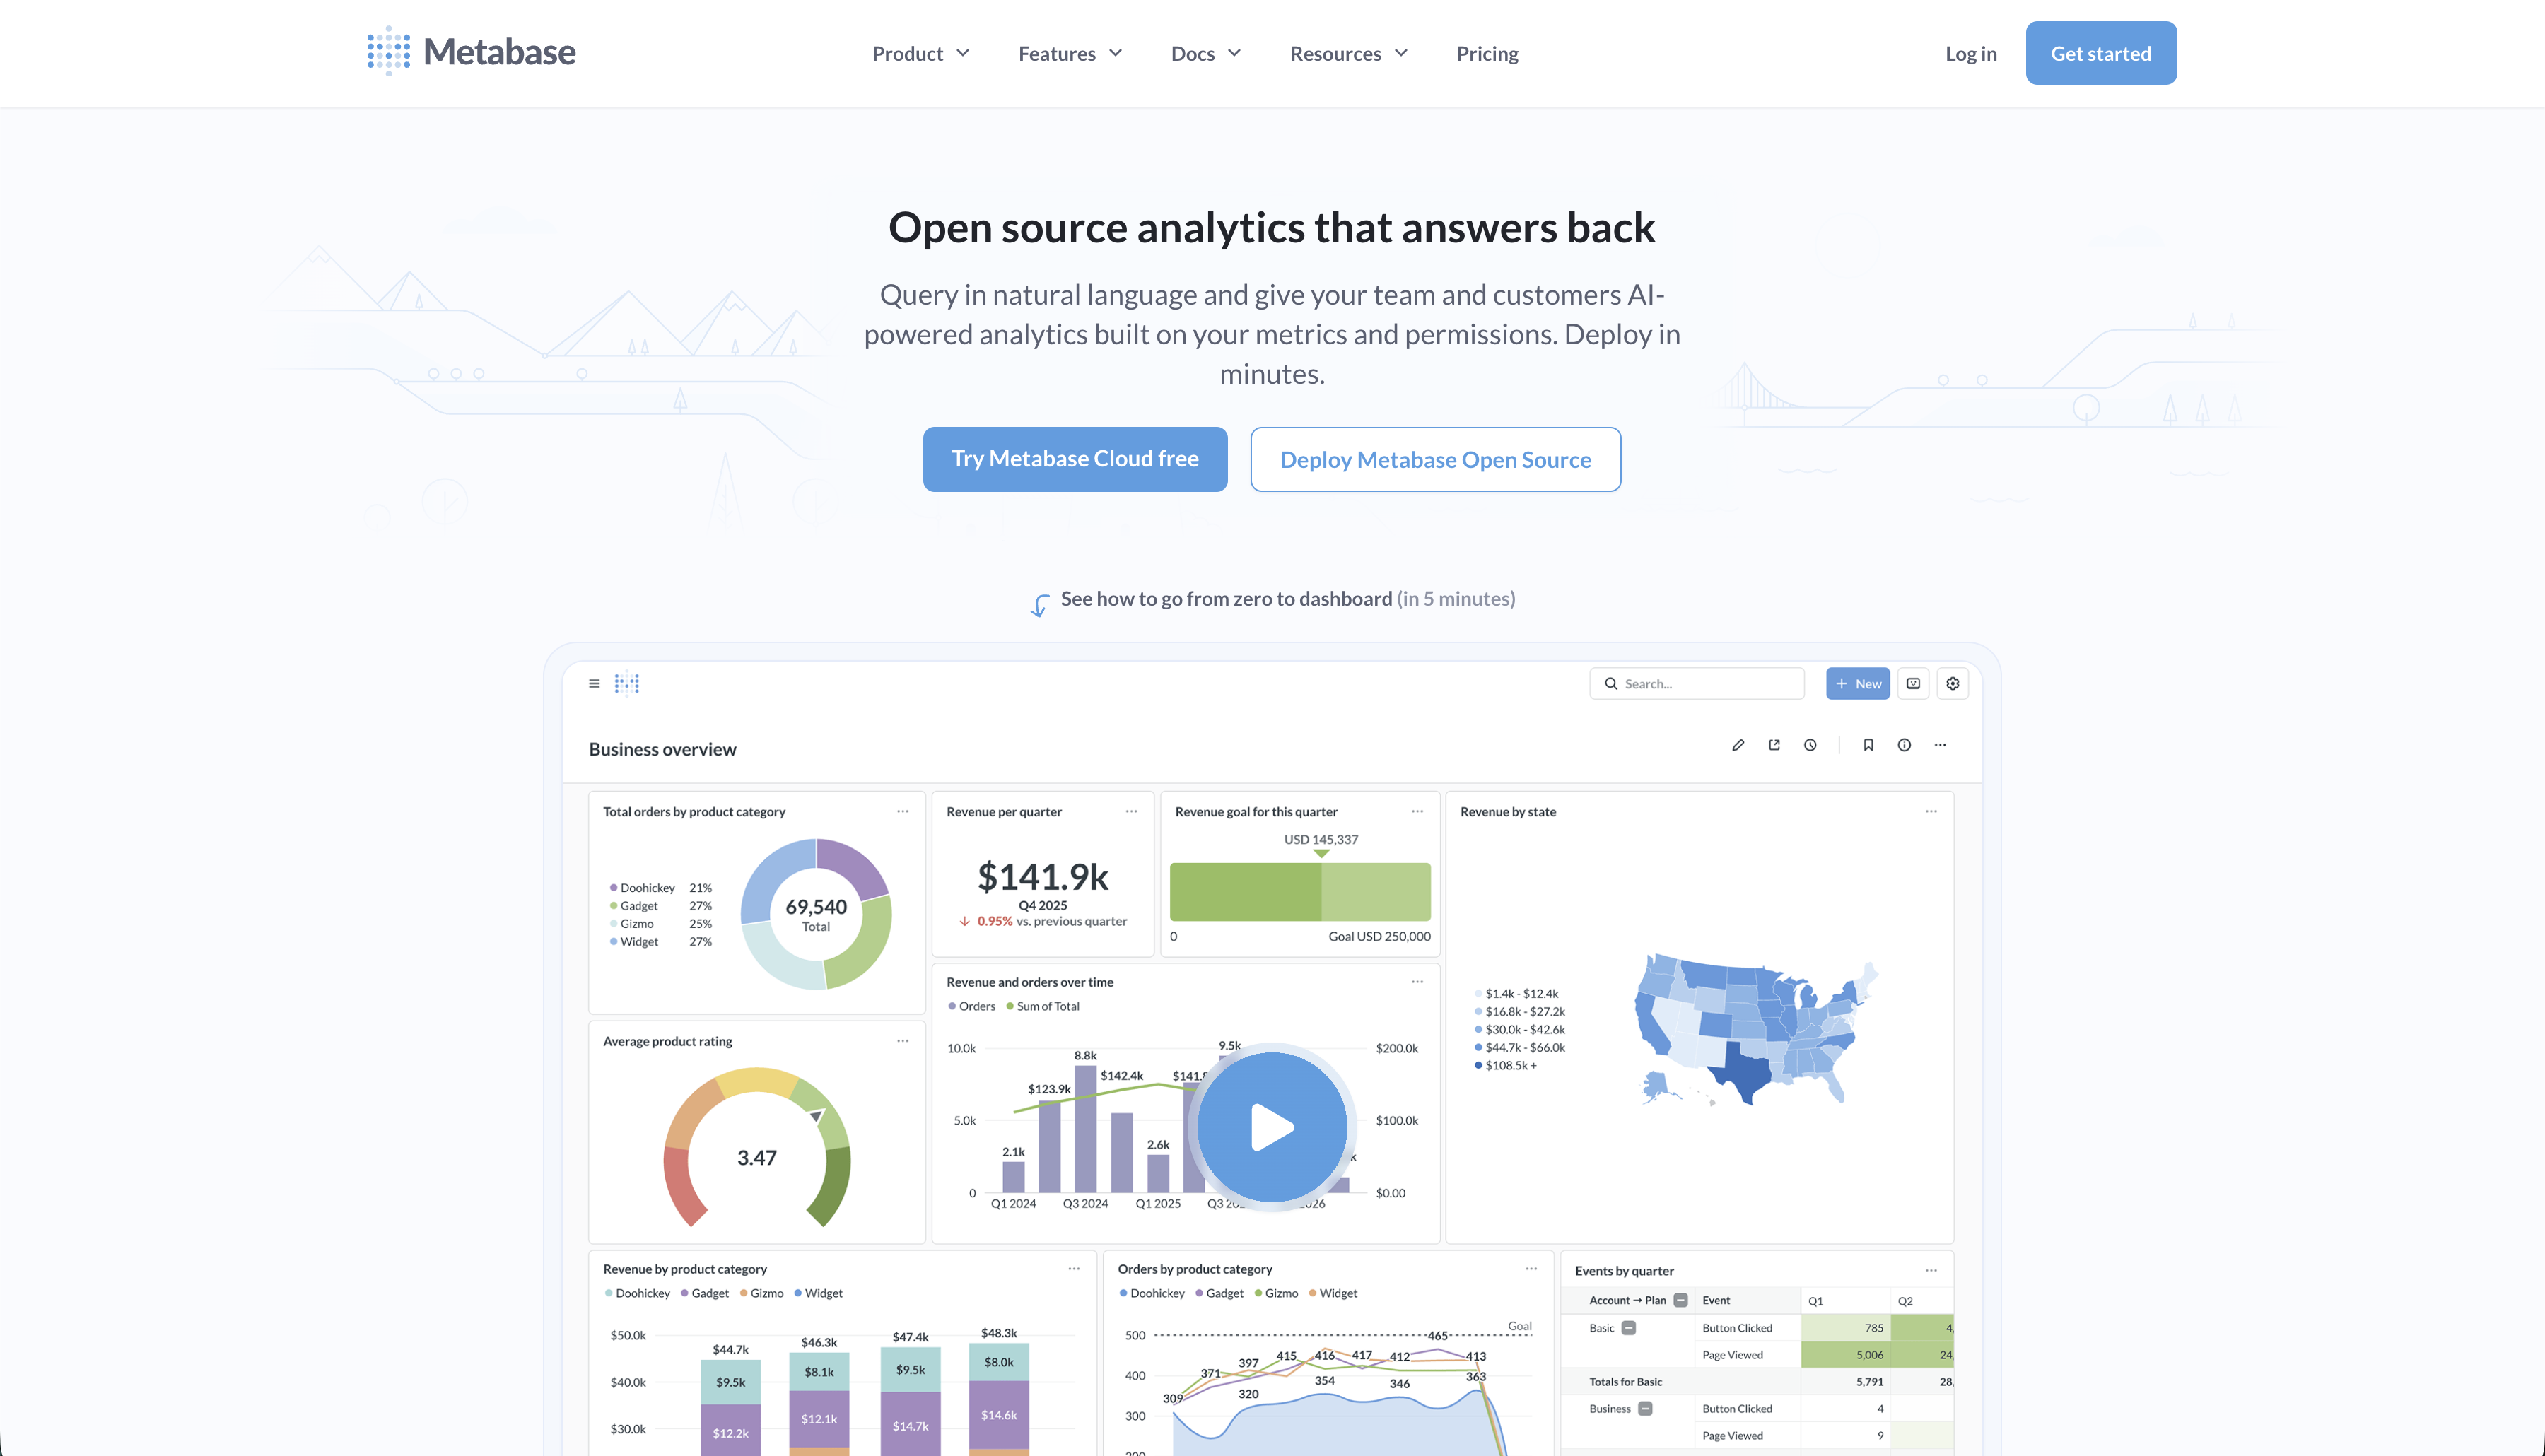
Metabase is an open-source business intelligence tool primarily designed for internal analytics that also supports embedding. The self-hosted open-source version is free, making it the lowest-barrier entry point on this list. Metabase offers static embedding (view-only, no sign-in required) and interactive embedding (authenticated, full interactivity). Static embedding is available from the Starter plan at $100 per month but carries a "Powered by Metabase" watermark. Interactive embedding with white labeling requires the Pro plan at $575 per month. Critically, every authenticated viewer counts as a paid user at $12 per month, meaning a product with 500 customers can reach roughly $74,000 per year in user fees alone.
Key features for embedding
- Static embedding: View-only dashboards embedded via signed URLs, available from the Starter plan ($100/month). Carries a "Powered by Metabase" watermark and cannot be white labeled
- Interactive embedding: Authenticated, fully interactive dashboards for customer-facing use. Requires Pro plan ($575/month). Every authenticated viewer counts as a paid user at $12/month
- React SDK: Component-based embedding for deeper frontend integration. Available on Pro and above, allowing more native-feeling dashboard integration than iframes alone
- Row-level security: Data sandboxing to isolate each customer's data within embedded dashboards. Available on Pro plan and above
- White labeling: Remove Metabase branding and apply custom colors and fonts. Available on Pro plan and above
- Visual query builder: Non-technical end users can explore data with a point-and-click interface without writing SQL, available across all plans
Pros
- Open-source self-hosted version
- Fast to set up, most teams have basic dashboards running in days
- No proprietary query language, SQL and visual query builder are accessible without training
- Large community and active development
Cons
- Per-authenticated-viewer pricing makes costs unpredictable and potentially very high for SaaS products with large customer bases
- Interactive embedding with white labeling requires Pro at $575/month, the free version only offers static embeds with a watermark
- Limited customization, reviewers note the interface cannot be significantly restyled to match a host product's design
- Struggles with advanced multi-tenant SaaS embedding requirements compared to purpose-built tools
Pricing
Starter $100/month (static embed, no white labeling), Pro $575/month + $12/user/month (interactive embedding, white labeling, RLS), Enterprise custom.
What G2 users say about
Great but only if you're good at understanding analytics. if you understand analytics then it's a really great tool. the filters you use to help navigate you to the right sets of data makes life really easy. the dashboards you can create too are great and the way you can place them, change the sizes of them to tailor to exactly what you want is great. it's definitely not designed for those who just want to pull data, you need to understand how to work data and analytics. when you're joining pieces of data together it can get confusing as well with the different types of joining. — Review from on G2
How to Choose the Right GoodData Alternative for Embedding
-
If pricing transparency is the priority, Draxlr, Sisense, Luzmo, Power BI Embedded, and Metabase all publish pricing. GoodData, Looker, and Omni require a sales conversation before you can estimate cost.
-
If deployment speed matters, Draxlr and Metabase have the shortest timelines. Draxlr gets most teams to a live embedded dashboard in one to two weeks. Metabase can be running in days for simpler use cases. Looker, Power BI Embedded, and Sisense typically take four to eight weeks or more.
-
If performance on large datasets is the main concern, Sisense's in-chip engine is the most direct solution. Looker running natively on BigQuery is also strong for large-scale cloud data warehouses.
-
If you want a platform purpose-built for embedding, Luzmo is designed from the ground up for SaaS product analytics. Draxlr is also a strong fit here and adds the advantage of transparent pricing and a shorter deployment timeline.
-
If you need both internal and customer-facing analytics from one semantic layer, Omni is the most complete solution following its Explo acquisition.
-
If budget is the primary constraint, Draxlr at $75 per month is the most affordable option with full embedding support and published pricing.
Conclusion
No single tool on this list is the right choice for every team. GoodData has real strengths in governance and multi-tenancy at enterprise scale, but the combination of unpublished pricing, a proprietary query language, and a longer implementation timeline makes it a poor fit for teams that need to move quickly or evaluate cost independently.
The GoodData alternatives here cover a wide range of requirements. Teams with tight budgets and straightforward needs have viable options at the lower end of the pricing spectrum. Teams with large datasets, complex governance requirements, or existing cloud infrastructure investments have purpose-built options at the higher end. The right starting point is understanding which of GoodData's limitations is actually driving your evaluation, then matching that to the tool that addresses it most directly.
A free trial or a short proof-of-concept deployment is worth doing before committing. Most tools on this list offer one or the other, and the difference between how a tool looks in a demo and how it performs in your actual stack is always worth finding out before signing a contract.
FAQs
1. What is embedded analytics?
Embedded analytics is the integration of dashboards, reports, and data visualizations directly into a software product for end users, typically customers. Rather than directing users to a separate analytics tool, the analytics experience lives inside your product. This requires multi-tenancy to isolate each customer's data, white labeling so the experience matches your branding, and embedding methods that make dashboards feel native rather than bolted on.
2. Which GoodData alternative is cheapest for embedded analytics?
For a fully hosted solution with complete embedding support including white labeling and unlimited external viewers at a flat rate, Draxlr's Premium plan at $75 per month is the most affordable published price on this list. Metabase's open-source version is free to self-host, but it only supports static embedding with a "Powered by Metabase" watermark. Interactive embedding with white labeling requires the Pro plan at $575 per month, and every authenticated viewer counts as a paid user at $12 per month, which can make it significantly more expensive than it appears for customer-facing use cases.
3. How important is white labeling for embedded analytics?
For most SaaS products, white labeling is essential. Your customers are using your product and expect your branding throughout. Seeing a third-party vendor's logo or branding in an embedded dashboard undermines the experience. Confirm which plan tier includes white labeling for any tool you are evaluating, as several tools restrict it to higher-priced plans.
4. What is multi-tenancy in embedded analytics?
Multi-tenancy means a single platform deployment serves multiple distinct customer environments, each fully isolated from the others. Customer A cannot access or see Customer B's data. This isolation is enforced through row-level security at the data layer, ensuring filters are applied based on the authenticated user before any query result is returned. Multi-tenancy is a non-negotiable requirement for any SaaS product embedding analytics for multiple customers.
5. What embedding methods should I look for?
At minimum, look for iframe support and a JavaScript SDK. Better tools also offer React and Vue components that integrate natively into your frontend without iframe performance overhead. Native components load faster, respond better on mobile, and integrate more cleanly with your application's navigation and state management. Draxlr supports iframe, HTML, React JS, and Vue JS. Luzmo offers a full developer SDK alongside iframe. Looker, Sisense, and Power BI Embedded all offer SDK-based integration.
6. What are the best GoodData alternatives in 2026?
The best alternatives depend on your specific requirements. Draxlr is the strongest option for SaaS teams that want transparent pricing, fast deployment, and straightforward embedded analytics without enterprise overhead. Sisense is well regarded for performance on large datasets and publishes its pricing. Luzmo is built specifically for SaaS product embedding. Omni covers both internal BI and embedded analytics from a single semantic layer. Power BI Embedded is the natural fit for Microsoft-first organizations.
7. Which GoodData alternative is best for embedded analytics?
Draxlr and Luzmo are the most purpose-aligned tools for embedded analytics use cases. Draxlr offers transparent flat-rate pricing, unlimited external viewers, and a short deployment timeline. Luzmo is built from the ground up for SaaS product embedding with separate no-code and SDK tracks.
8. Which GoodData alternative is best for non-technical users?
Metabase and Draxlr are the most accessible for non-technical users. They both have a visual query builder and AI-powered natural language querying, letting internal users ask questions in plain English.
About the author

Ameena is the founder of Draxlr, a modern business intelligence platform focused on making data analysis simpler and faster. She writes about embedded analytics, databases, SQL, dashboards, and building scalable data products for modern teams.

