How to Add Analytics to a SaaS Product Without Building a Data Platform
A 3-year data platform build runs ~$5.65M vs ~$2.16M to buy (Holistics, 2026) — the read-replica, RLS, and caching architecture that skips the ETL build
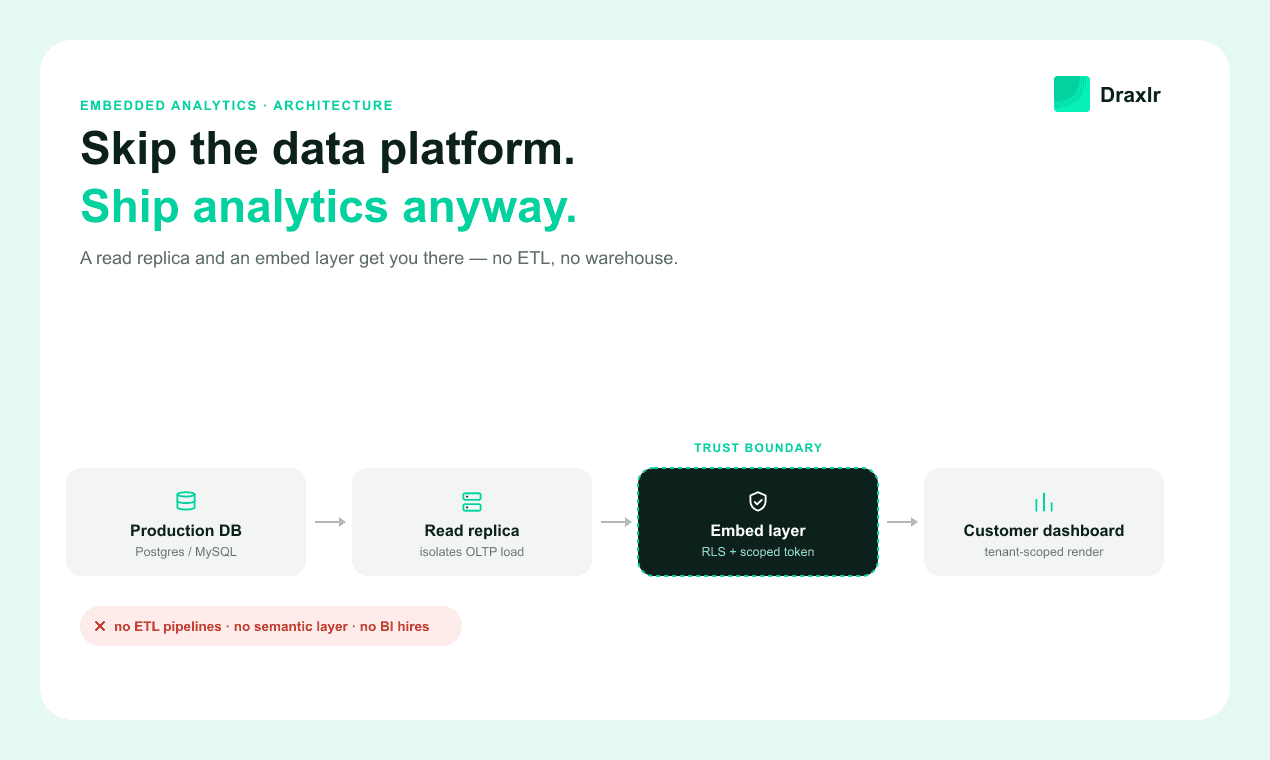
Someone on the roadmap call says "customers want to see their data" and, before anyone's checked the calendar, the plan has turned into an ETL pipeline, a warehouse, a semantic layer, and a hiring req for a data engineer. Most SaaS teams don't need any of that to ship a good analytics experience. They need a read replica, a tenant-scoped query layer, and a caching strategy — three things that fit inside a sprint, not a quarter.
This guide covers the architecture that gets customer-facing analytics into your product without standing up a data platform. That means querying your existing database directly instead of copying it somewhere else, isolating tenants without a platform team, and keeping queries fast without a warehouse. It also covers the point where that architecture stops working and a real data platform becomes the right call.
Key Takeaways
- One vendor-modeled TCO estimate puts a full in-house data platform build at roughly $5.65M over three years versus about $2.16M to buy, with a production-grade embedded module typically needing 6-12 months and two senior engineers to build from scratch (Holistics, 2026).
- In a self-reported vendor benchmark, enterprises spend an average of $2.2M a year just maintaining data pipelines, and 53% of engineering capacity at data-heavy orgs goes to pipeline upkeep instead of new features (Fivetran, 2026).
- You can serve most embedded dashboards by querying a read replica directly with row-level security for tenant isolation and a pre-aggregation layer for speed — no ETL pipeline required.
- 76% of organizations already use embedded analytics internally, and 84% of tech leaders expect their BI focus to grow in 2026 (Reveal/Infragistics, 2025), so this isn't a niche request — it's table stakes.
What Building a Data Platform Actually Involves
A data platform, in the full sense teams usually mean, is an ETL pipeline that copies your production data somewhere else, a warehouse to hold it, a semantic layer that defines what a "customer" or a "conversion" means consistently, and a BI tool on top. Someone also has to keep all four running.
According to a self-reported vendor benchmark, enterprises operating at that scale spend an average of $2.2 million a year just maintaining data pipelines. 53% of their engineering capacity goes to pipeline upkeep and troubleshooting instead of shipping new capability (Fivetran, Enterprise Data Infrastructure Benchmark Report, 2026).
That's not a cost most SaaS teams building a customer-facing analytics feature can justify. And, this is the part that gets missed, most of them don't need to pay it.
The ETL step exists to solve one specific problem: combining data from multiple disconnected source systems before you can query across them. If your customers only want to see their own data, and that data already lives in your product's database, you don't have a multi-source problem. You have a single-source query problem — a much smaller thing to build for.
The mistake most teams make is choosing their architecture based on what "real" analytics infrastructure looks like at a data-mature company, rather than on what their actual requirement is. A warehouse is the right tool when you're joining Salesforce, Stripe, and product-usage data into one report. It's the wrong tool when a customer just wants a chart of their own rows.
Can You Query Your Production Database Directly for Embedded Analytics?
Yes, for most SaaS analytics use cases you can query your production database directly — through a read replica, never the primary — and skip the copy-and-transform step entirely. A read replica keeps analytical query load off the database your application depends on for writes, without requiring you to move the data anywhere or maintain a transformation pipeline.
The pattern is deliberately boring:
Your app's primary database (writes)
  → streaming replication →
Read replica (analytics queries only)
  → embedded BI layer / query engine →
Customer-facing dashboard
Analytical queries — aggregations, date-range scans, group-bys — have a different access pattern than the transactional queries your application runs. They touch more rows and hold locks or buffer-pool space longer. Running them against the primary risks slowing down the writes your product depends on.
A dedicated read replica isolates that blast radius, so a slow dashboard query never becomes a slow checkout flow (Supabase, "When to use read replicas vs. bigger compute", 2025; AWS, "Working with read replicas" (Amazon RDS User Guide)).
This is also where a managed embedded-BI layer earns its keep even in a "no data platform" architecture. Tools like Metabase, Cube, and Draxlr connect directly to your existing replica — Postgres, MySQL, or otherwise. They handle query generation, charting, and the embed surface without asking you to move data into a warehouse first. See our comparison of embedded analytics tools if you're weighing options.
The point here is that you're buying the query and rendering layer, not a data pipeline. For a concrete walkthrough of wiring a replica up to an embed layer, see our guide to embedding a PostgreSQL dashboard.
Replication lag is the tradeoff to watch. Most managed Postgres and MySQL replicas run seconds behind the primary under normal load, which is fine for "today's revenue" dashboards and wrong for anything that needs to reflect a write from five seconds ago. If your dashboard needs same-transaction freshness, query the primary for that one view and accept the small, scoped risk — don't build a whole second pipeline to shave off replication lag for a single edge case.
How Do You Keep Tenant Data Isolated Without a Platform Team?
You isolate tenants by pushing the boundary into the database itself, with row-level security, rather than trusting every query your application (or a customer's embedded dashboard) generates to include the right WHERE tenant_id = ... clause. Application-layer filtering fails quietly — a missed filter in one endpoint doesn't throw an error, it just returns the wrong tenant's rows.
PostgreSQL Row-Level Security, available since version 9.5, attaches that filter to the table itself so it applies automatically, even to a query your embedded BI tool generates dynamically. Our RLS guide covers the full implementation: schema design, policy syntax, and the SET LOCAL pattern that keeps it safe behind a connection pool. The short version is that tenant context should come from a signed, short-lived token issued by your own backend — never from a parameter the browser can edit.
That token is also the piece that makes "no data platform" architecture defensible to a security review. A reviewer doesn't need to trust that every query your embedding tool writes is correct — they need to confirm that the database enforces the boundary regardless of what the query says. That's a much easier property to audit than "we checked every query path."
Keeping Query Performance Fast Without a Warehouse
You keep embedded dashboards fast by pre-aggregating and caching the handful of query shapes your dashboards actually repeat, not by copying the whole database somewhere faster. Most dashboards run the same few aggregations — daily totals, this-month-vs-last-month, top-N breakdowns — over and over for different tenants and date ranges. Computing that once and caching it beats re-scanning raw rows on every page load.
The gains are not subtle. Cube Dev's own benchmark on a roughly 10-million-row, 20-year PostgreSQL aggregate query showed the query drop from 6,514ms scanning raw rows to 5ms served from a pre-aggregated layer — a difference of roughly three orders of magnitude (Cube Dev, 2019; still cited in Cube's current docs as representative).
You don't need Cube specifically to get this benefit. A materialized view refreshed on a schedule, or a rollup table your embed layer queries instead of the raw events table, gets you most of the way there.
Latency matters more than it feels like it should. In a controlled study of exploratory data analysis, adding roughly 500ms of interaction latency measurably reduced how many observations and generalizations users made from the same dataset. The effect lingered even after latency returned to normal (Liu & Heer, IEEE TVCG, 2014).
The modern proxy for "fast enough" is Google's Interaction to Next Paint metric: under 200ms is good, 200-500ms needs improvement, and anything past 500ms at the 75th percentile is classified as poor (web.dev, Interaction to Next Paint, updated 2025). Treat 500ms as the ceiling for a dashboard interaction, not the target.
| Technique | What it solves | When to reach for it |
|---|---|---|
| Read replica | Isolates analytical load from OLTP writes | Always, before any embedded dashboard ships |
| Rollup / materialized view | Avoids re-scanning raw rows for repeated aggregations | Once a dashboard query takes over ~1-2 seconds |
| Query result cache | Skips recomputation for identical repeat requests | High-traffic dashboards with shared date ranges |
| Table partitioning | Lets the planner prune irrelevant data before scanning | Tables past tens of millions of rows |
Build vs. Buy: What Does Each Path Actually Cost?
Building a data platform in-house runs roughly $5.65M over three years against about $2.16M to buy, according to one vendor-modeled TCO estimate — treat the exact figure as directional, not an audited industry average (Holistics, "3-Year TCO Breakdown," 2026). A production-grade embedded module — multi-tenant isolation, white-label theming, SSO, a reasonable chart library — realistically takes 6-12 months with two senior engineers, versus 4-8 weeks to integrate a managed platform.
The shape of that gap, a multi-month build against a multi-week integration, matches what most teams report anecdotally, even if the dollar figure itself shouldn't be treated as gospel.
The number that doesn't show up in either estimate is opportunity cost. Two senior engineers spending eight months on a dashboard framework are eight months not spent on the product your customers are actually paying for. That's the real argument for buying, more than the sticker price: the build isn't just expensive, it's expensive in the currency of roadmap time you can't get back.
"Buy" doesn't mean one specific product. It spans a range: fully managed embedded-BI platforms that handle the query layer, charting, and token-based embedding for you, and lighter query-and-chart libraries you wire into an interface you already own. Which one fits depends on how much of the surface — auth, theming, chart interactivity — you want to own yourself versus hand off.
When Do You Actually Need a Real Data Platform?
You need a real data platform once you're joining data across systems that don't share a single source of truth — combining product usage with Stripe billing and a support tool, for instance. The other trigger is retention or ML requirements that demand a durable, versioned copy of history, decoupled from your operational database's schema.
A few concrete thresholds worth watching for:
- Multi-source joins. The moment "show me my data" becomes "show me my data next to my Salesforce data," you have a genuine ETL problem — no read replica solves cross-system joins.
- History longer than your OLTP retention. If dashboards need years of history your production database doesn't (and shouldn't) retain, you need a place to park that history that isn't your live transactional schema.
- Feature stores or ML pipelines. Training data and serving data have different freshness and shape requirements than a dashboard query. That's a platform problem, not an embedding problem.
- Dozens of downstream consumers. A warehouse pays for itself once multiple internal teams and external dashboards all need the same governed, semantically-consistent numbers. Below that, you're often duplicating the same rollup logic that already exists in your application.
None of these are analytics problems in the sense this article is solving — they're data-integration problems that happen to feed analytics. If your actual requirement is "let each customer see their own data from our product," the architecture in the sections above covers it without any of the four triggers above being true.
Frequently Asked Questions
Do I need a data warehouse to embed a dashboard in my SaaS product?
No, not if the dashboard only shows data that already lives in your product's own database. A read replica, row-level security for tenant isolation, and a rollup table or cache for the repeated aggregations cover most embedded-analytics use cases. A warehouse becomes necessary when you're joining data from multiple external systems, not for querying your own data back to your own customers.
How much does it cost to build embedded analytics in-house versus buying it?
One vendor-modeled estimate puts a 3-year in-house build at roughly $5.65M against about $2.16M to buy, with the build taking 6-12 months versus 4-8 weeks to integrate a managed platform (Holistics, 2026). Treat the dollar figure as directional — the consistent finding across teams that have done both is that the build takes months longer than expected, largely due to multi-tenant isolation and embedding-security work that's easy to underestimate upfront.
Will running analytics queries on a read replica slow down my main database?
Not if the replica is genuinely separate compute serving read traffic only. The risk you're managing is replication lag, not load. Under normal conditions, most managed Postgres and MySQL replicas run a few seconds behind the primary — acceptable for most dashboards, and only a problem for views that need same-transaction freshness.
What's the fastest way to add customer-facing analytics without a big engineering project?
Point a managed embedded-BI tool at a read replica of your existing database, put row-level security or an equivalent tenant filter in front of it, and ship a rollup table for your most common aggregation once query latency becomes noticeable. That path typically ships in weeks, not months, because none of it requires building or maintaining a data pipeline.
Conclusion
Most SaaS teams reach for a data platform because that's what "real" analytics infrastructure is supposed to look like, not because their actual requirement demands one. If customers only need to see their own data, a read replica, row-level security, and a caching layer solve it — in weeks, not the 6-12 months a full in-house build tends to run.
Save the ETL pipeline and the warehouse for the problem they actually solve: combining data across systems that don't share a database. Until you're there, the fastest path to a good embedded analytics experience is the one that skips building a platform entirely.
About the author

Vivek is a coder and the founder of Draxlr who cares deeply about building good products. He works at the intersection of AI, SQL, dashboards, and embedded analytics, with a strong focus on making complex data workflows feel simple, useful, and fast for real teams.
If you have questions about anything in this guide, or want to compare options for your specific stack, you can email Vivek at vivek@draxlr.com, try Draxlr free, or reach out directly through the Draxlr team.