7 Best Tableau Alternatives in 2026
Compare 7 Tableau alternatives in 2026 - Draxlr, Power BI, Qlik, Data Studio, Domo, Sisense, and Oracle Analytics - with verified 2026 pricing, drawbacks, and a real 20-seat cost comparison.
Short answer: if Tableau is too expensive or too heavy for your team, the best alternative depends on one thing - who actually builds the dashboards. Draxlr fits startups and SaaS teams who want SQL dashboards, AI-assisted queries, and embedding at a flat price. Power BI fits Microsoft shops. Data Studio (formerly Looker Studio) fits marketing reporting on Google data. Qlik, Sisense, Domo, and Oracle Analytics fit larger, governed enterprise deployments.
Tableau is still one of the strongest visualization products on the market. The reason teams leave it is rarely the charts - it is the seat math, the authoring learning curve, and what happens to the bill when analytics has to reach people outside the analytics team.
This guide compares seven Tableau alternatives with pricing verified against each vendor's own pricing page in September 2026, the drawbacks buyers actually report, and a side-by-side cost model for a 20-person team.
Why teams look for Tableau alternatives in 2026
Three things changed since this guide was first published.
1. Tableau's seat pricing punishes wide rollouts. Tableau Cloud is sold in three roles, billed annually:
| Role | Tableau Cloud Standard | Tableau Cloud Enterprise |
|---|---|---|
| Creator (builds content) | $75 / user / month | $115 / user / month |
| Explorer (edits existing content) | $42 / user / month | $70 / user / month |
| Viewer (read only) | $15 / user / month | $35 / user / month |
Every person who only needs to look at a dashboard still costs money, every month, forever. That is the number that pushes most teams to start comparing.
2. AI features sit behind a separate commitment. Tableau's newer agentic capabilities - Tableau Next, Tableau Semantics, and the Agentforce analytics agents - are packaged in the Tableau+ bundle, which is priced per organisation through a Salesforce account team rather than published on the pricing page. Consumption-based credits stack on top of the seat licences, so the AI story is not something you can cost out from the website.
3. The alternatives moved. Power BI raised list prices in April 2025 (Pro went from $10 to $14, Premium Per User from $20 to $24). Qlik replaced per-seat pricing with capacity-based plans that include unlimited users. And in April 2026 Google renamed Looker Studio back to Data Studio, which is why half the comparison articles you will read this year use the wrong product name.
Tableau alternatives at a glance
| Tool | Best for | Billing model | Entry price | Embedding |
|---|---|---|---|---|
| Draxlr | Startups and SaaS teams on SQL databases | Flat monthly, seats included | $25 / month | Yes, white-label from $75 |
| Power BI | Microsoft 365 and Azure shops | Per user, or Fabric capacity | $14 / user / month | Yes, capacity required |
| Qlik Cloud | Governed analytics for large user bases | Capacity (GB of data), unlimited users | $300 / month | Yes |
| Data Studio (ex Looker Studio) | Marketing reporting on Google data | Free, or per user per project | Free | Yes, via public embed |
| Domo | Enterprises consolidating many data sources | Seats plus consumption credits | Quote only | Yes |
| Sisense | Large-scale embedded analytics | Quote only | Quote only | Yes, core strength |
| Oracle Analytics Cloud | Oracle database and ERP estates | Per user or per OCPU hour | $16 / user / month | Limited |
Here is a quick video walkthrough of these alternatives:
1. Draxlr
Best for: startups, SaaS products, and internal teams that run on a SQL database and do not have a dedicated analytics team.
Draxlr is a no-code BI tool that connects directly to your production or replica database - PostgreSQL, MySQL, MS SQL, BigQuery, Snowflake, Redshift, ClickHouse, Databricks, Supabase, Neon, PlanetScale, and more - and turns it into dashboards without a warehouse project in front of it.
The difference from Tableau is the shape of the work. Tableau assumes a modelled data source and a trained author. Draxlr assumes a database, a question, and someone who wants the chart today. A visual query builder handles filters, joins, grouping, and summaries without SQL, and the AI assistant writes the SQL when a question is easier to type than to click.
Connect your Database
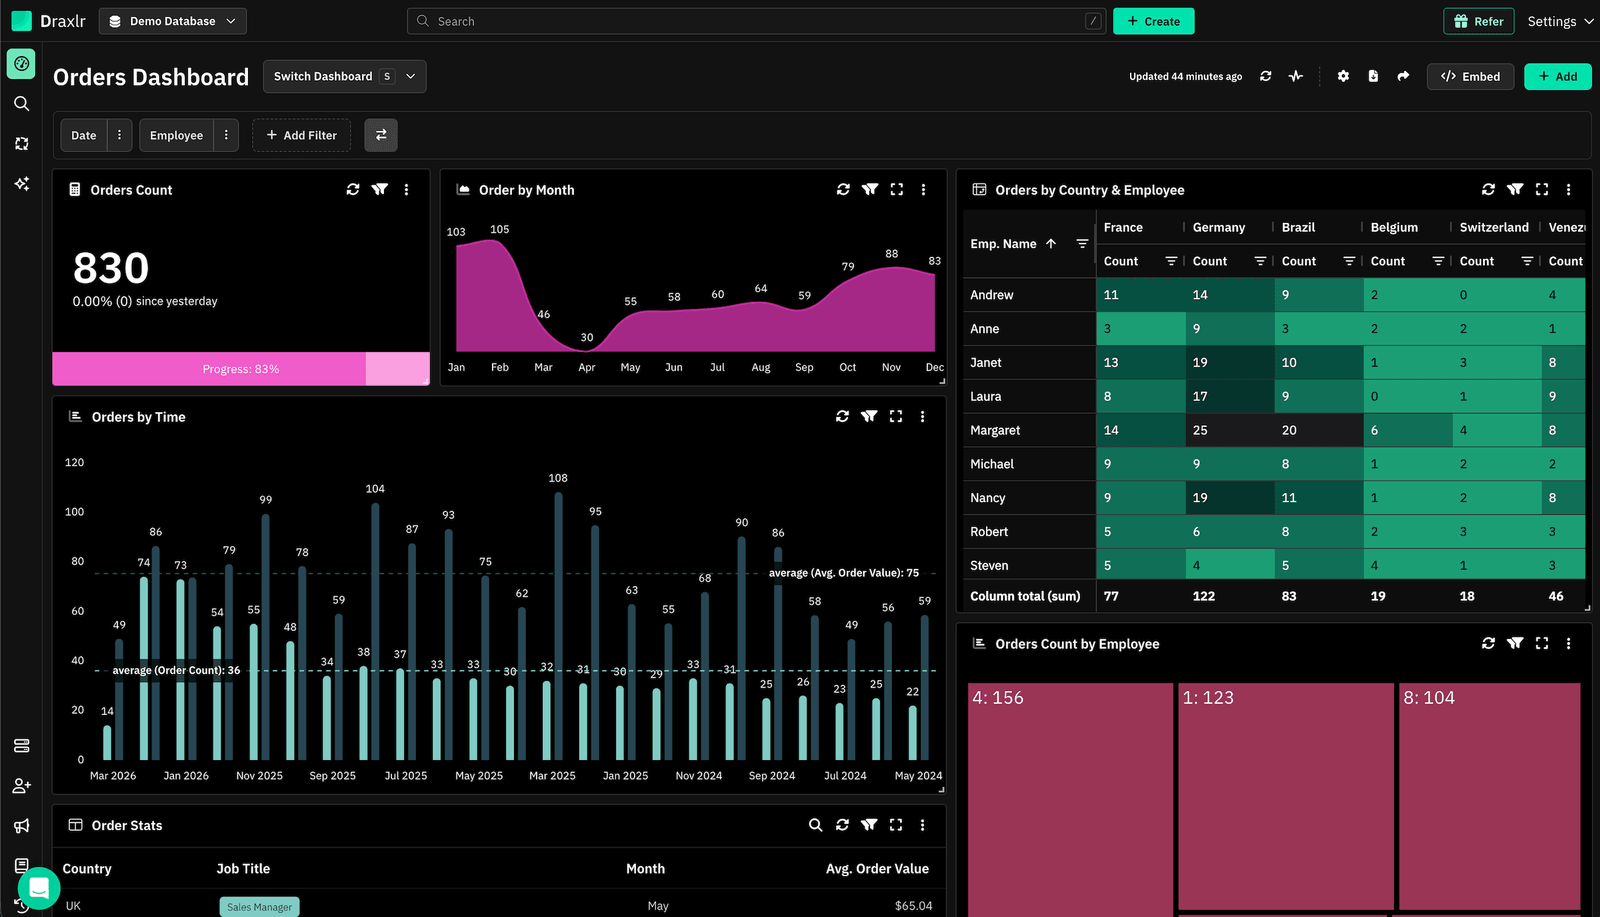
Key Features
- Visual query builder so non-technical users can filter, sort, join, group, and summarise data without writing SQL.
- AI SQL generation that turns a plain-English question into a query you can then open and edit in the query builder.
- MCP server that lets AI assistants like Claude query your databases and build dashboards through the Model Context Protocol - included on every paid plan.
- White-label embedding with customer context, so each of your customers sees only their own data inside your product.
- Alerts and automations: Slack and email notifications when a metric crosses a threshold, plus daily dashboard summaries by email.
- Drill-down from a chart into the underlying rows.
- Live mode dashboards that refresh on an interval for wall displays and NOC screens.
- REST APIs to pull query results into any other system, plus Google Sheets sync.
- Self-hosting on the Enterprise plan for teams with data residency or private network requirements.
- Unlimited external viewers on every plan - people who view an embedded or shared dashboard never count as billable seats.
Major Drawbacks
- Built for SQL databases and warehouses. If your data lives in spreadsheets, SaaS APIs, or files, you need to load it into a database first.
- Fewer chart types and less pixel-level formatting control than Tableau. It is built for operational dashboards, not for presentation-grade data storytelling.
- Smaller community and third-party ecosystem than Tableau or Power BI.
- No on-premise option below the Enterprise plan.
How to build dashboards from a SQL database in minutes with Draxlr:
Pricing
Flat monthly pricing with seats included. Annual billing saves roughly a third.
| Plan | Price | What is included |
|---|---|---|
| Lite | $25 / month ($200 / year) |
1 database, 1 user, 50 AI credits, MCP, unlimited external viewers. |
| Premium | $75 / month ($600 / year) |
2 databases, 10 users, 100 AI credits, white-label embedding. |
| Power | $125 / month ($960 / year) |
5 databases, 30 users, 300 AI credits, white-label embedding. |
| Enterprise | $500 / month ($3,800 / year) |
Custom databases and users, dedicated server or self-hosting, SSO, audit logs, custom AI models. |
See the full breakdown on the Draxlr pricing page.
2. Power BI
Best for: organisations already standardised on Microsoft 365, Azure, and Excel.
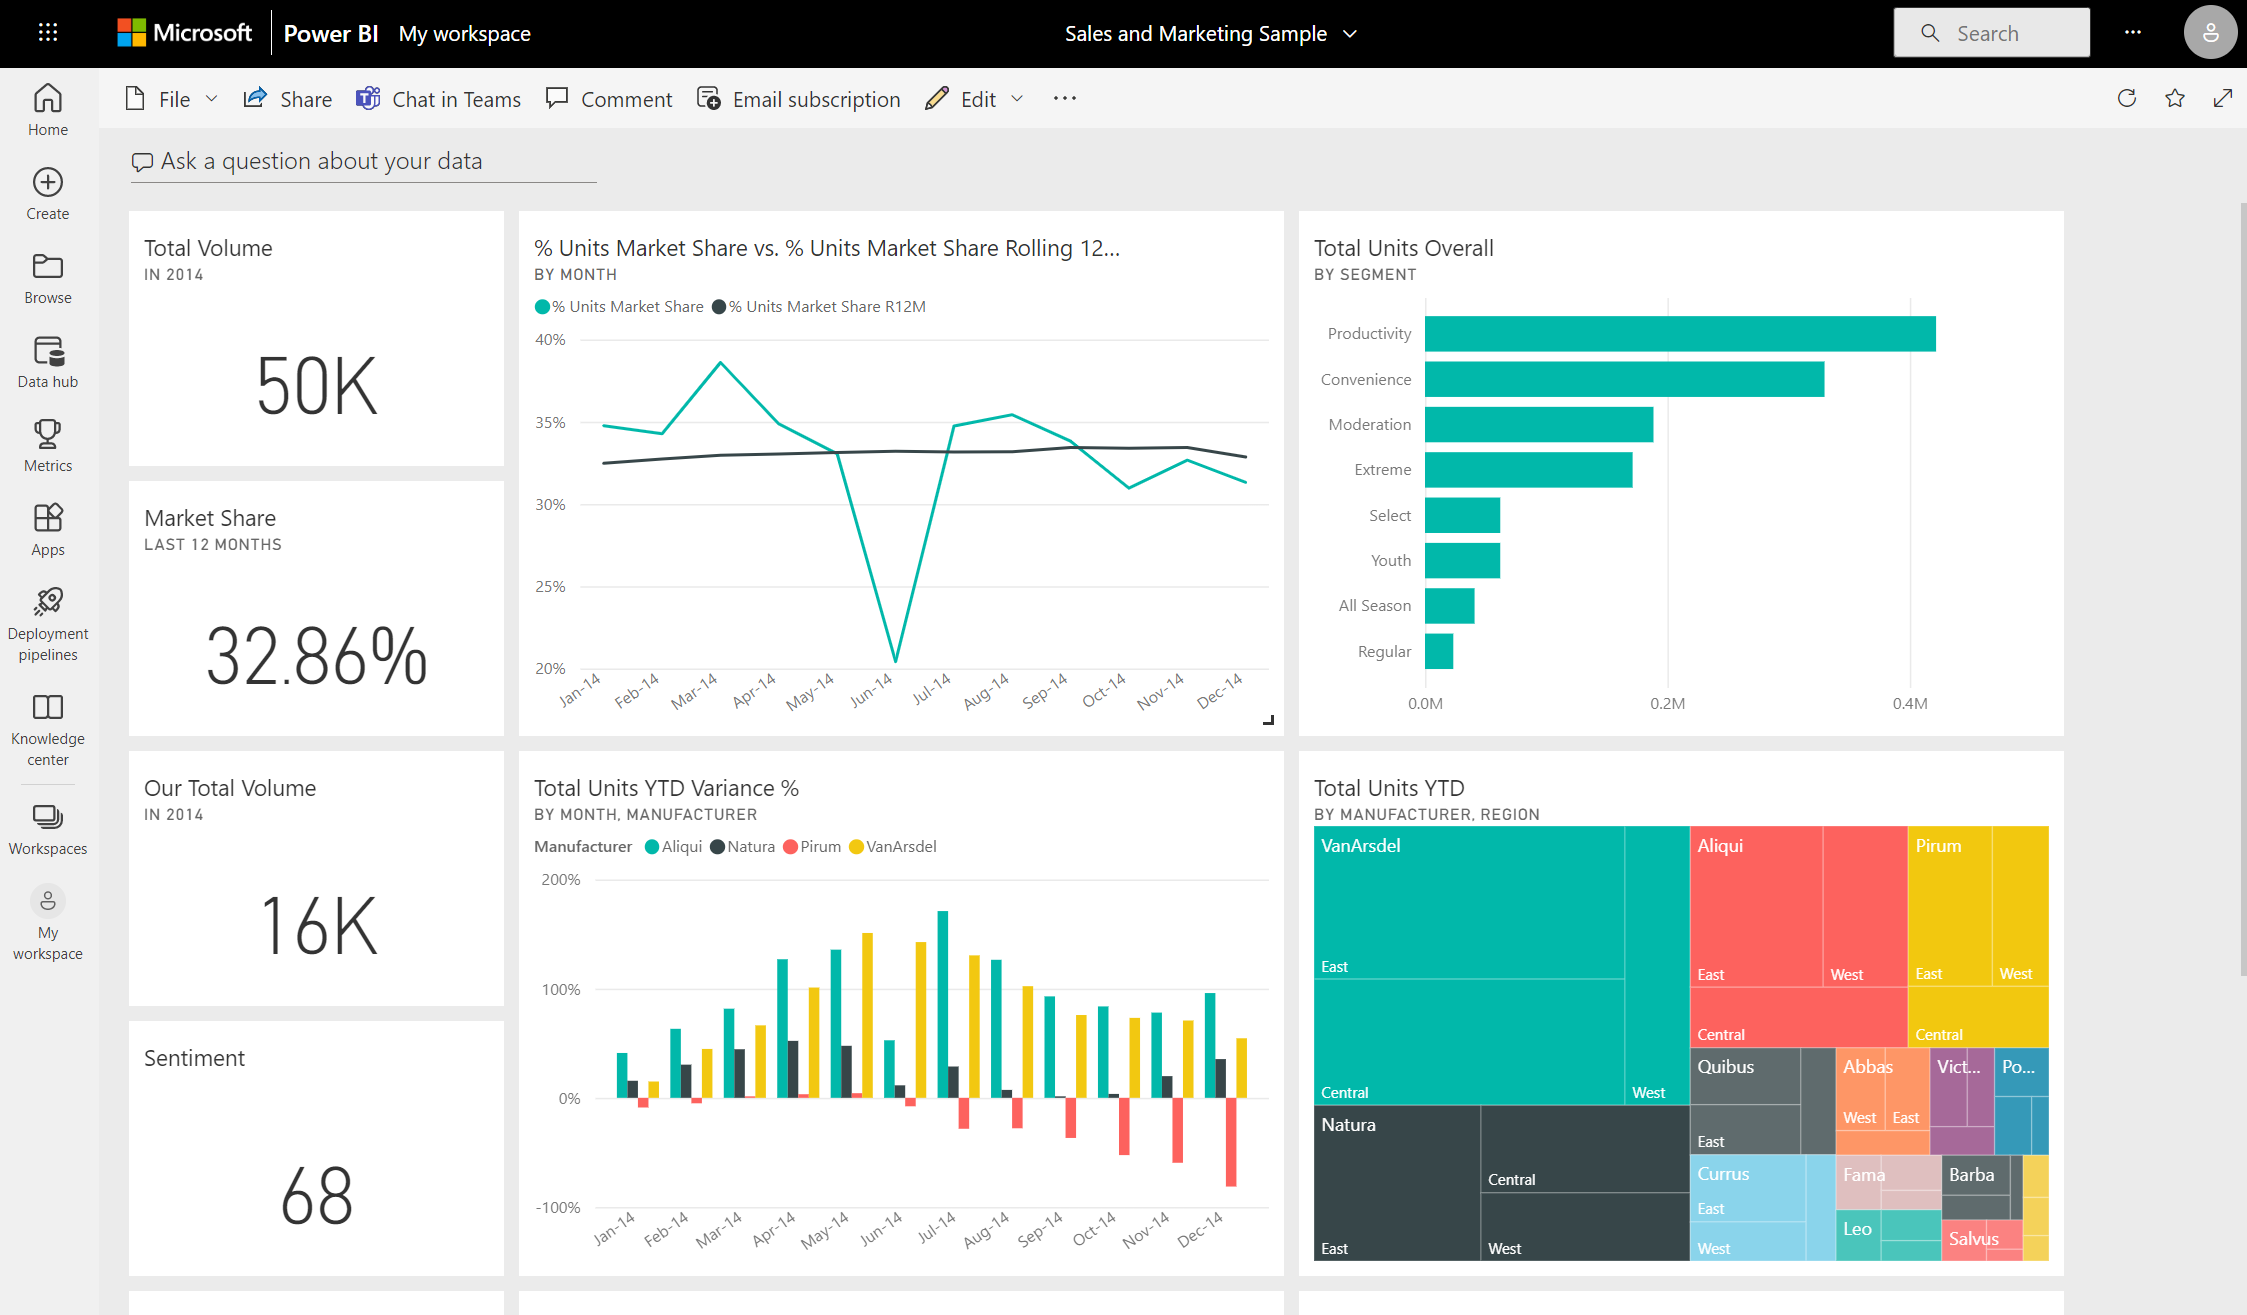
Microsoft Power BI is the closest like-for-like replacement for Tableau. It covers the same ground - modelled datasets, interactive reports, scheduled refresh, row-level security - at a fraction of the per-seat price, and the authoring tool (Power BI Desktop) is free.
The trade-off is that Power BI is genuinely a platform, not an app. Getting real value out of it means learning DAX, understanding the semantic model, and, above a certain size, buying Fabric capacity.
Key Features
- Over 100 native data connectors, including deep integration with Azure SQL, Synapse, and Microsoft Fabric.
- Copilot for generating DAX measures and summarising reports, plus Q&A for conversational querying.
- More than 60 built-in visuals, plus a marketplace of custom visuals.
- Strong data modelling with relationships, calculated tables, and incremental refresh.
- Row-level security that maps to Entra ID groups, which makes governed rollouts straightforward in a Microsoft estate.
- Mobile apps for iOS and Android with reasonable report fidelity.
- Included at no extra cost with Microsoft 365 E5 and Office 365 E5 annual subscriptions.
Major Drawbacks
- DAX is the wall. It looks like Excel and behaves nothing like it. Most teams underestimate the training cost.
- Performance degrades on large models unless you move to Premium Per User or Fabric capacity, which changes the cost conversation entirely.
- Error messages are famously unhelpful, and support quality varies by contract tier.
- Embedding into a customer-facing product requires Power BI Embedded or Fabric capacity, not just Pro seats.
- Power BI Desktop is Windows only. Mac authors need a VM.
Pricing
- Power BI Desktop: free
- Power BI Pro: $14 per user per month, paid yearly
- Power BI Premium Per User: $24 per user per month, paid yearly
- Microsoft Fabric capacity (F-SKUs): consumption-based, pay-as-you-go or reserved. Power BI Premium P-SKUs are no longer sold to new customers.
If Power BI is on your shortlist, we have a dedicated comparison here: Power BI alternatives in 2026.
3. Qlik Sense / Qlik Cloud
Best for: enterprises that need governed analytics across a large, mostly read-only audience.
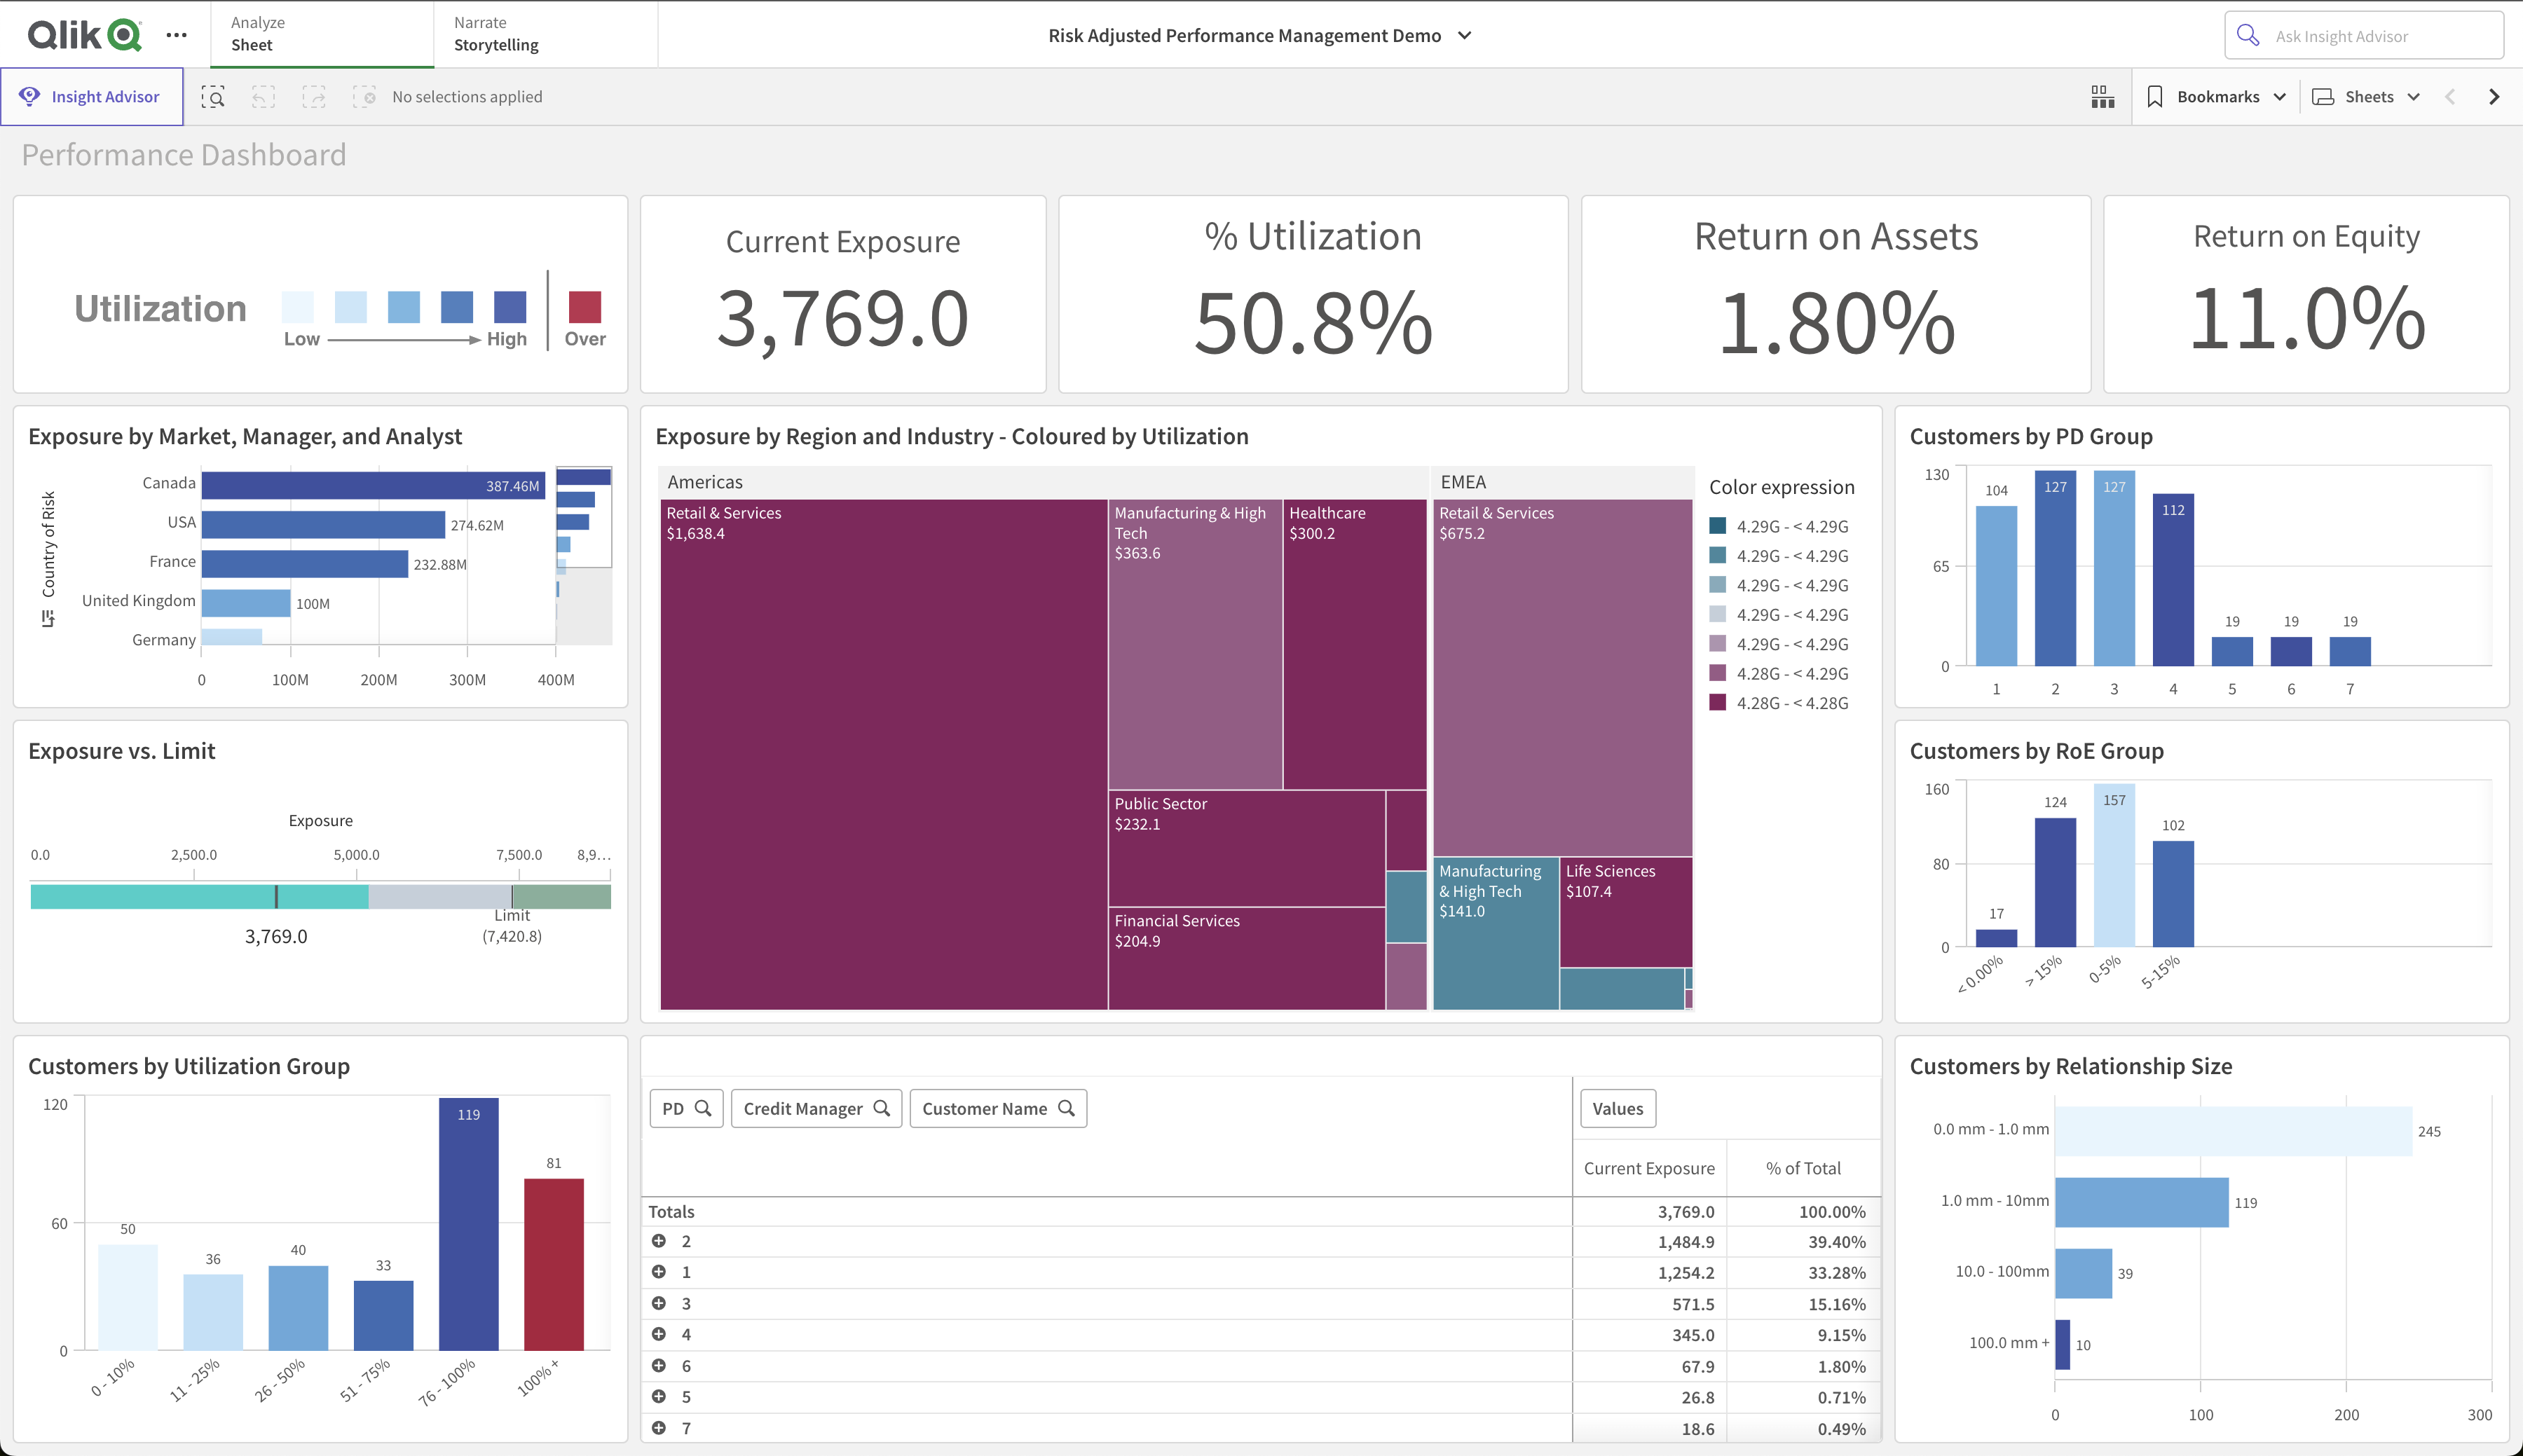
Qlik remains the strongest associative analytics engine on the market. Instead of pre-defining drill paths, Qlik's in-memory engine indexes relationships across every field, so users can select any value and immediately see what is related - and, crucially, what is not related. For exploratory analysis on messy, multi-source data, nothing else quite does this. If governance and data preparation matter as much to you as the charts, it is worth comparing Qlik against the wider data management platform market before committing.
The bigger story in 2026 is the pricing model. Qlik Cloud Analytics is now sold on capacity, measured in GB of "data for analysis", with unlimited users above the Starter tier. That inverts Tableau's economics: adding people is free, adding data is what costs.
Key Features
- Associative engine that surfaces unrelated and excluded values, not just filtered subsets.
- Insight Advisor generates charts and suggests relationships automatically.
- Strong ETL built in through Qlik data load scripts, plus Qlik Talend for heavier pipelines.
- Unlimited users on Standard and above, which makes company-wide rollouts predictable.
- Predictive analytics and AutoML on the Premium tier.
- Multi-node deployment, granular security rules, and mature governance for regulated industries.
- Qlik Application Automation for triggering workflows off data conditions.
Major Drawbacks
- The associative model is powerful but unfamiliar. Expect real training time for authors, and scripting knowledge for anything non-trivial.
- Entry price is high. $300 per month is the floor, and that tier caps at 10 users and 10 GB.
- Capacity pricing is a trap if your data volume is large relative to your headcount. A 5-person team on 100 GB pays more than a 200-person team on 25 GB.
- Default themes look dated, and visual customisation is more limited than Tableau.
- Integration with Microsoft sources is workable but not seamless.
Pricing
Qlik Cloud Analytics, billed annually:
- Starter: $300 / month - 10 users, 10 GB data for analysis
- Standard: $825 / month - unlimited users, 25 GB
- Premium: $2,750 / month - unlimited users, 50 GB, adds AutoML and predictive analytics
- Enterprise: custom quote - 250 GB and up
More detail in our Qlik alternatives guide.
4. Data Studio (formerly Looker Studio)
Best for: marketing and web reporting built on Google Analytics, Google Ads, Search Console, and BigQuery.
Data Studio is the free option on this list, and for a large set of reporting jobs it is genuinely enough. Google renamed it back from Looker Studio to Data Studio in April 2026, reversing the 2022 rebrand - the product and URLs are unchanged, only the name moved.
Note that Data Studio is a different product from Looker, Google's enterprise modelling platform built on LookML. If someone quotes you a five-figure "Looker" price, they are talking about the other one.
Key Features
- Free for unlimited reports and unlimited viewers, with no seat cost at all.
- Native connectors to Google Analytics 4, Google Ads, Search Console, YouTube, Sheets, and BigQuery.
- Hundreds of partner connectors for non-Google sources, most of them paid subscriptions.
- Drag-and-drop report building with a shallow learning curve.
- Google Docs-style sharing and real-time collaborative editing.
- Scheduled email delivery of reports.
- Public embed via iframe, with no extra licence.
Major Drawbacks
- Performance falls apart on large data. Reports that query millions of rows are slow, and the caching controls are blunt.
- Data blending is limited to a handful of sources with restrictive join rules. Anything complex has to be modelled in BigQuery first.
- No real data modelling layer, no version control, and no governed metric definitions.
- Error messages are often opaque numeric codes, which makes debugging connector failures painful.
- Third-party connectors are a hidden recurring cost, and BigQuery query charges are yours regardless of tier.
- Pro adds support and admin controls but changes nothing about speed or connectors.
Pricing
- Data Studio: free
- Data Studio Pro: $9 per user per month, billed per Google Cloud project - so a user working across three projects needs three licences
For the enterprise sibling, see Looker alternatives in 2026.
5. Domo
Best for: larger organisations consolidating dozens of disconnected data sources into one governed platform.
Domo is a fully cloud-hosted BI platform that bundles the warehouse, the pipeline tooling, and the dashboards in one place. Its headline strength is breadth of connectivity - over 1,000 connectors - which makes it attractive to companies whose data is scattered across a long tail of SaaS tools.
Key Features
- More than 1,000 prebuilt connectors, well beyond what most competitors ship.
- Magic ETL: a visual, no-code transformation builder that non-engineers can actually use.
- Data lineage views that show which cards break when an upstream dataset changes.
- Wide visualisation library plus custom D3 charts through Domo Bricks.
- Writeback support through webforms and workbench, so Domo can capture input as well as report on it.
- Jupyter workspace integration for Python and R work against Domo datasets.
- Doc cards and app studio for wrapping dashboards in business context.
Major Drawbacks
- Consumption credits make budgeting hard. Ingestion, transforms, refreshes, and AI queries all draw down a prepaid credit pool, so cost tracks usage rather than headcount.
- Schema changes are disruptive. Renaming a column can break downstream cards with little warning.
- No mass editing - applying the same change to many cards or dashboards means doing it one at a time.
- Support quality is a recurring complaint, with a push toward paid premium support tiers.
- Steep floor. Buyer-reported minimum viable deployments start around $30,000 per year, and mid-market contracts commonly land in six figures.
Pricing
Domo does not publish list prices. Pricing combines per-user licences with consumption credits, and is quoted per deployment. Independent buyer data puts the median contract in the high five figures annually, with a practical entry point well above most tools on this list.
We cover the landscape in detail in our Domo alternatives guide.
6. Sisense
Best for: software companies embedding analytics into a product at scale.
Sisense is less a dashboard tool than an analytics engine you build on. Its Elasticube modelling layer and query engine were designed for embedding, and the API surface is deep enough that most of the product can be driven programmatically. If you are shipping analytics to thousands of end customers, Sisense belongs on the list.

Key Features
- Elasticube in-memory modelling layer that handles joins across large, heterogeneous sources.
- Purpose-built embedding: iframe, SDK, and headless API options with full white-labelling.
- BloX widget framework for building interactive, action-driven cards.
- AI-assisted exploration, natural language querying, and forecasting.
- Multi-tenant architecture designed for customer-facing deployments.
- Broad connector library and solid REST API coverage for automation.
Major Drawbacks
- No public pricing, and the real number is large. Buyer reports put cloud deployments in the low five figures for a handful of users, and embedded deployments well into six figures. Professional services minimums are common on first deployment.
- BloX customisation requires HTML, CSS, and JavaScript. It is a developer feature wearing a no-code label.
- Support is the most consistent complaint in public reviews.
- Renewal increases in the 10-15% range are frequently reported.
- Overkill for internal-only dashboards. The engineering-heavy design only pays off when you are embedding.
Pricing
Custom quote only. If you are pricing embedded analytics specifically, our embedded analytics cost guide breaks down how the models differ, and our Sisense alternatives guide covers the direct competitors.
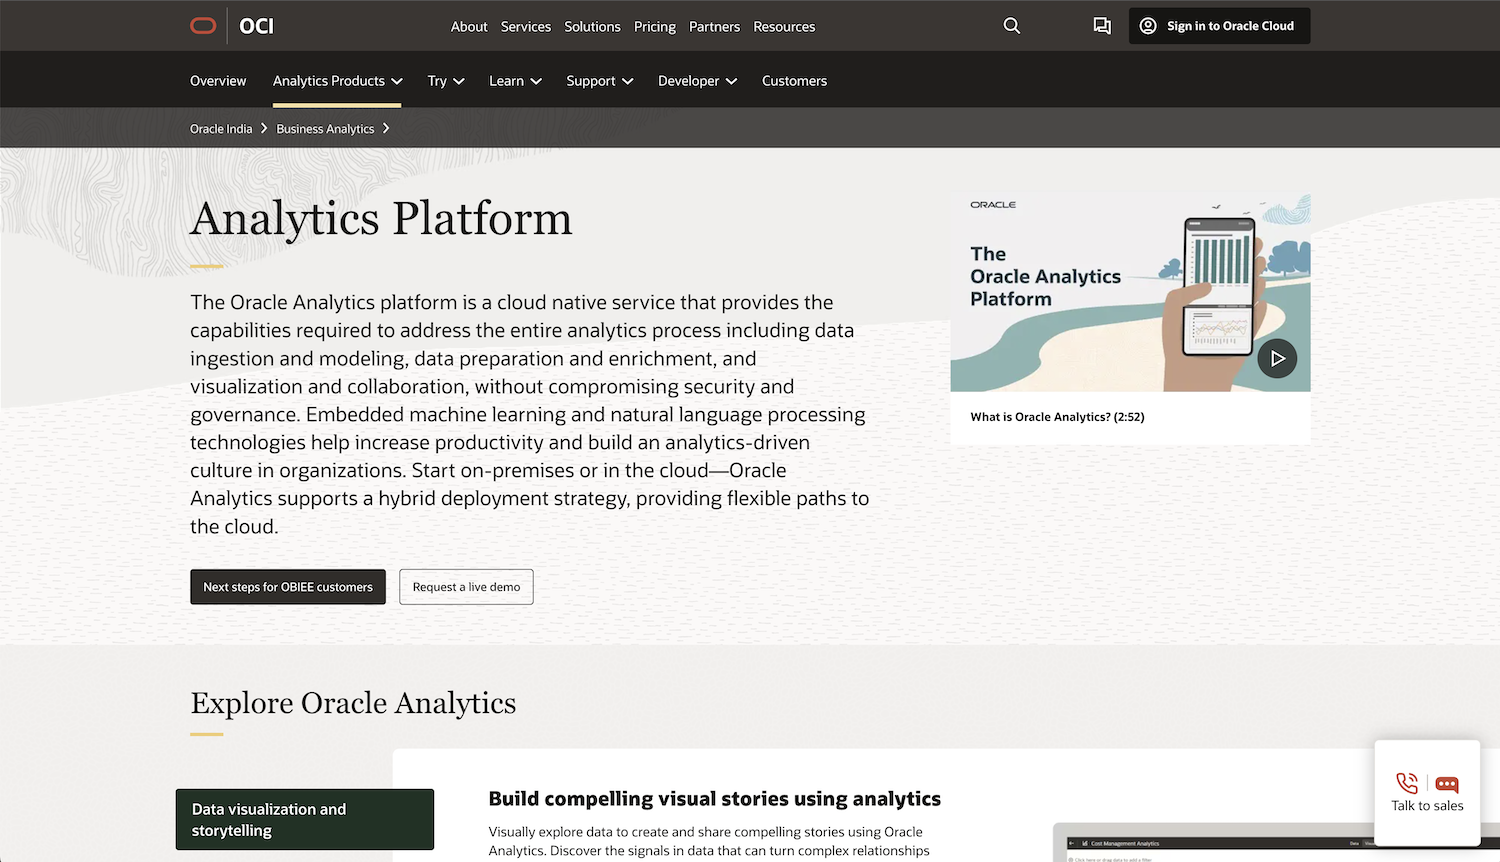
7. Oracle Analytics Cloud
Best for: organisations whose systems of record are Oracle Database, Fusion Apps, NetSuite, or E-Business Suite.
Oracle Analytics Cloud (OAC) is the natural choice in an Oracle estate and a difficult one to justify anywhere else. Where it earns its place is in the depth of its integration with Oracle's own applications - prebuilt subject areas, semantic models, and security that map to Oracle Fusion roles out of the box.
Key Features
- Deep native integration with Oracle Database, Autonomous Data Warehouse, Fusion Applications, and NetSuite.
- Built-in machine learning and predictive models, including "explain" for automatic driver analysis.
- Self-service data preparation with automatic enrichment recommendations.
- A semantic modelling layer inherited from OBIEE, which is genuinely enterprise-grade.
- Deployment flexibility: per-user subscriptions, per-OCPU capacity, or bring-your-own-licence from an existing OBIEE estate.
- Mobile access and natural language querying.
Major Drawbacks
- Weak outside the Oracle ecosystem. Third-party connectivity is workable but clearly second-class.
- Setup and configuration are complex, and OCPU sizing is not intuitive for teams without Oracle infrastructure experience.
- Query performance degrades on live connections, and row limits apply to some report types.
- Out-of-the-box visuals feel a generation behind Tableau and Power BI.
- Support responsiveness and stability are common complaints, including on high-severity tickets.
- Licensing is complicated by the BYOL and OCPU options, and total cost is hard to predict before a sizing exercise.
Pricing
- Professional: $16 per user per month
- Enterprise: $80 per user per month
- Professional or Enterprise, BYOL: $0.3226 per OCPU per hour
- Oracle Analytics Server for OCI: $1.75 per OCPU per hour
Per-user pricing is sold on an annual commitment with minimum user counts, so the effective floor is higher than the headline rate.
What a 20-person team actually pays
List prices per seat are hard to compare across different billing models, so here is the same team costed against each tool: 3 people who build dashboards and 17 people who only read them, at annual-billing list prices.
| Tool and plan | How it is billed | Estimated annual cost |
|---|---|---|
| Data Studio (free) | Free, unlimited users | $0 (plus BigQuery and connector costs) |
| Draxlr Power | Flat, 30 users included | $960 |
| Data Studio Pro | 20 x $9 / month, single project | $2,160 |
| Power BI Pro | 20 x $14 / month | $3,360 |
| Oracle Analytics Cloud Professional | 20 x $16 / month, plus infrastructure | $3,840+ |
| Tableau Cloud Standard | 3 Creators + 17 Viewers | $5,760 |
| Qlik Cloud Standard | Capacity, unlimited users, 25 GB | $9,900 |
| Tableau Cloud Enterprise | 3 Creators + 17 Viewers | $11,280 |
| Domo / Sisense | Quote only | Five figures and up |
Two things to read out of this.
First, the shape of the bill matters more than the sticker price. Seat-based tools (Tableau, Power BI, Oracle) get more expensive every time analytics reaches one more person - which is the opposite of what you want if the goal is a data-informed company. Capacity tools (Qlik) and flat-rate tools (Draxlr) get cheaper per person as you grow.
Second, none of these numbers include the work. Tableau, Qlik, Domo, and Sisense all assume a modelled data layer and a person who knows how to build it. If you do not already have that person, add their time to every line in the table.
How to choose
Work through these in order:
- Do you have a data team? If yes, Tableau, Power BI, and Qlik are all defensible. If no, pick a tool that queries your database directly - Draxlr or Data Studio - rather than one that assumes a warehouse project first.
- Where does your data live? Microsoft estate to Power BI. Google marketing stack to Data Studio. Oracle estate to OAC. A regular SQL database or warehouse to Draxlr. Fifty scattered SaaS tools to Domo.
- Who reads the dashboards? If the audience is wider than the authors, avoid per-viewer pricing. That single decision is what most Tableau migrations actually turn on.
- Are you embedding into a product? Then the question is white-labelling, multi-tenancy, and how end users are counted. Sisense and Draxlr are built for this; Tableau and Power BI need separate embedded licensing. See our embedded analytics tools comparison.
- How much visual control do you need? If your output is board-level, presentation-grade data storytelling, Tableau is still the best tool for the job and worth its price. If your output is operational dashboards people check on a Tuesday morning, you are overpaying.
Other tools worth a look
These did not make the list of seven, but they come up often in the same evaluations:
- Metabase - open-source, popular with engineering teams, though interactive embedding is expensive.
- Apache Superset - free and open source if you are willing to run and maintain it yourself.
- Sigma - spreadsheet-style analytics on top of a cloud warehouse.
- ThoughtSpot - search-first analytics, strong natural language querying.
- Grafana - the default for time-series and infrastructure monitoring.
If you want a broader view of where AI fits into all of this, see our roundup of AI-powered BI tools.
Conclusion
Tableau is not a bad product, and "Tableau is expensive" is not a good enough reason on its own to migrate. The better question is whether you are paying for capabilities you use.
If you employ analysts who build modelled, presentation-grade dashboards for a business that depends on them, Tableau's price is defensible. If your reality is a handful of people who need to see live numbers from a SQL database, and a long list of colleagues who just need to read them, per-viewer seat pricing is charging you for a workflow you do not have.
For that second case - startups, SaaS teams, and lean data teams - Draxlr connects to your database in minutes, includes seats in a flat price, never charges for external viewers, and supports white-label embedding from $75 a month. There is a free trial if you want to check it against your own data before deciding.
Try Draxlr freeFAQs
What is the best Tableau alternative in 2026?
It depends on your stack and your team. Draxlr is the best fit for startups and SaaS teams running on a SQL database who want flat pricing and embedding. Power BI is the best fit for Microsoft-centric organisations. Qlik suits large governed deployments, and Data Studio is the best free option for Google marketing data.
Is there a free alternative to Tableau?
Yes. Data Studio (formerly Looker Studio) is free for unlimited reports and viewers, and Apache Superset is free and open source if you can self-host it. Power BI Desktop is also free, but sharing reports requires a paid Pro licence. Tableau itself has no open-source edition - only the free, public-by-default Tableau Public - which this breakdown of Tableau and open source covers in more detail.
How much does Tableau cost in 2026?
Tableau Cloud Standard is $75 per Creator, $42 per Explorer, and $15 per Viewer, per month, billed annually. Tableau Cloud Enterprise is $115, $70, and $35 respectively. Tableau+, which bundles Tableau Next and the Agentforce analytics agents, is priced separately through a Salesforce account team.
What is the cheapest Tableau alternative?
For a 20-person team, Data Studio is free and Draxlr's Power plan is $960 a year for up to 30 users. Both come in well below Tableau Cloud Standard, which costs roughly $5,760 a year for the same mix of three authors and seventeen viewers.
Why did Looker Studio change its name to Data Studio?
Google reverted the name in April 2026, undoing the 2022 rebrand from Google Data Studio to Looker Studio. The product, features, and URLs are unchanged. The rename separates it more clearly from Looker, which is Google's enterprise modelling platform and a different product entirely.
Which Tableau alternative is best for embedded analytics?
Sisense for large-scale, customer-facing deployments with heavy engineering resources, and Draxlr for SaaS teams who want white-label dashboards with per-customer context without a dedicated integration project. Tableau and Power BI both require separate embedded licensing on top of user seats.
Is Power BI better than Tableau?
Power BI is cheaper per seat and easier to justify inside a Microsoft estate. Tableau handles large datasets better and offers finer visual control. The practical difference is DAX: Power BI's calculation language is a real learning investment, which is often the deciding factor for teams without analysts.
Is Qlik better than Tableau?
Qlik's associative engine is better for open-ended exploration across messy multi-source data, and its 2026 capacity pricing includes unlimited users, which is cheaper than Tableau for wide rollouts. Tableau is easier to learn and produces better-looking output. Qlik's entry price is higher at $300 a month.
What are Tableau's main competitors?
Power BI, Qlik Sense, Data Studio, Looker, Domo, Sisense, Oracle Analytics Cloud, Metabase, ThoughtSpot, Sigma, and Draxlr.
Is it worth migrating off Tableau?
Migrate if your viewer-to-author ratio is high, if your dashboards are operational rather than presentational, or if you do not have analysts to maintain the models Tableau assumes. Stay if Tableau's visual depth and governance are load-bearing for your business. Migration costs are real - budget for rebuilding dashboards and retraining users.
About the author

Vivek is a coder and the founder of Draxlr who cares deeply about building good products. He works at the intersection of AI, SQL, dashboards, and embedded analytics, with a strong focus on making complex data workflows feel simple, useful, and fast for real teams.
If you have questions about anything in this guide, or want to compare options for your specific stack, you can email Vivek at vivek@draxlr.com, try Draxlr free, or reach out directly through the Draxlr team.