Embed SQL Dashboards in Your SaaS App: One Dashboard or Full App?
Embed SQL dashboards as one fixed view or a full self-serve workspace? Compare 3 levels by cost, risk and support load, and learn when one dashboard is enough.
It's Monday morning, and a customer's operations manager emails your support team. They like the usage dashboard in your product. They just want it split by region, saved for their weekly meeting, and shared with their finance lead. Nobody built a "by region" view, so the request joins a queue.
That email is where the decision to embed SQL dashboards in your SaaS app really starts. You can show every customer one dashboard your team designed. Or you can use full app embedding to give each customer a workspace where they answer the next question on their own.
This guide splits that choice into three levels, from a single dashboard to a full workspace. You'll see what each one costs in money and support time, what tends to break, and how to tell which level your customers actually need. It's written for founders, product managers and customer success leads, so there's no code. If you want the engineering steps, our PostgreSQL dashboard embedding tutorial walks through them.
Key Takeaways
- Embedded SQL dashboards come in three levels: one fixed dashboard, interactive dashboards with filters and drill-down, or a full self-serve workspace for each customer.
- One dashboard is enough while customers ask the same questions.
- Full app embedding pays off once requests vary by account. It adds customer-built dashboards, saved queries, a query builder, a SQL editor and AI, plus more to govern.
- Over half of 403 analytics and AI leaders surveyed said their organizations use AI tools for automated insights and natural language queries (Gartner, June 2025).
What Does It Mean to Embed SQL Dashboards in Your App?
Embedding SQL dashboards in your app means showing charts built from queries on your own database inside your product. Each customer sees only their own data. They never log into a separate reporting tool, so the charts feel like part of the product they already pay for.
There are two broad ways to do it. In single-dashboard embedding, your team designs dashboards and places them on a page in your product. Customers view them, maybe filter them, and that's it. Full app embedding places the analytics tool itself inside your product, and each customer gets a private workspace to explore their data.
Both approaches rely on the same foundation: a guarantee that one customer can never see another customer's rows. Our guide to row-level security for multi-tenant analytics explains how that separation works.
What separates the two is who answers the next question. On a single dashboard, every new question becomes a request to your team. Inside a workspace, the customer answers it, and your team's job shifts to curating and supporting.
Three Levels of Embedded Analytics, From One Dashboard to a Full Workspace
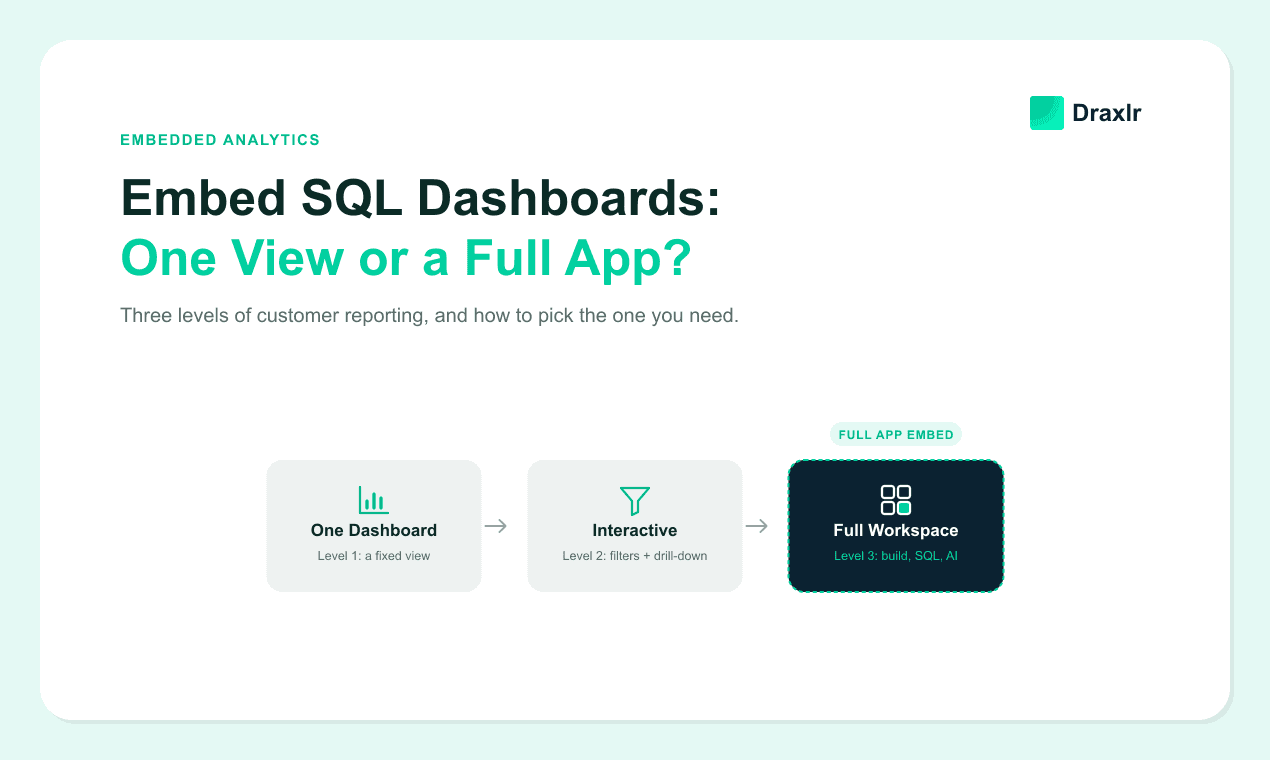
Embedded analytics comes in three levels: one fixed dashboard, interactive dashboards, and a self-serve workspace for each customer. Each level hands customers more control and asks more of your team, so knowing where you are today makes the next step obvious.
Level 1: One embedded dashboard
Your team builds a dashboard, such as monthly usage, orders or revenue, and shows it inside your product. Customers can usually change the date range, but everything else is fixed. On Monday morning, a customer's ops manager opens it, checks last week's numbers, and closes the tab. If they want a different cut of the data, they email you.
Good fit when: customers check the same few numbers on a schedule.
Level 2: Interactive dashboards with filters and drill-down
The dashboards are still yours, but customers can filter them by region, team or product. Clicking a bar shows the records behind it, and customers can export results to a spreadsheet. When a customer's ops manager filters to the West region and clicks a spike in late orders, they can see which of their own clients caused it. Many "can I see it by X?" requests disappear at this level without giving customers any building tools.
Good fit when: customers ask the same questions but want to slice the answers in a few predictable ways.
Level 3: A self-serve workspace for each customer
Each customer gets their own workspace inside your product. It holds the shared dashboards you publish, plus dashboards and saved queries the customer builds. Customers can build reports with a point-and-click query builder, write SQL, or ask an AI assistant in plain English.
With a workspace, a customer's ops manager builds a "late orders by carrier" chart and saves it to their own dashboard. Then they ask the AI assistant which carrier was slowest last week. Their analyst later writes a custom query for the quarterly review. None of it touches your support queue.
Good fit when: different accounts ask different questions, and some customers have analysts or managers who want to dig in themselves, like a finance lead who needs a custom margin report every quarter.
Single Dashboard vs. Full App Embedding: Side-by-Side Comparison
Single-dashboard embedding gives customers answers your team designed, while full app embedding gives them the tools to find their own. The table below compares those two ends of the spectrum. Interactive dashboards sit between them: still your dashboards, but with customer-controlled filters, drill-down and exports.
| Question | Single embedded dashboard | Full app embedding |
|---|---|---|
| Who builds the charts? | Your team, for every customer | Your team builds shared dashboards; customers build their own |
| What happens with a new question? | The customer files a request | The customer answers it with the query builder, SQL or AI |
| Can customers save their work? | No, everyone sees the same view | Yes, their own dashboards and saved queries |
| Who inside the account is served? | Whoever needs that one view | Ops leads, analysts and executives, each in their own way |
| Time to launch | Often days, since you place dashboards you already built | Usually a few weeks, mostly spent deciding who gets which tools |
| Ongoing work for your team | Building every new chart customers ask for | Curating shared dashboards and answering "how do I" questions |
| Biggest risk | Customers outgrow it and rebuild your charts in spreadsheets | Data separation gaps and conflicting numbers |
| Typical vendor pricing | Entry or mid-tier plans | Higher tiers, sometimes with usage-based AI |
A single dashboard is cheaper to license but costs your team time on every new request. Full app embedding costs more up front and shifts the work toward curation, training and governance, so either way someone pays.
When Is a Single Embedded Dashboard Enough?
A single embedded dashboard is enough when your customers mostly ask the same questions on a predictable schedule. Plenty of SaaS products live happily with one fixed or interactive dashboard for years. Moving up early adds cost and support work without adding value customers will use.
Stay with one dashboard, or a few interactive ones, if most of these are true:
- Most accounts ask the same five to ten questions. A well-designed dashboard already answers them.
- Reporting is a weekly or monthly habit.
- One role per customer uses the reports, such as an account owner or a manager.
- Requests for new views are rare, a handful per quarter across all accounts.
- You're still testing demand. You don't yet know if analytics will drive renewals or upsells, and a simple dashboard is the cheapest way to find out before you pay for more.
If that describes you, invest in a sharper dashboard with good filters, and revisit the decision when request patterns change. A tidy interactive dashboard beats an empty workspace nobody opens.
Signs Your Customers Need Full App Embedding
Customers need full app embedding when their questions vary by account and keep changing. No fixed dashboard keeps up, however well it's designed. You'll usually hear it first in support tickets and renewal calls, in plain English like this:
- "Can I save this view with my filters so I don't rebuild it every week?"
- "Can I make a chart of renewals by account manager for this quarter?"
- "Our CFO and our ops team want different dashboards. Can each have their own?"
- "Can our analyst run SQL on our own data?"
- "Can I just ask how many orders shipped late last week?"
Look for other tells, too, such as customers exporting your charts to spreadsheets so they can rebuild them. Reporting shows up as a requirement in deals and renewals. Your customer success team spends recurring hours pulling numbers by hand. For a fuller checklist, see our guide to the signs SaaS customers are ready for self-serve analytics.
SQL skills are widespread among technical staff. In the 2025 Stack Overflow Developer Survey, 58.6% of 31,771 respondents said they'd done extensive work in SQL over the past year. If your customers employ developers or analysts, someone there probably knows SQL, and that's the person most likely to ask for direct access.
What Does Full App Embedding Include?
Full app embedding gives each customer a workspace inside your product, separate from every other customer's. A complete workspace usually combines six parts. The parts serve different people inside the customer's account, from the executive who only reads to the analyst who writes SQL.
| Part of the workspace | What it does | Who uses it |
|---|---|---|
| Shared dashboards | Dashboards your team publishes to every customer | Everyone, especially executives |
| The customer's own dashboards | Dashboards the customer builds and arranges | Managers and team leads |
| Saved queries | Reports the customer can rerun any time | Anyone with a recurring question |
| No-code query builder | Pick data, filters and grouping from menus | Ops and business users who don't write SQL |
| SQL editor | Write queries directly against the customer's data | Analysts and technical staff |
| AI assistant | Ask a question in plain English and get a chart or table | Anyone, especially occasional users |
AI-driven analysis is already common inside companies. In a June 2025 release, Gartner reported on a survey of 403 analytics and AI leaders, run between October and December 2024. Over half said their organizations already use AI tools for automated insights and natural language queries.
Accuracy still needs a plan. The BIRD benchmark tests how often AI turns a plain-English question into a correct database query. As of September 2026, its top entry answered 82.95% of test questions correctly, against 92.96% for data engineers and database students. That's a curated test, and your own data will behave differently. Pick a tool where every AI answer shows how it was worked out, so customers can check it before acting.
What Can Go Wrong With Full App Embedding?
Most problems with full app embedding are governance and operating problems. Giving customers the power to build their own reports also lets them build wrong ones, slow ones, or ones nobody can explain, so plan for these before launch.
Data leaking between customers. This is the one failure you can't recover from.
Separation has to hold everywhere a customer can reach data: dashboards, the query builder, the SQL editor and AI answers. Ask how each customer's access is passed to the embed, which our explainer on secure token-based dashboard embedding covers.
Two numbers for the same metric. A customer builds their own "active users" chart with different rules than yours, and the numbers disagree. Keep official metrics in your shared dashboards and label them clearly as the source of truth.
Support work changes shape. "Can you build me a chart?" turns into "why does my chart show this?" Train your customer success team on the workspace, and publish a short help page with common questions.
Heavy queries slow things down. A customer's SQL query can scan millions of rows. Ask vendors whether queries can run against a copy of your database rather than the one your product uses.
AI costs grow with usage. AI assistants are often billed per question. A few curious customers can use more than you budgeted, so gate the assistant by plan at first.
Most of these risks shrink when the workspace is treated as a product feature with a named owner. That person reviews which shared dashboards get used and which customer questions keep coming back.
How to Roll Out Full App Embedding Without Overwhelming Customers
Roll out full app embedding in stages, and gate features by plan. In December 2025, Dresner Advisory Services published its 2025 Embedded BI Market Study. It named revenue from paid customer use as a key goal for embedding analytics, especially at smaller organizations. That makes tiering a pricing decision as much as a technical one. One common mapping looks like this:
| Your plan | Analytics level | What customers get |
|---|---|---|
| Starter | Level 1 | One or two shared dashboards with a date filter |
| Growth | Level 2 | Filters, drill-down and exports |
| Pro | Level 3 | Own dashboards, saved queries and the query builder |
| Enterprise or add-on | Level 3, everything on | SQL editor and AI assistant |
Then launch in four steps:
- Pick three to five pilot accounts that have already asked for custom reports.
- Publish strong shared dashboards first, so the workspace isn't empty on day one.
- Turn on one building tool at a time. Start with the query builder, then add SQL and AI once you've seen what pilots build with menus alone.
- Promote popular custom reports to shared dashboards.
To tell whether the rollout is working, track three things. Count how many pilot accounts save at least one report in their first month. Compare report-request tickets before and after launch, then check how often customers still export data to rebuild your charts in spreadsheets.
How Much Does Full App Embedding Cost Compared With One Dashboard?
Full app embedding usually costs more than single-dashboard embedding because vendors place it on higher plans. Pricing model is the real variable. Vendors charge per viewer, per customer account, as flat platform tiers, or with usage-based AI on top, and the gap between models widens as you add customers.
To illustrate, with made-up numbers: at 100 customers, a flat $500 monthly plan works out to $5 per customer. A plan charging $10 per viewer, with three viewers per customer, would cost $3,000 a month for the same 100 customers.
For a concrete reference point, Draxlr, which publishes this guide, includes single-dashboard embedding on its Premium plan at $75 a month. Its full app embedding, with a separate workspace for each customer, starts on the Power plan at $250 a month. Customers using the workspace don't count toward your user total. Their AI questions draw on your account's AI credits.
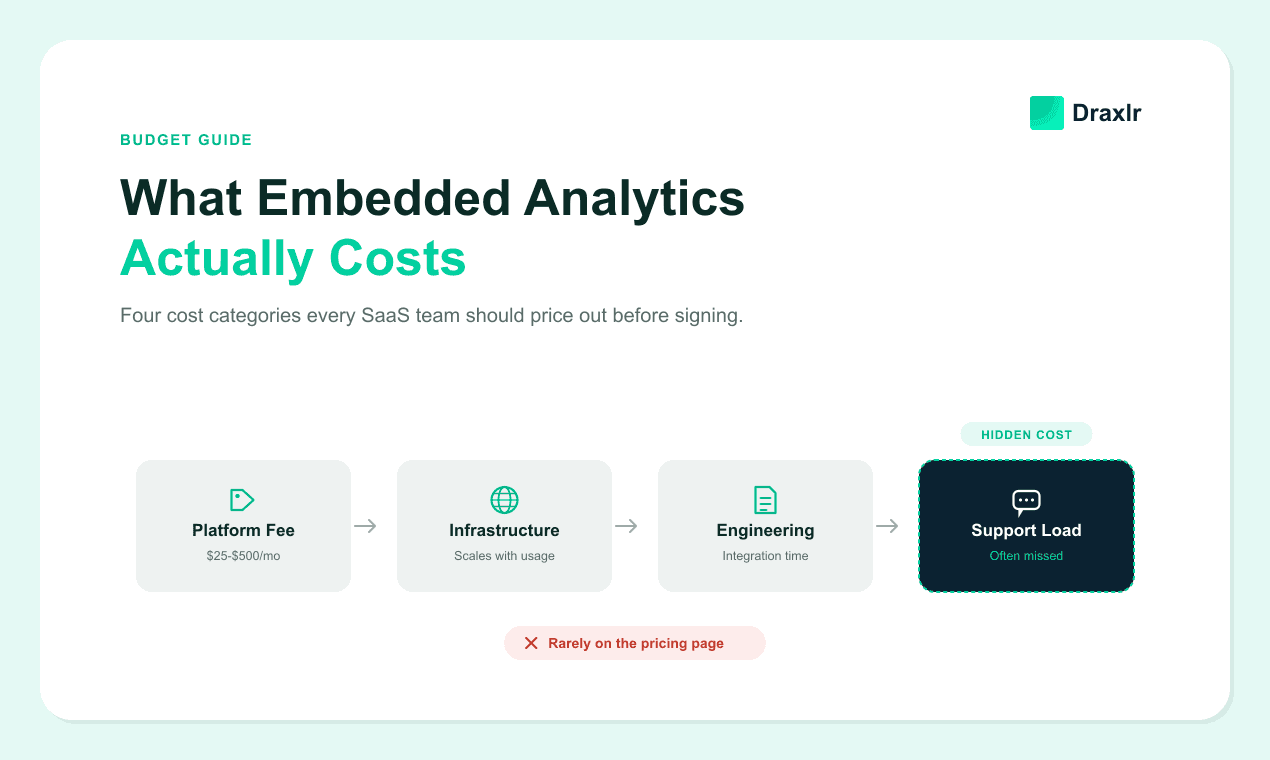
Whichever vendor you evaluate, run the numbers at your expected customer count a year out, including engineering time, support load and AI usage. Our embedded analytics budget guide breaks down each line item, from platform fees to the support hours that are easy to leave out.
Questions to Ask Vendors Before You Choose
Ask vendors about upgrade paths, feature controls and data separation alongside price. These answers decide whether you can start small and grow, or whether you'll have to re-integrate later. Keep this list handy:
- Can we start with single dashboards and turn on the full workspace later without redoing the integration?
- Can we switch individual features on or off per customer or plan, such as dashboard creation, exports, SQL and AI?
- How does data separation hold in the SQL editor and AI assistant, not just on dashboards?
- Do workspace users count toward our user total?
- How are AI questions billed, and can we cap them?
- Can the workspace match our product's colors and fonts? Our guide to white-labeling embedded dashboards without forking covers what to check.
- What happens when a customer's query is slow or very large? Ask whether queries have time limits and how slow ones are reported back to the customer.
If you're still building a shortlist, our roundup of SQL dashboard tools for embedding compares the main options side by side.
A Quick Way to Pick Your Level
The fastest way to pick a level is to listen to how customers phrase their requests. The wording tells you more than any feature list does.
| What customers say | Level that fits |
|---|---|
| "Can I see last quarter's numbers?" | Level 1: one embedded dashboard |
| "Can I see this by region and click into the details?" | Level 2: interactive dashboards |
| "Can I save my own version and build new charts?" | Level 3: full workspace with the query builder |
| "Can our analyst run SQL, or can I just ask a question?" | Level 3 with the SQL editor and AI assistant |
If most requests sit in the first two rows, a well-built interactive dashboard is the right call. Requests like the last two rows, arriving every month, signal that full app embedding will likely pay for itself in saved support time.
Frequently Asked Questions
What is the difference between embedding a dashboard and full app embedding?
Embedding a dashboard shows customers charts your team designed, with limited filters. Full app embedding gives each customer a private workspace with shared dashboards, their own dashboards and saved queries, a query builder, a SQL editor and an AI assistant. The first answers known questions. The second lets customers answer new ones.
Is a single embedded dashboard enough for most SaaS products?
Often, yes. If most accounts ask the same five to ten questions and new requests arrive only a few times a quarter, one well-designed interactive dashboard is enough. Move to a full workspace when requests vary by account, customers rebuild your charts in spreadsheets, or someone asks to run SQL.
Do customers need to know SQL to use an embedded workspace?
No. Most users work with shared dashboards, a point-and-click query builder, or an AI assistant that takes plain-English questions. The SQL editor is there for analysts. In the 2025 Stack Overflow Developer Survey, 58.6% of respondents had done extensive SQL work, so many technical teams already know it.
How do you keep each customer's data separate with full app embedding?
Your product tells the embed which customer is signed in, and the analytics platform applies row-level security so every query only returns that customer's rows. Check that separation covers the customer's own dashboards, saved queries, the query builder, the SQL editor and AI answers, not just the shared dashboards.
Conclusion
Embedding SQL dashboards comes down to choosing a level, and the right one is wherever your customers' requests actually are. When most want the same view, build that view well. Once every account keeps asking for something different, full app embedding starts to earn its higher price. It hands the next question to the customer, along with governance work your team should plan for from day one.
About the author

Vivek is a coder and the founder of Draxlr who cares deeply about building good products. He works at the intersection of AI, SQL, dashboards, and embedded analytics, with a strong focus on making complex data workflows feel simple, useful, and fast for real teams.
If you have questions about anything in this guide, or want to compare options for your specific stack, you can email Vivek at vivek@draxlr.com, try Draxlr free, or reach out directly through the Draxlr team.