Self-Serve Analytics: 5 Signs Your SaaS Customers Are Ready
Five signals your SaaS customers are ready for self-serve analytics, from repeat report requests to RFP asks, plus a readiness checklist before you build.
The same customer emails your support team asking for "that usage report" for the third month in a row. Nobody notices the pattern until someone tallies it up — and by then, three other accounts have asked for the same thing. That's usually the first real sign that a static report has stopped being enough.
Most SaaS teams don't decide to build self-serve analytics. They back into it, one recurring request at a time, long after the signals were already there. This guide covers the five signals that actually mean your customers are ready — not just asking for a nicer PDF. It also gives you a simple checklist to tell the difference before you commit engineering time to the wrong fix.
Key Takeaways
- In 2025, 76% of organizations admitted they'd made a business decision without consulting available data because it was too hard to access (Sisense, "State of Analytics," 2025).
- A year later, 69% of product leaders still said analytics inside their own product wasn't easily accessible, and 65% made product decisions without referencing data that already existed.
- 86% of embedded analytics buyers rate self-service capability as a key purchase factor, and 80% cite customizable dashboards as an important influence (insightsoftware and Hanover Research, "Embedded Analytics Insights for 2024," 2024).
- The signal isn't one big request — it's the same request repeating across accounts, support tickets, and renewal calls at the same time.
What Does "Ready for Self-Serve Analytics" Actually Mean?
Customers are ready for self-serve analytics when they're asking to explore their own data on their own schedule, not just asking you to hand them a fixed view of it more often. A static report answers one question well. Self-serve analytics answers whatever question the customer has next, without a ticket.
That distinction matters because the two problems have completely different fixes. A recurring request for the same three numbers is a reporting problem — you can solve it with a better scheduled export or a cleaner PDF. A recurring request for different slices of the same underlying data is a self-serve problem instead: this month instead of last month, this region instead of all regions.
No amount of report polish fixes that. The customer doesn't want a better answer to the old question. They want to ask a new one.
Signal #1: The Same Request Keeps Coming Back From the Same Accounts
In 2025, 76% of organizations admitted they'd made a business decision without consulting available data, simply because getting to it was too hard (Sisense, "State of Analytics," 2025). That friction doesn't stay invisible forever — it shows up as the same account asking your team to pull the same numbers, month after month, because self-serve was never an option in the first place.
That same survey of 536 data professionals also found up to 50% of a typical workday lost to what it calls "digital friction" — bouncing between apps and reconciling data by hand, with roughly 10 app switches per analytics task. That's the internal version of the same problem your customers are quietly living with externally.
The tell isn't that a customer asked for a report once. It's that the same customer asked for a variant of it — a different date range, a different segment, a different grouping — three or more times in a quarter. That pattern means they don't want your report. They want a dashboard they can drive themselves.
Signal #2: Multiple Accounts Ask the Exact Same Question, Independently
If three or more unrelated accounts request the same kind of view without prompting each other, that's not a one-off preference — it's product-market signal that your reporting surface is too thin. A year-later follow-up to the same research found 69% of product leaders still say analytics inside their own product isn't easily accessible, and 65% admit to making product decisions without referencing data that already exists somewhere in their stack.
That statistic describes internal teams, but the pattern maps directly onto your customers. If your own product leaders can't get to data that technically exists, your customers — who have far less access than your internal team does — are almost certainly hitting the same wall, just without a Slack channel to complain in.
Signal #3: Your Support Queue Has a Growing "Reporting" Tag
Track how many tickets get tagged as data or reporting requests over a quarter, and watch the trend line, not the raw count. A flat or shrinking number means your current reporting covers the need. A queue that's climbing relative to your total ticket volume means customers are hitting a wall your static reports can't get past, and support is quietly absorbing the cost of that gap.
| Friction point | What the data shows | Source |
|---|---|---|
| Decisions made blind | 76% made a decision without available data because access was too hard | 2025 survey |
| Product analytics inaccessible | 69% say in-product analytics still isn't easily accessible | 2026 follow-up |
| Time lost to app-switching | Up to 50% of a workday lost reconciling data across apps | 2025 survey |
Source: Sisense, "State of Analytics," 2025 and 2026.
A "reporting" ticket tag that's growing faster than your account count is the closest thing to a leading indicator you'll get before customers start saying it out loud on renewal calls.
Signal #4: Dashboards Start Showing Up in RFPs and Renewal Conversations
When "dashboard" or "reporting" starts appearing in procurement requirements instead of just support tickets, that's a buying-criteria signal, not a support one — and it typically means you're already behind competitors who built it first. 86% of embedded analytics buyers rate self-service capability as a key factor in their purchase decision, and 80% cite customizable dashboards specifically as an important influence (insightsoftware and Hanover Research, "Embedded Analytics Insights for 2024," 2024).
That's a meaningfully different signal than a support ticket. A ticket says one customer is annoyed today. A requirements checklist in an RFP says your prospects are actively comparing you against vendors who already solved this, before they've even signed — often alongside questions about how tenant data stays isolated, which our guide to secure, token-based dashboard embedding covers in detail.
The gap between these two signals is often where teams lose the most time. Support tickets get triaged and closed one at a time, so the pattern rarely reaches the roadmap. RFP language gets read by sales and forwarded to product only when a deal is already at risk — which is the most expensive possible moment to discover the same request has been sitting in your support queue for a year.
Signal #5: Your Team Has Quietly Become a Reporting Department
When engineers, support, or customer success spend recurring hours each week manually pulling numbers for customers, you've already built a self-serve analytics team. It just doesn't have dashboards, and none of that time shows up on a roadmap.
Independent analyst coverage backs up how far this has already shifted: embedded BI reached an all-time high in perceived importance in 2025, extending a three-year upward trend, with the strongest demand in healthcare and manufacturing (Dresner Advisory Services, "2025 Wisdom of Crowds Embedded Business Intelligence Market Study," December 2025).
One tenant-experience SaaS company, Spaceflow, replaced standalone dashboards it had been running for customers with an embedded, self-service layer. It reported up to an 80% drop in generic analytics requests afterward, according to a published customer case study by embedded-BI vendor Luzmo.
Treat that figure as one company's result, not an industry average. It still illustrates the shape of what changes: the requests don't disappear, they just stop routing through a human.
Our guide to adding analytics without building a full data platform covers the architecture that gets you there without an ETL pipeline or a hiring plan.
A Simple Readiness Checklist
Score each signal honestly before committing to a build. One or two "yes" answers generally means a better static report will hold you for another quarter or two. Three or more means the underlying need has already outgrown what a report — however well designed — can do.
| Signal | Threshold worth acting on | Not ready yet if... |
|---|---|---|
| Repeat requests | Same account, 3+ variants of the same report in a quarter | A single account asked once, no follow-up |
| Cross-account overlap | 3+ unrelated accounts ask independently | Only your biggest, most demanding account asks |
| Support tag trend | "Reporting" tickets growing faster than account count | Tag volume is flat or shrinking quarter over quarter |
| Buying signal | "Dashboard" or "reporting" named in an RFP or renewal ask | Feature requests only, never tied to a deal |
| Internal time cost | Recurring weekly hours spent hand-building customer reports | One-off, ad hoc pulls a few times a year |
What Happens If You Wait Too Long?
The cost of waiting isn't standing still. The surrounding market keeps moving toward embedding data directly into products, and every quarter you delay is a quarter competitors close that gap first. Gartner has projected that by 2026, more than 80% of independent software vendors will have embedded generative AI capabilities into their applications, up from less than 5% in 2023 (Gartner, March 2024).
That's a broader signal that customers are learning to expect insight, not just data, built into the products they already use. Treat the exact percentage as directional rather than gospel, since it comes from a single press release rather than a published methodology you can inspect.
The cost side isn't only about losing deals, either. One organization, Global K9 Protection Group, reported cutting its analytics platform costs by 60% after moving off a single-tenant system onto an embedded, multi-tenant self-service layer, according to a published case study by embedded-analytics vendor Qrvey.
That's a single company's result, not a benchmark. It's a reminder that "wait and see" has a real ongoing cost, not just an opportunity one, once you're paying to maintain a reporting patchwork that a proper embed would replace.
What Building Self-Serve Analytics Actually Requires
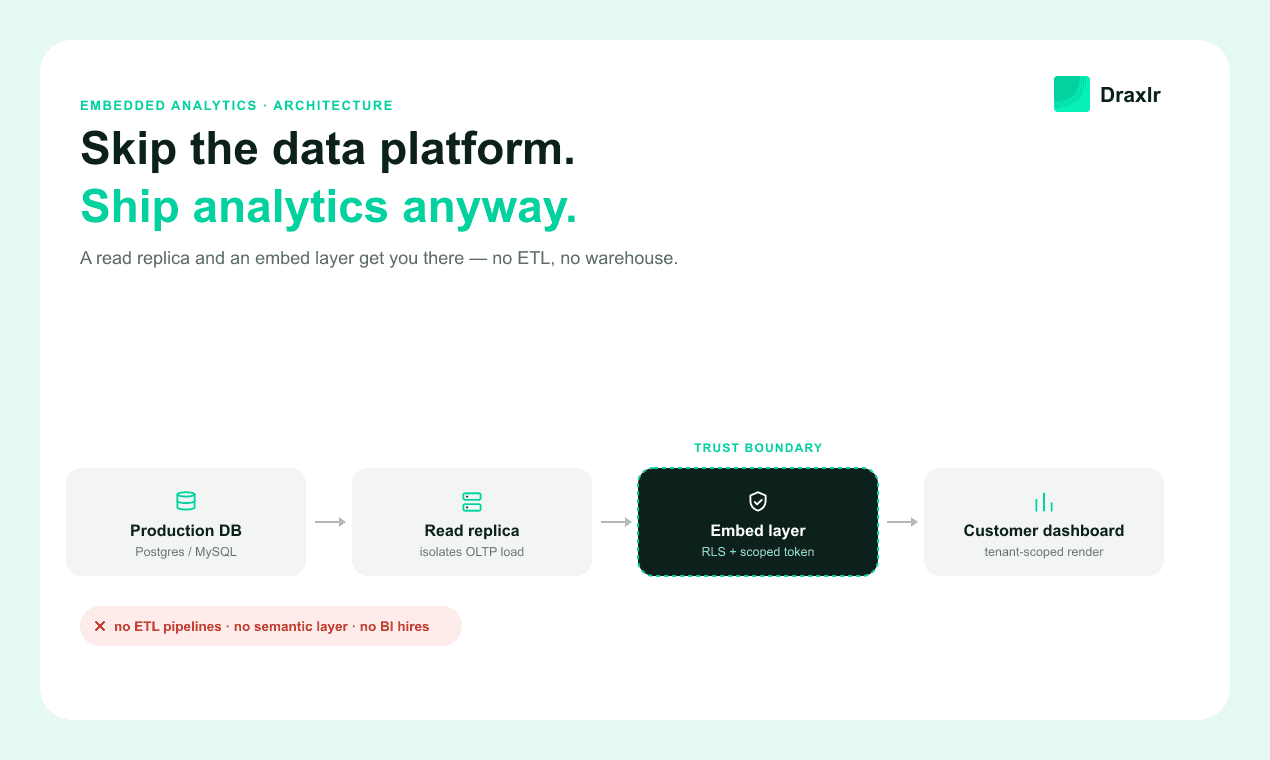
Once the signals above say yes, the build itself is smaller than most teams expect: a read-only connection to the data customers already have in your product, isolation so each customer only ever sees their own rows, and a query-and-chart layer on top. Our row-level security guide covers the tenant-isolation piece in detail — read replicas, RLS policies, and caching, in order.
You don't have to build that layer from scratch. Options range from managed embedded-BI platforms that handle the query engine, charting, and secure embedding for you — tools like Metabase, Cube, or Draxlr — to lighter libraries you wire into an interface you already own. Which option fits depends on how much of that surface you want to build yourself versus hand off, not on any single signal above.
If matching the dashboard to your own product's look matters for the deal, see our breakdown of what white-label analytics actually includes.
Frequently Asked Questions
How do I know if customers need self-serve analytics instead of just a better report?
Look at whether requests repeat with variation — a different date range, segment, or grouping each time — rather than asking for the exact same numbers on a schedule. Repeating variation means customers want to explore data themselves; a repeated, identical request often just needs a better scheduled export, not a dashboard.
What's a reasonable threshold before building self-serve dashboards?
Three or more of the five signals in this guide — repeat requests, cross-account overlap, a rising support tag, RFP mentions, or ongoing internal time cost — is a reasonable bar. One or two signals typically means a better static report buys you another quarter before a build is justified.
Does every SaaS product eventually need embedded analytics?
No. Products where customers only ever need one or two fixed numbers rarely justify the investment. The signals in this guide exist specifically to separate that case from products where customer needs are already varied enough that no single report design will satisfy all of them.
What's the difference between a customer portal report and self-serve analytics?
A portal report shows a fixed view someone else designed; self-serve analytics lets the customer change the date range, filter, or grouping themselves, without a new ticket or release. If customers keep asking for slightly different versions of the same report, that gap is exactly what self-serve analytics closes.
Conclusion
None of the five signals in this guide are dramatic on their own — a repeat request here, a support tag there. The mistake is treating them as isolated annoyances instead of adding them up. Once three or more show up in the same quarter, the underlying need has already outgrown what a static report was ever designed to answer.
The build, once you're actually ready, is smaller than the wait usually is. A read-only connection to data customers already have, tenant isolation, and a query layer on top gets most SaaS teams to a working self-serve dashboard — no data platform, and no more guessing which signal was the one that mattered.
About the author

Vivek is a coder and the founder of Draxlr who cares deeply about building good products. He works at the intersection of AI, SQL, dashboards, and embedded analytics, with a strong focus on making complex data workflows feel simple, useful, and fast for real teams.
If you have questions about anything in this guide, or want to compare options for your specific stack, you can email Vivek at vivek@draxlr.com, try Draxlr free, or reach out directly through the Draxlr team.