Real-Time vs. Near-Real-Time Dashboards: What "Live Data" Actually Requires
Real-time vs near-real-time dashboards: what each one requires, where latency really comes from, and how to tell which your product needs before you build.
"Can the dashboard be real-time?" is one of the most expensive questions in a product spec, because almost nobody defines it before asking. Sometimes it means sub-second updates during an incident. Sometimes it means "don't make me hit refresh." Those two requirements produce completely different architectures, completely different bills, and completely different failure modes.
This post draws the actual line between real-time and near-real-time dashboards — what each one requires end to end, where the latency really comes from (it's rarely the frontend), and how to figure out which one your product actually needs before you build the wrong one. If you've already solved tenant-scoped embed access, freshness is usually the next architecture decision on the list.
Key Takeaways
- True real-time (sub-second, p95 under 100ms) needs a fundamentally different pipeline than near-real-time (seconds to low minutes) — you can't get there by polling faster.
- In 2026, 86% of IT leaders name data streaming a strategic priority (Confluent, 2025 Data Streaming State of Data Report, 2025), but most of that investment is going toward pipelines that feed near-real-time systems, not sub-second dashboards.
- PostgreSQL's native materialized views recompute the entire query on every refresh — they don't give you incremental freshness for free.
- Read replica lag is a hidden part of your freshness budget: streaming replication typically holds under a second in a well-tuned setup, but degrades to tens of seconds under write load or network pressure (pgEdge, 2026).
What's the Actual Difference Between Real-Time and Near-Real-Time?
Real-time means the value on screen reflects a state change within roughly 100 milliseconds of it happening; near-real-time means the same thing within seconds to a few minutes. In a 2026 engineering framework, StreamNative splits this into tiers: under 5ms for trading and control systems, 5–100ms for interactive dashboards and alerting, and "more than 100ms to minutes" for near-real-time analytics and BI reporting (StreamNative, Latency Numbers Every Data Streaming Engineer Should Know, 2026).
That range matters because the cost curve isn't linear. Getting from "hourly batch" down to "one minute" is mostly a config change — shrink a cron interval, add a materialized view refresh. Getting from "one minute" down to "one second" usually means replacing the whole path: swapping batch ETL for change data capture, swapping a scheduled query for a streaming computation, and swapping HTTP polling for a persistent connection. The last 10x of latency reduction tends to cost more than the first 100x combined.
For most embedded dashboards inside a SaaS product — usage metrics, billing, support ticket volume, customer-facing KPIs — "real-time" is what a customer says when they mean "not stale by the time I check it." That's near-real-time. True real-time is a narrower ask: live ops monitoring, fraud scoring, trading views, collaborative multiplayer state. Confusing the two means either overbuilding a Kafka pipeline nobody needed, or underbuilding a polling loop that can't hit the latency the product actually promised.
Why Do Most "Real-Time" Requests Turn Out to Be Near-Real-Time?
Stakeholders reach for the word "real-time" because it's the only latency vocabulary most non-engineers have — there's no common term for "acceptably fresh." In practice, once you ask "does this need to update while someone is watching it, or just be current when they open the page," the vast majority of dashboard requests resolve to the second answer, which is a near-real-time problem with a much smaller bill.
This isn't a minor semantic point. In 2026, 86% of IT leaders say data streaming is a strategic investment priority, and 44% of organizations report achieving at least 5x ROI on those investments (Confluent, 2025 Data Streaming Report, 2025). That's real infrastructure spend, and a meaningful share of it is going into pipelines built to satisfy a "real-time" requirement that a well-indexed query and a 30-second poll would have satisfied just as well from the user's point of view. Before committing to streaming infrastructure, it's worth writing down the actual latency the product needs to hit and who is verifying it — because "real-time" as stated by a stakeholder is rarely the constraint that matters; the constraint is what a user does differently at 2 seconds versus 30 seconds of staleness.
The Architecture True Real-Time Actually Requires
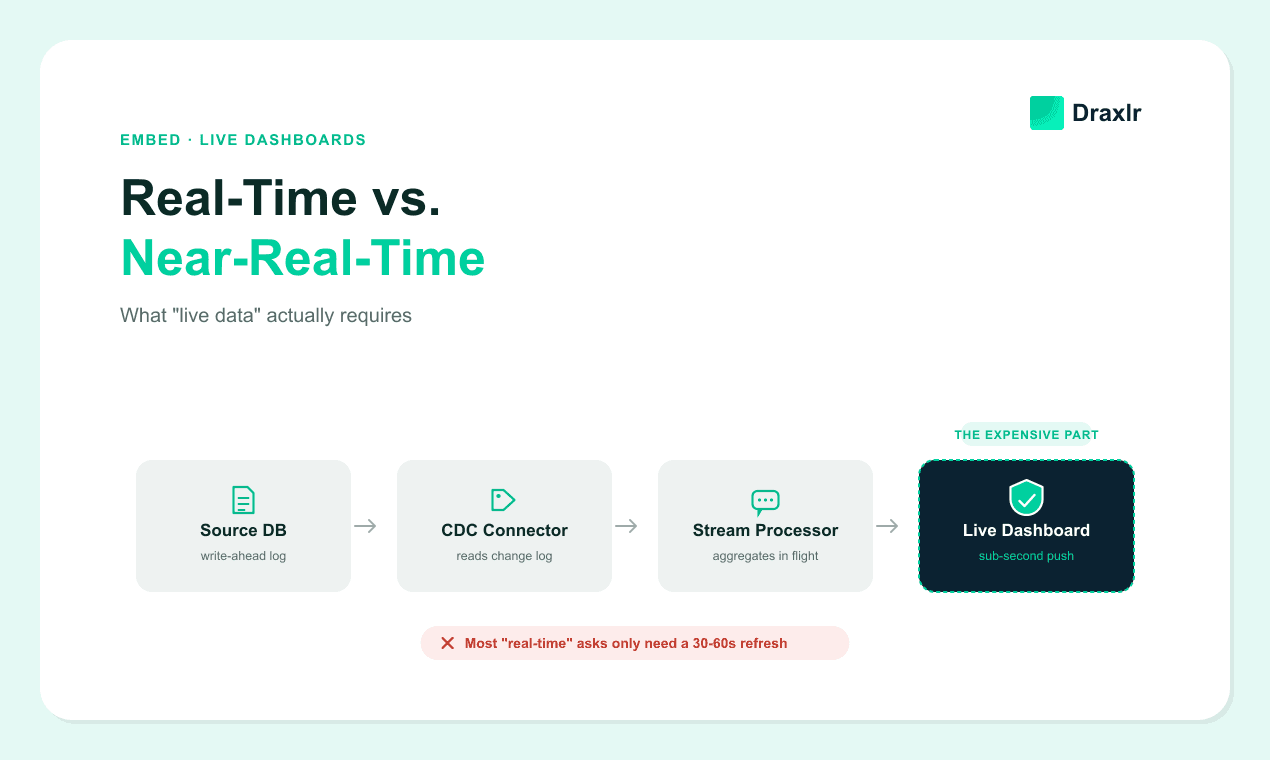
A sub-second dashboard needs every hop in the pipeline to individually stay in the tens-of-milliseconds range, because latencies add. The standard pattern looks like this: change data capture (CDC) reads the database write-ahead log, a stream processor transforms and aggregates events in flight, a streaming-native store maintains the result incrementally, and the client holds a persistent connection that pushes updates instead of asking for them.
Source DB (WAL)
  → CDC connector (Debezium / native logical replication)
  → Stream processor (Kafka Streams / Flink / ksqlDB)
  → Incrementally maintained view (Materialize / RisingWave / streaming table)
  → Push transport (WebSocket or SSE) → Dashboard client
CDC is the part teams underestimate. Log-based CDC — reading the database's write-ahead log rather than polling tables — is treated as the default assumption for production pipelines by 2026, because it captures every change with minimal source load and correct ordering. At the high end, in a widely cited 2020 benchmark still referenced as a scale reference, PingCAP measured its TiCDC connector processing an average of 238,000 (peaking at 713,000) key-value change events per second, with Kafka-side replication latency under 3 seconds, across a 100+ TB cluster (PingCAP, TiCDC: Replication Latency in Milliseconds for 100+ TB Clusters, 2020) — a useful reference point for what "real real-time" infrastructure looks like at scale, and a reminder that this tier is built for a different problem than a typical SaaS product dashboard.
Every stage in that chain is a place to add capacity, and every stage is a place latency creeps back in if you don't budget for it. A stream processor with a 2-second micro-batch window isn't real-time no matter how fast the CDC connector feeding it is — the batch window becomes the new latency floor.
Why Doesn't a Materialized View Just Give You Real-Time for Free?
PostgreSQL's native MATERIALIZED VIEW recomputes the entire underlying query from scratch on every REFRESH, even with the CONCURRENTLY option — concurrency avoids locking readers out during the refresh, it does not make the refresh incremental or continuous. That means the freshness of a materialized-view-backed dashboard is exactly however often you schedule the refresh, and the refresh cost scales with the full query, not with what changed.
This is the single most common near-real-time architecture, and it's a good one: schedule REFRESH MATERIALIZED VIEW CONCURRENTLY every 30–60 seconds against a well-indexed aggregation, and most product dashboards will feel current. It breaks down once you need sub-minute freshness on a large or expensive query, because the full recompute simply doesn't finish fast enough to keep up with the schedule.
Two paths exist past that ceiling. pg_ivm, an incremental view maintenance extension for PostgreSQL, updates the materialized view based only on the rows that changed rather than recomputing the query — but as of 2026 it remains an add-on extension, not part of core PostgreSQL, and needs the same evaluation any extension does before production use. The other path is a purpose-built streaming database — Materialize, RisingWave, or ksqlDB — that maintains the view as a live dataflow graph, where every insert, update, or delete on the source propagates to the view immediately instead of on a schedule. That's a bigger architectural commitment, and it's the right one only once scheduled refresh has actually stopped meeting the requirement, not before.
| Approach | Freshness floor | Operational cost | Fits |
|---|---|---|---|
| Scheduled query / cache | Minutes to hours | Lowest | Reporting, weekly/daily BI |
| Scheduled materialized view refresh | ~30–60 seconds | Low | Most product / customer dashboards |
| Incremental view maintenance (pg_ivm) | Seconds | Medium | High-write tables that outgrow full refresh |
| CDC + streaming database | Sub-second | Highest | Ops monitoring, fraud, trading views |
How Much Latency Does Read Replica Lag Actually Add?
If your dashboard reads from a replica instead of the primary — the standard pattern for keeping analytics load off the transactional database — replication lag is part of your freshness number whether you accounted for it or not. As of 2026, in a well-tuned PostgreSQL setup, streaming replication lag commonly holds in the sub-second to low-single-digit-second range, while logical replication (the mechanism CDC tools build on) tends to run a bit higher, often in the 2–4 second range under normal load (pgEdge, Understanding and Reducing PostgreSQL Replication Lag, 2026).
That lag isn't fixed. The same source documents a case where enabling parallel apply in PostgreSQL 14+ cut logical replication lag from 4 seconds to under 1 second by spreading the apply workload across multiple workers, and a separate case where tuning wal_buffers and wal_writer_delay alongside a faster network link cut streaming lag by half, down to under a second. Under heavy write bursts or a network hiccup, though, lag can climb to tens of seconds even on a system that normally holds sub-second — which is exactly the scenario a dashboard demo never hits but a production incident always does.
Practically: if you're building for near-real-time and reading from a replica, treat replica lag as a line item in your latency budget, not a rounding error. If you're building for true real-time, reading analytics off a lagging replica quietly caps how "real-time" your pipeline can ever be, no matter how fast the transport layer downstream is.
WebSocket, SSE, or Polling: Which Transport Actually Fits?
The transport layer only matters after the data is fresh enough to be worth pushing — but picking the wrong one still adds real, avoidable latency and cost on top of a good backend. Long polling simulates real-time updates over plain HTTP but carries high per-request overhead: in a 2026 measured comparison of 1,000 events, repeatedly re-sent HTTP request headers accounted for nearly two-thirds of total long-polling bandwidth — more than the event payloads themselves (The Infinity Dev, WebSocket vs SSE vs Long Polling: The Real Cost of 1,000 Events, 2026). Server-Sent Events gives efficient one-way server-to-client streaming with automatic reconnection built into the browser API, and covers most dashboard use cases — live metrics, progress indicators, notifications — without the operational weight of a bidirectional protocol. WebSockets add full duplex communication and the lowest latency of the three, but cost more to build and operate: you own the reconnect loop, backoff, resume cursor, and duplicate-event suppression yourself, and serverless platforms like AWS Lambda don't hold persistent connections natively, which complicates deployment.
The practical rule: start with polling for anything on a 30-second-plus refresh cycle — it needs no new infrastructure and works everywhere. Move to SSE once you need push updates on a near-real-time cadence. Reserve WebSockets for cases that genuinely need bidirectional communication — collaborative editing, live chat alongside the dashboard, or sub-second interactivity where SSE's one-way model becomes a real constraint, not just a theoretical one.
The Real Cost of "Live Data"
Every step down the latency ladder adds infrastructure that has to run continuously, not just when someone's looking at the dashboard. A scheduled query or cached materialized view costs almost nothing beyond the database you already run. CDC plus a stream processor plus an always-on push transport means a Kafka cluster (or managed equivalent), stream processing compute, and a WebSocket or SSE fleet that has to stay up even at 3am with zero active viewers — cost that scales with uptime, not usage. That's consistent with the broader market: in a 2025 forecast covering 2025–2030, Grand View Research projects the data pipeline tools market growing from $12.09 billion in 2024 to $48.33 billion by 2030, a 26.8% CAGR (Grand View Research, Data Pipeline Tools Market, 2025), largely on the back of teams building exactly this kind of always-on infrastructure. For a fuller breakdown of what streaming versus scheduled infrastructure costs to run, see our embedded analytics budget guide.
For most embedded, customer-facing dashboards, the near-real-time tier is the right tradeoff: fresh enough that customers stop asking for a refresh button, without the standing cost of a streaming platform built for a latency requirement nobody's actually using. If you're evaluating an embedded SQL dashboard tool rather than building the pipeline in-house, ask specifically what its default refresh interval is and whether it's configurable per widget — that number determines which tier you're actually buying, regardless of what the vendor calls it on the pricing page.
A Framework for Deciding If You Actually Need Real-Time
Ask these in order before committing to a real-time architecture:
- Does a human make a different decision at 2 seconds of staleness than at 30 seconds? If not, you need near-real-time.
- Is the data feeding an automated action (alerting, fraud scoring, trading) rather than a human glance? If yes, that's a real-time case.
- Can the source query finish fast enough to refresh on a schedule without falling behind? If yes, a scheduled materialized view is enough — no new infrastructure required.
- Are you already paying for CDC or streaming infrastructure for another reason? If yes, extending it to one more dashboard is cheap. If no, building it from scratch for a single dashboard rarely pays for itself.
Most SaaS product dashboards fail question 1 and land on near-real-time. Ops monitoring, fraud, and trading-adjacent views tend to pass it and justify the real-time build. Answering honestly before writing infrastructure code saves the rebuild later.
Frequently Asked Questions
What's the actual difference between real-time and near-real-time dashboards?
Real-time dashboards update within roughly 5–100 milliseconds of a data change; near-real-time dashboards update within seconds to a few minutes. The dividing line is architectural, not cosmetic — real-time requires change data capture and a persistent push connection, while near-real-time can run on a scheduled query and polling (StreamNative, 2026).
Does switching to WebSockets make a dashboard real-time?
No. WebSockets only remove transport-layer delay; they don't change how fresh the underlying data is. A WebSocket connection pushing a materialized view that refreshes every 60 seconds is still a near-real-time dashboard — it just delivers the 60-second-old data slightly faster than a poll would.
Can PostgreSQL materialized views power a real-time dashboard?
Native PostgreSQL materialized views recompute the full query on every refresh, so they're well suited to near-real-time freshness on a 30–60 second schedule but not to sub-second real-time. The pg_ivm extension adds incremental refresh for lower latency, and a dedicated streaming database (Materialize, RisingWave) is typically needed for genuinely sub-second freshness.
How much lag does a read replica add to dashboard freshness?
In a well-tuned setup, streaming replication lag commonly holds under a second, while logical replication (used by most CDC tools) often runs 2–4 seconds under normal load — and either can spike to tens of seconds under heavy write traffic or network pressure (pgEdge, 2026). Add this to your total latency budget rather than assuming it's negligible.
What's the cheapest way to get a near-real-time dashboard?
A scheduled materialized view refresh (every 30–60 seconds) combined with client-side polling or SSE covers most product dashboards without any streaming infrastructure. This is dramatically cheaper to build and operate than CDC-based streaming, and it's the right default unless you've confirmed the product actually needs sub-second updates.
Conclusion
"Real-time" and "near-real-time" aren't points on the same dial you turn up by adding more servers — they're different architectures with different failure modes and a roughly 10x cost gap between them. Near-real-time, built on a scheduled materialized view refresh and a polling or SSE client, covers the overwhelming majority of product and embedded analytics dashboards without a streaming platform. True real-time — CDC, stream processing, an incrementally maintained view, and a persistent push connection — is worth the investment only when a human or an automated system genuinely acts differently at sub-second freshness than at 30 seconds.
Before scoping the next "can it be real-time" request, run it through the four-question framework above. It's cheaper to answer honestly up front than to discover the gap in production.
About the author

Vivek is a coder and the founder of Draxlr who cares deeply about building good products. He works at the intersection of AI, SQL, dashboards, and embedded analytics, with a strong focus on making complex data workflows feel simple, useful, and fast for real teams.
If you have questions about anything in this guide, or want to compare options for your specific stack, you can email Vivek at vivek@draxlr.com, try Draxlr free, or reach out directly through the Draxlr team.