Best Embeddable Alternatives for Embedded Analytics in 2027
Compare Embeddable alternatives for 2027, from Draxlr and Luzmo to Qrvey, Reveal, Bold BI, Sisense and GoodData, on setup, self-service, AI and pricing.
Embeddable alternatives make sense when your team would rather not maintain React components and Cube data models just to put a dashboard in front of customers.
Embeddable gives developers a lot of control, but its customer AI chat is still labelled a prototype in its own docs, dashboard PDFs need code, and every price starts with a sales call.
We checked seven alternatives against each vendor's own docs and pricing pages in November 2026, looking at setup work, customer self-service, AI and published pricing.
TL;DR: Pick Draxlr if you want each customer to get a full analytics workspace (shared dashboards, their own dashboards and saved queries, a no-code query builder, a SQL editor and a ready AI assistant) on your SQL database with nothing to code first, from $75/month flat with unlimited viewers. Pick Bold BI or Luzmo if your developers want an SDK with a published price. Pick Qrvey or Reveal if you need a flat licence that runs in your own cloud. Pick Sisense or GoodData if you're an enterprise that needs on-premise SDK embedding or governed metrics across many customer workspaces.
What is Embeddable?
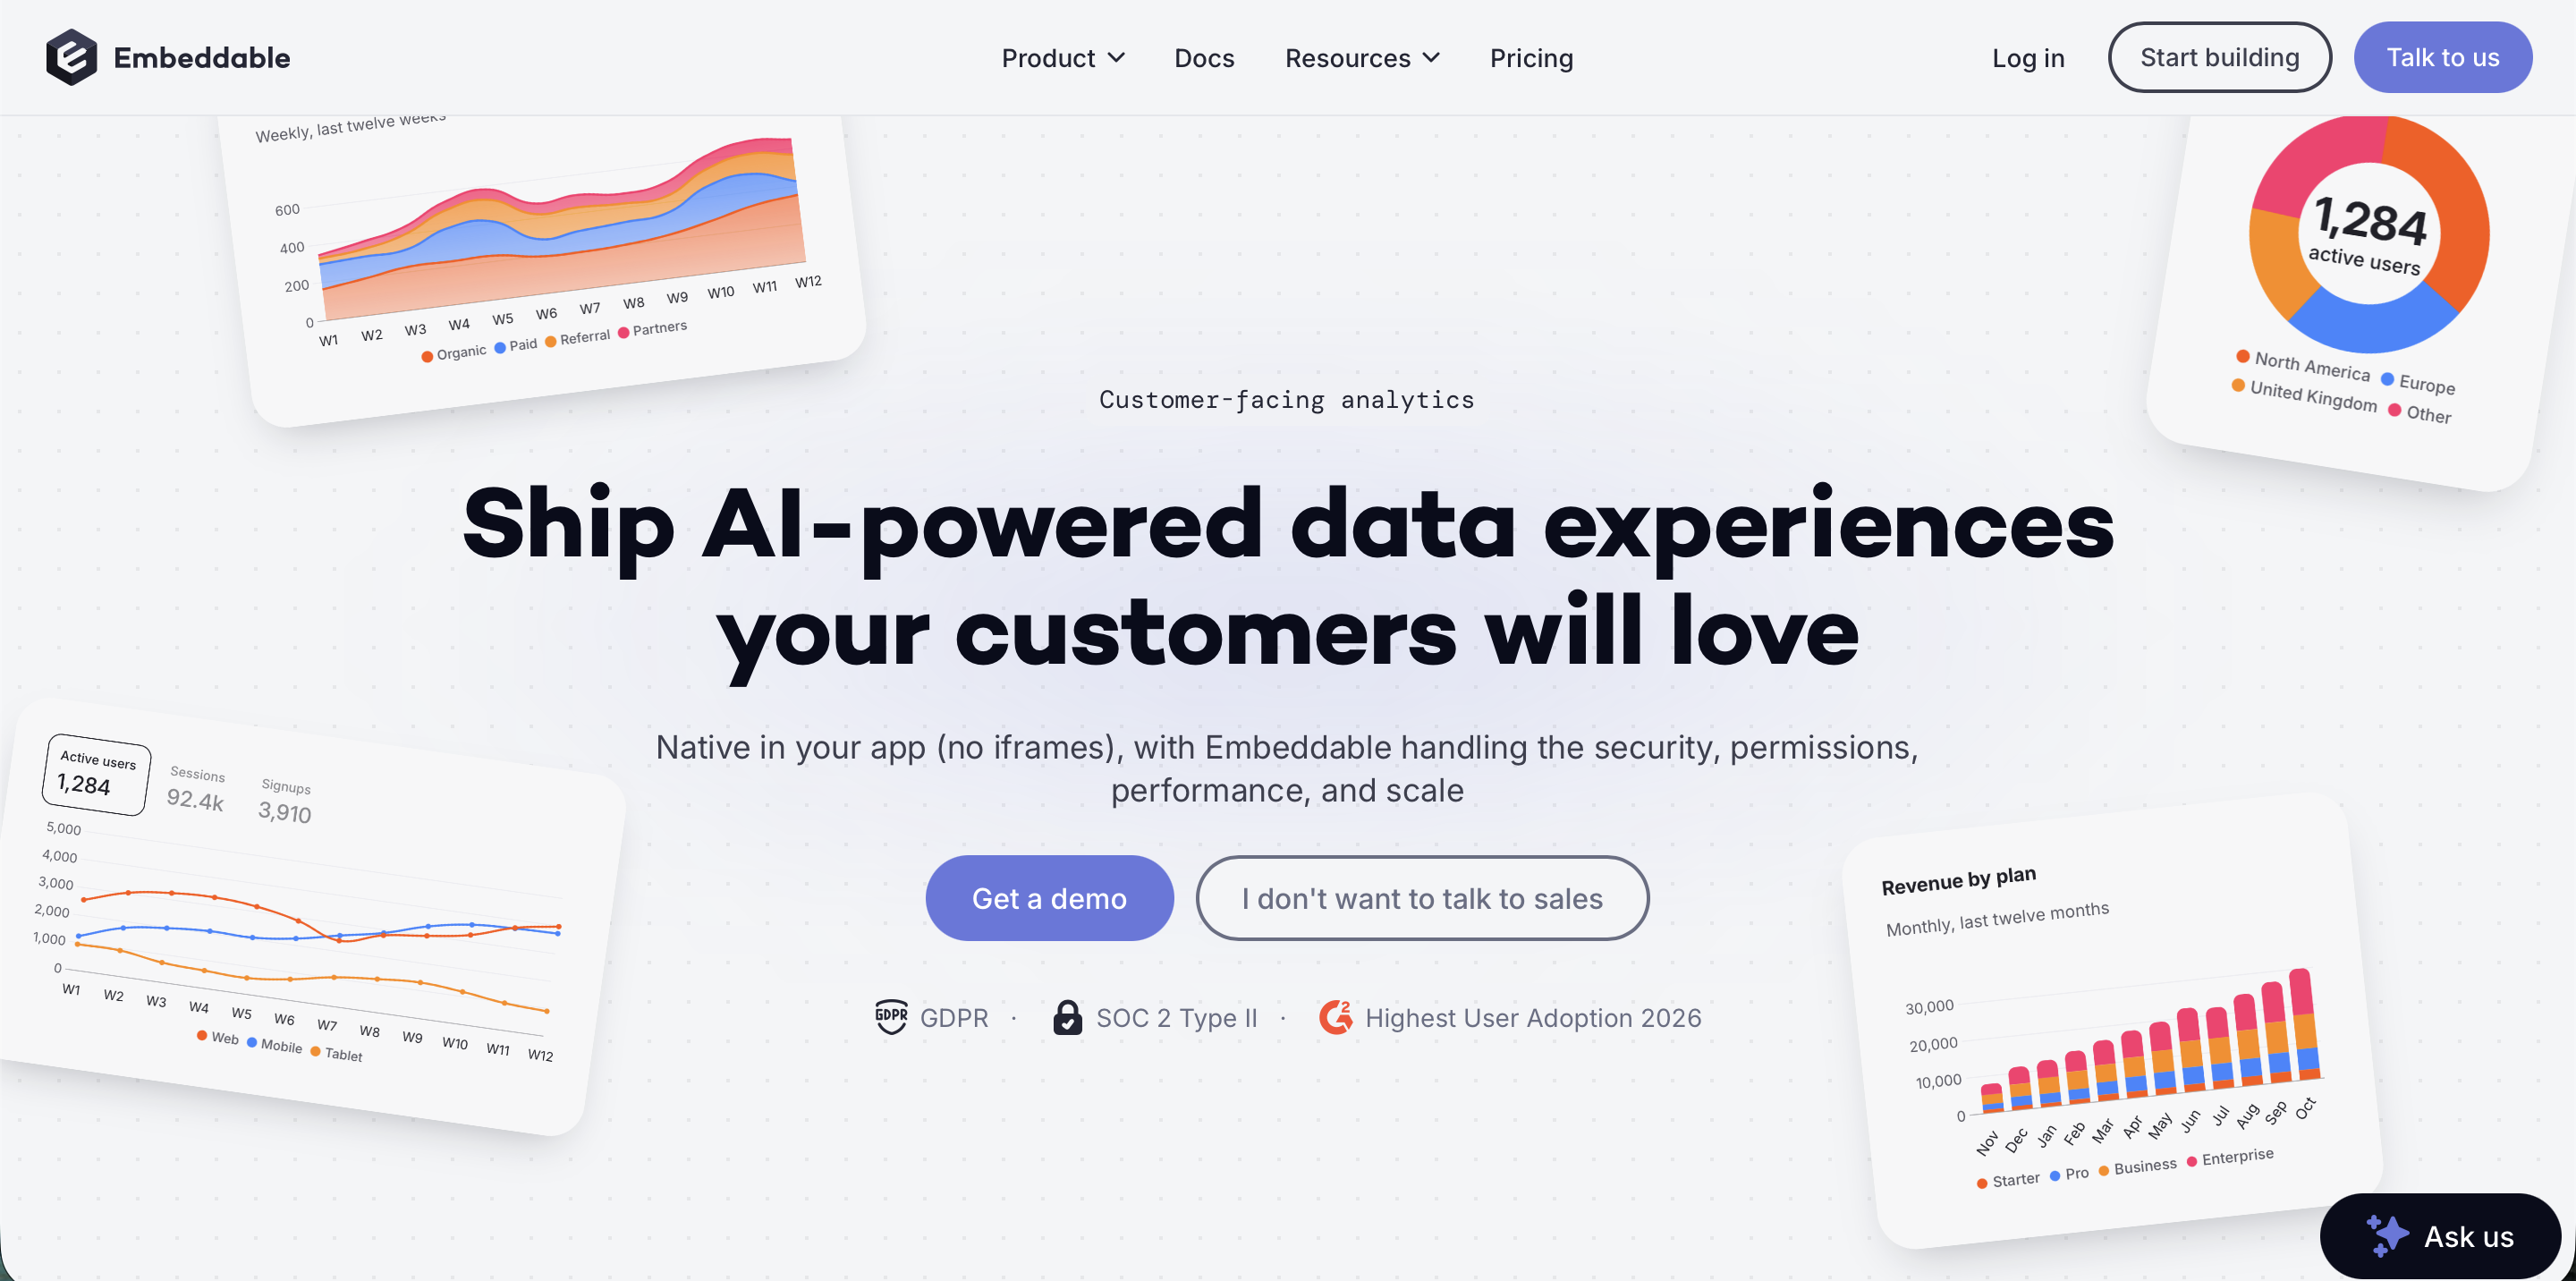
Embeddable is an embedded analytics platform for adding customer-facing dashboards to a software product. It describes itself as a developer toolkit, and it is built for engineering teams that want analytics to look and behave like the rest of their app.
Embeddable is code-first. Your engineers define chart components in React and data models in Cube's modeling language, keep both in your own repository and push them to Embeddable from the command line. Dashboards are then assembled in a no-code builder or written as YAML files, and they embed as a web component in React, Vue, Angular or plain HTML apps, with no iframe (Embeddable development docs).
The platform is made up of five parts.
- Data models. A semantic layer written in the open-source Cube modeling language, where you define metrics, dimensions and joins once and every chart reuses them. Embeddable queries databases such as PostgreSQL, BigQuery, Snowflake and MySQL live, without copying the data.
- Components. Remarkable Pro, an open-source library of React charts and controls, plus any React components your team builds, themed to match your brand.
- Dashboards. Built in a drag-and-drop builder or as files in your repository, then published to development, staging or production and rolled back with saved versions.
- Self-serve. Custom Canvas lets customers build and save their own dashboards from templates you define, and an AI Chatbot for customers is in prototype.
- Embedding and security. A single web component, authorized by a short-lived token from your server that also carries each user's row-level security context.
Embeddable runs on AWS in a US or EU region, holds SOC 2 Type II, and is sold as a flat monthly subscription quoted for each project (Embeddable pricing).
Why do teams look for Embeddable alternatives?
Embeddable's code-first design gives developers a lot of control, and it suits teams with frontend and data engineers to spare. These are the points teams weigh when they compare Embeddable with other tools.
-
Developers lay the foundation. Getting started means cloning Embeddable's starter repository, connecting it to your workspace and pushing components and data models from it with the command line. Remarkable Pro and Embeddable's Claude skills for models, components, dashboards and themes shorten that work. Custom charts, themes and models remain code your team reviews, versions and redeploys.
-
Every chart needs a data model first. Charts query Cube models instead of your tables, so each metric, dimension and join is defined in a model before it can appear on a dashboard. An AI model builder can draft models from SQL queries, but someone still tests and pushes them whenever your schema changes (Embeddable data modeling docs).
-
Customer self-service stays inside your templates. With Custom Canvas, customers build and save their own dashboards, but only from the datasets you enable and the chart templates you define, picking measures and dimensions for each chart (Custom Canvas docs). The docs describe no way for a customer to write a query or keep one as their own.
-
Customer AI chat is still a prototype, and it runs on your LLM key. Embeddable's AI Chatbot answers plain-English questions with text and live charts. Its docs say the feature "is in Prototype and will be released very soon", and the self-serve overview still lists it as coming soon. It calls an LLM provider you connect with your own API key, such as Anthropic, OpenAI or Google, so that provider bills the usage (Embeddable AI Chatbot docs).
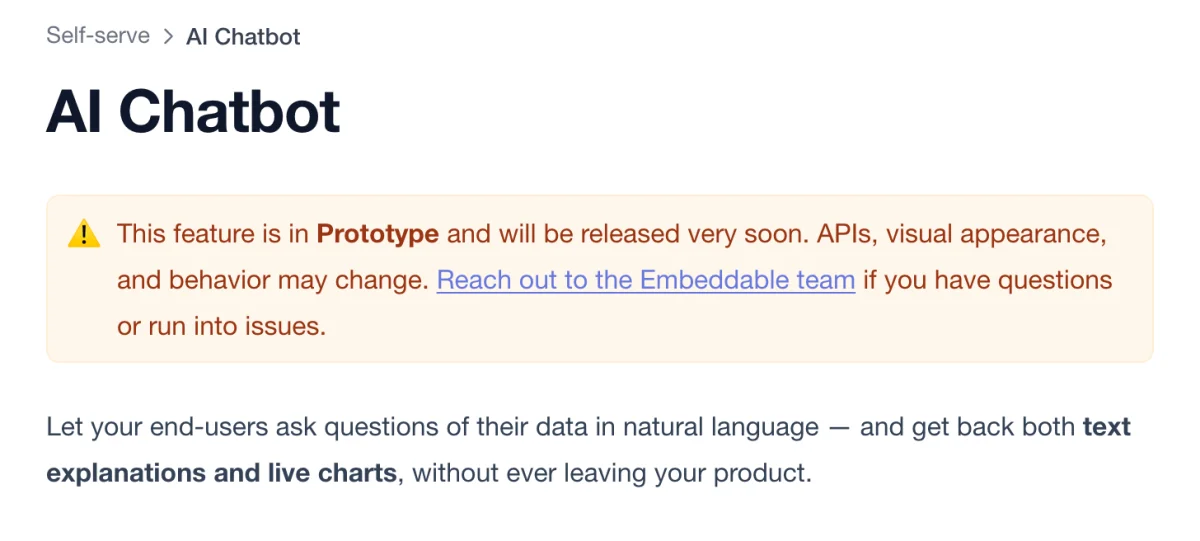
Embeddable's AI Chatbot docs, checked 10 November 2026.
-
Dashboard PDFs need code. Customers can download a single chart as CSV, Excel or PNG. A whole dashboard exports to PDF only through an export API that is still in beta, one dashboard per request, so a "download report" button or a monthly PDF for each customer is something your team builds (Embeddable export docs).
-
The platform runs in Embeddable's cloud. Production runs on AWS, in Frankfurt or US East. You can run its Cube data layer in your own environment, and Embeddable's security page describes no option for hosting the rest of the platform yourself (Embeddable security).
-
Pricing is quote-only. The subscription is priced mainly on project scope after a scoping conversation, so a budget starts with a call (Embeddable pricing). Usage of the AI chatbot is billed separately by your LLM provider.
What should you look for in an Embeddable alternative?
- How much code it takes before customers see a chart. Components and models in your repository, an SDK wired into your backend, or a platform you connect to your database and configure. Each one puts a different amount of work on your team.
- Whether you need a semantic layer. A central model that defines every metric once suits products with many shared KPIs and a data team to maintain it. Building on your tables directly gets the first dashboard live sooner.
- What customers can do on their own. Viewing dashboards, building from templates you prepare, building from any table you allow, saving their own queries and asking an AI are different ceilings. Match the ceiling to what customers already ask your support team for.
- Whether AI is ready, and how it is paid for. Some tools include AI usage in the plan, some sell credits, and some run on an LLM provider account you bring. Check whether the customer-facing AI is generally available or still in preview.
- Where it runs. Vendor-hosted, self-hosted, or both. If data has to stay in your network, ask what self-hosting involves, since a few Docker containers and a Kubernetes cluster are very different jobs.
- Whether the price is published. Flat, per user, per workspace or usage-based, and whether you can see it before a sales call.
What are the best Embeddable alternatives in 2027?
| Tool | Best for | Who runs it | Published price |
|---|---|---|---|
| Draxlr | Teams that want every customer to get a full analytics workspace, with no components or data models to build first | Draxlr, or self-hosted with Docker or on a dedicated server on Enterprise | Yes. $75, $250 and from $500/month, flat, with unlimited viewers |
| Luzmo | Teams that want a hosted embedded dashboard editor with packages for every major frontend framework | Luzmo, with private infrastructure as a quote-only enterprise option | Yes. From €1,995/month billed annually, plus usage |
| Qrvey | SaaS vendors that want unlimited tenants on a flat or perpetual licence inside their own cloud | You, in your own AWS or Azure account, or Qrvey's team manages it there for you | No. Flat-rate or perpetual licence, quoted by email |
| Reveal | .NET, Node.js and Java teams that want a native embedding SDK they can also host themselves | Reveal's cloud, your private cloud, or fully self-hosted, including air-gapped | No. Flat rate with unlimited users, quoted |
| Bold BI | Developer teams that want an embedding SDK with published per-user or per-application pricing | Bold BI's cloud, a Bold BI-managed private cloud, or your own servers | Yes. From $499/month for 100 users self-hosted, $999/month in Bold BI's cloud |
| Sisense | Enterprises that want code-first SDK embedding with on-premise deployment | Sisense's cloud, with your own cloud or on-premise on Enterprise | No. Self-Serve and Enterprise, both on request |
| GoodData | Multi-tenant products that need governed metrics across many customer workspaces | GoodData's cloud, with self-hosting as an Enterprise option | No. Platform fee plus a charge per workspace |
| Embeddable (for reference) | Developer-led teams that want components, data models and dashboards as code in their own repository | Embeddable's cloud on AWS in the US or EU, with only its Cube data layer in your environment | No. Flat monthly subscription, quoted per project |
Draxlr publishes this guide. Details for the other tools come from each vendor's own website, pricing page and documentation, checked between 3 and 6 November 2026.
1. Draxlr
Best for teams that want every customer to get a full analytics workspace, with no components or data models to build first.
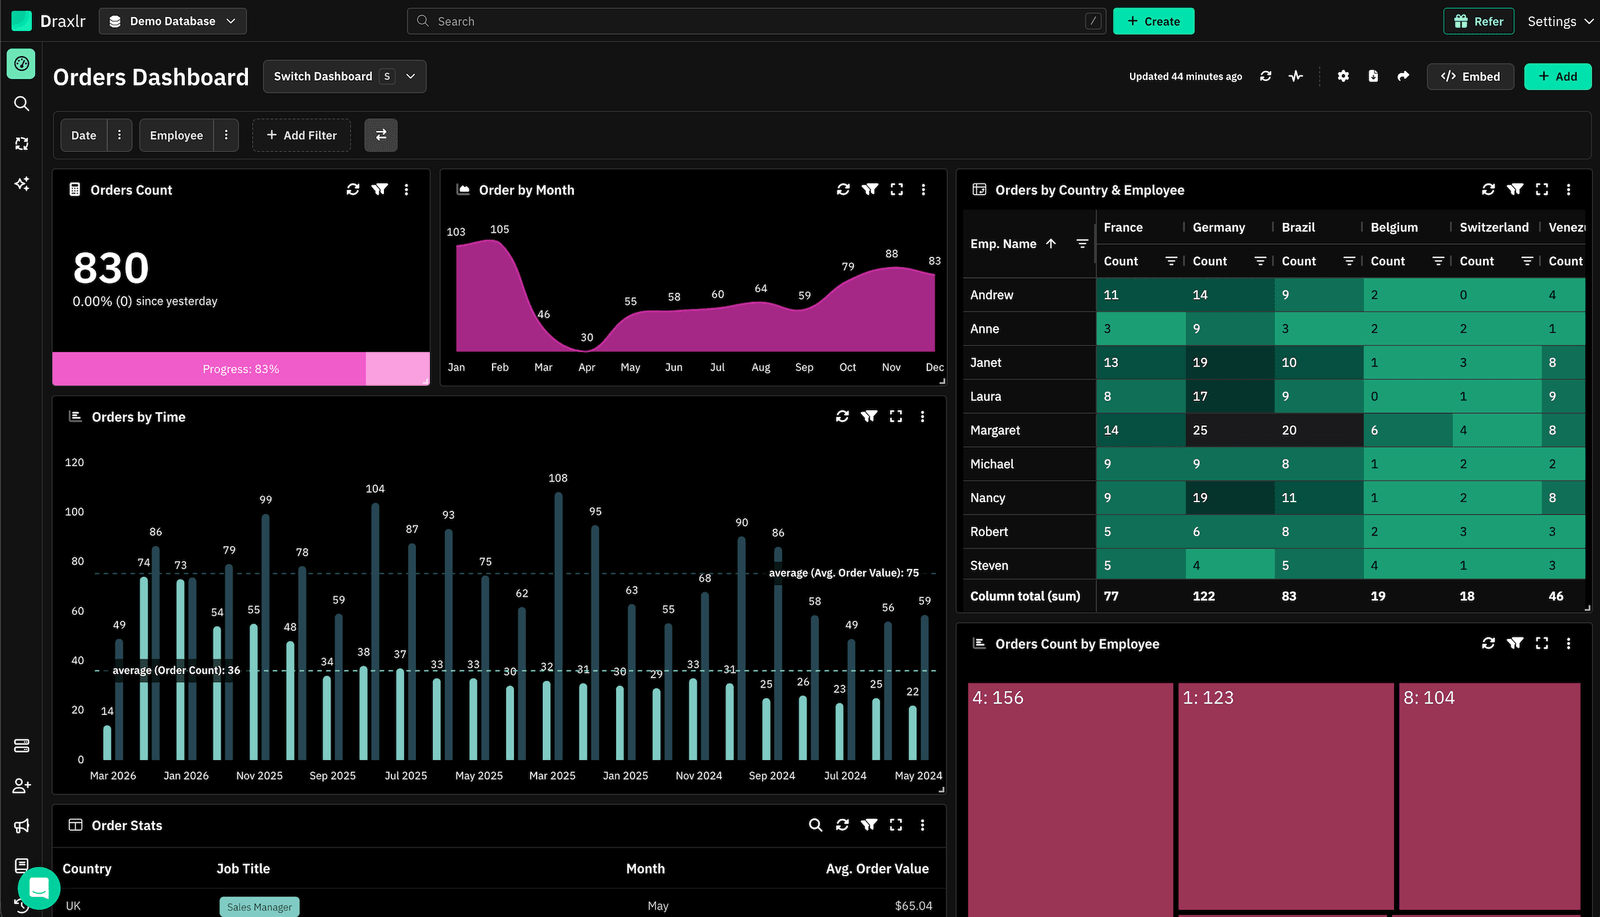
Draxlr is an embedded analytics platform for SQL databases that puts the whole analytics experience inside your product, from a single dashboard to the full Draxlr app. It works on your tables as soon as you connect the database, with no components to build or data models to define first, so dashboards, saved queries and the AI assistant are ready to use from the first day. Everything your customers build is saved in Draxlr for them.
- Customer self-service. Full app embedding gives each customer their own analytics workspace inside your product. A customer who just wants the numbers opens the dashboards you share. One who needs a new report builds it with the no-code query builder, writes it in SQL or asks the AI assistant, then saves it as their own query and adds it to a dashboard of their own. They work from the tables you make available. You choose which of those tools each embed exposes. When a page only needs a fixed view, you can embed a single white-labeled dashboard with filters and drill-downs instead.
- Multi-tenancy. Row-level security keeps each customer to their own data, and you set it up once in Draxlr. You choose which tables each group of customers can see and which rows belong to them, and that applies to every dashboard, saved query and AI answer, whether you embed one dashboard or the full app.
- Hosting. Draxlr hosts the platform and handles every update. If data has to stay inside your own network, you can run it on a dedicated server in the region you choose, or self-host it with Docker on your own cloud or servers.
- AI. Customers ask a question in plain English, and Draxlr AI answers it from their data, shows the query it ran and explains the result. It is available to embedded customers today, each customer only gets answers from their own data, and they can open and adjust the query behind any answer. AI credits come with the plan, so there is no LLM account for you to connect. Your own team can also ask Draxlr questions from Claude, ChatGPT or Cursor and add the answers to dashboards your customers see (Draxlr MCP server).
- Exports. Customers download dashboards as PDF or Excel and chart data as CSV straight from the embed, and you decide which of those downloads each embed offers.
- Pricing. Prices are published and flat, with unlimited customer viewers. Premium is $75/month for white-labeled dashboard embedding. Power is $250/month and adds row-level security and full app embedding. Enterprise starts at $500/month and adds single sign-on, audit logs and self-hosting. You can pay monthly or yearly, and the 7-day free trial gives you the Power plan with no credit card (embedded analytics pricing).
- Head to head. The Draxlr vs Embeddable comparison sets the two side by side on setup work, data models, customer self-service, AI and pricing.
- Watch out for. Draxlr connects to SQL databases and data warehouses such as PostgreSQL, MySQL, SQL Server, Snowflake, BigQuery and Databricks, plus Airtable and Excel or CSV uploads, so data held anywhere else has to be moved into SQL first. Row-level security and full app embedding need the Power plan. AI usage comes from one monthly allowance shared by all your customers, 300 credits on Power with 200 more for $10. Credits only count AI questions, so customers can keep using the query builder and SQL editor after the allowance runs out.
2. Luzmo
Best for teams that want a hosted embedded dashboard editor with packages for every major frontend framework.
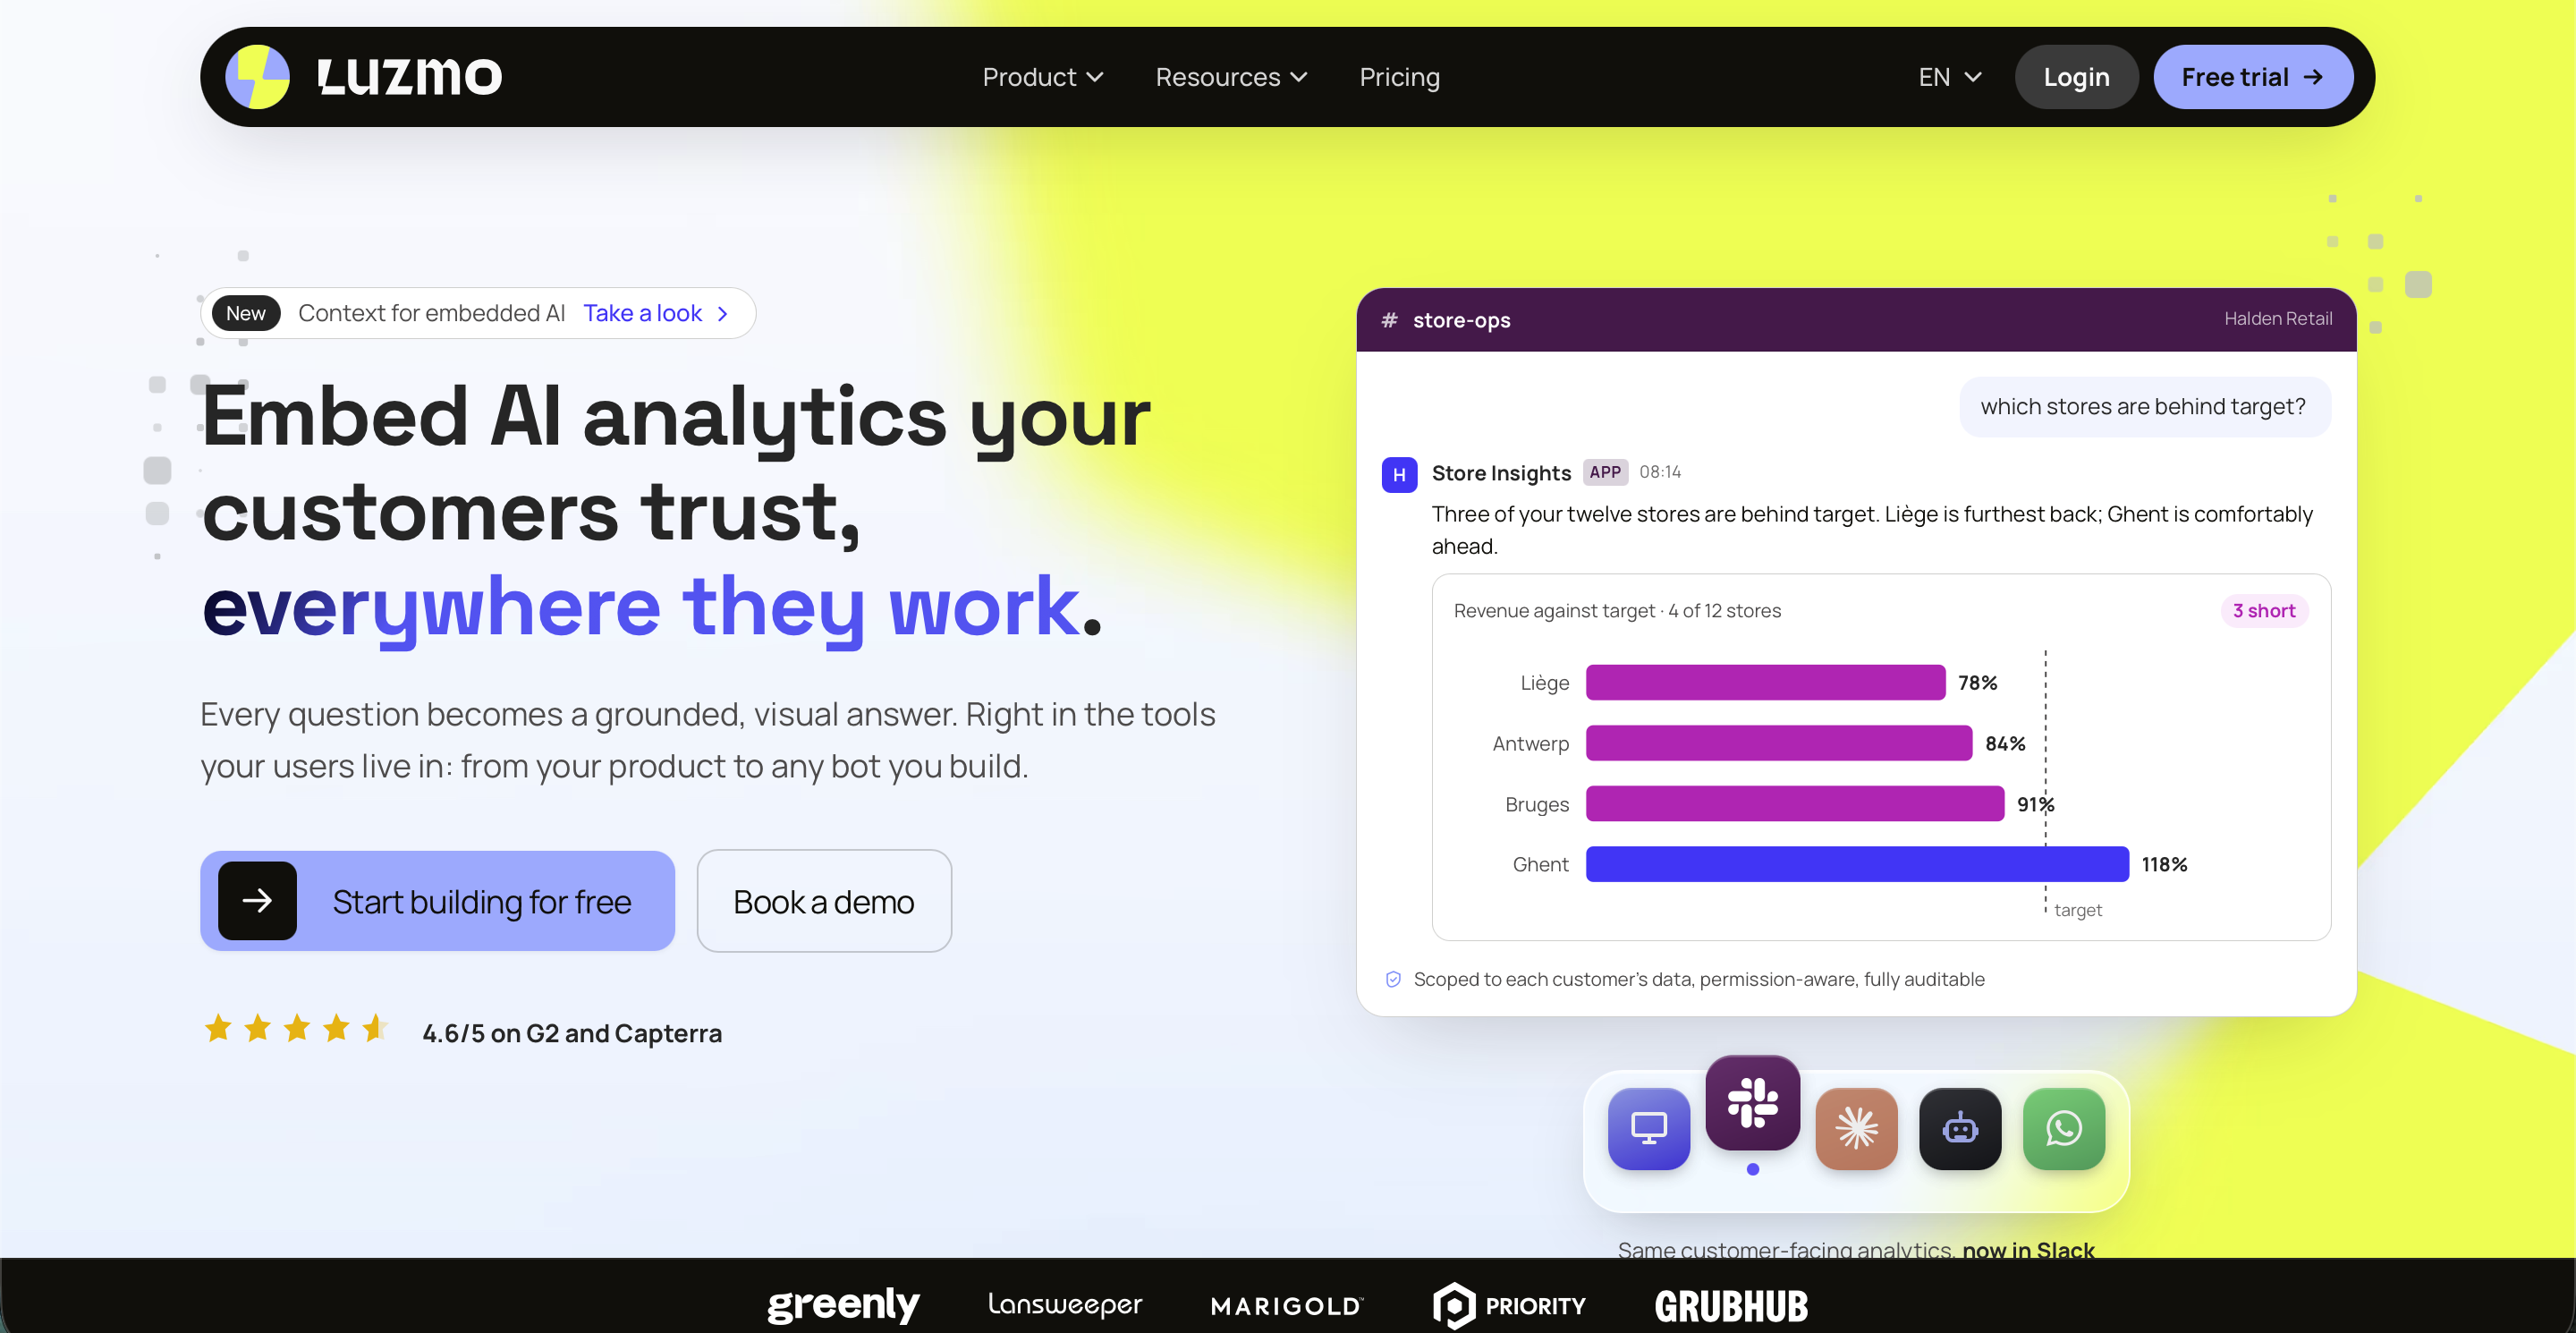
Luzmo is a hosted embedded analytics platform that, like Embeddable, embeds without an iframe. Dashboards render as a web component, with packages for React, Vue, Angular and React Native, and your backend only generates an embed token. Datasets and dashboards are built in Luzmo's own editor instead of your repository, and developers can still build custom charts when the built-in ones aren't enough.
- Customer self-service. Customers create, edit and clone dashboards in an embedded drag-and-drop editor, upload and join their own data, and add fields of their own. SQL for datasets stays on your team's side, in Luzmo's dataset and query panels.
- Multi-tenancy. Parameter filters are set on the dataset and overridden per user in the embed token, so a customer can't remove them in the editor. Connection overrides can point each tenant at its own database, and Luzmo says the same token scope applies to AI answers (Luzmo multi-tenant docs).
- Hosting. Luzmo hosts it. Private infrastructure, a custom SLA and source-code escrow are a quote-only enterprise deployment.
- AI. Luzmo IQ answers plain-language questions with charts inside your product, and an MCP server and agent API take the same answers into Claude, ChatGPT and your own bots. The licence includes 500 AI conversations a month.
- Pricing. One plan, "Embedded Everywhere", from €1,995/month billed annually. Usage is billed on top, with 500 AI conversations and 100 million Warp rows a month included and some contracts scaling on monthly active users instead. The free trial runs 10 days (Luzmo pricing).
- Watch out for. Usage on top of the platform fee makes the bill harder to forecast than Embeddable's flat subscription. Customers build on datasets your team prepares and don't get a SQL editor or saved queries of their own, which is the sharpest difference in a head-to-head with Draxlr.
3. Qrvey
Best for SaaS vendors that want unlimited tenants on a flat or perpetual licence inside their own cloud.
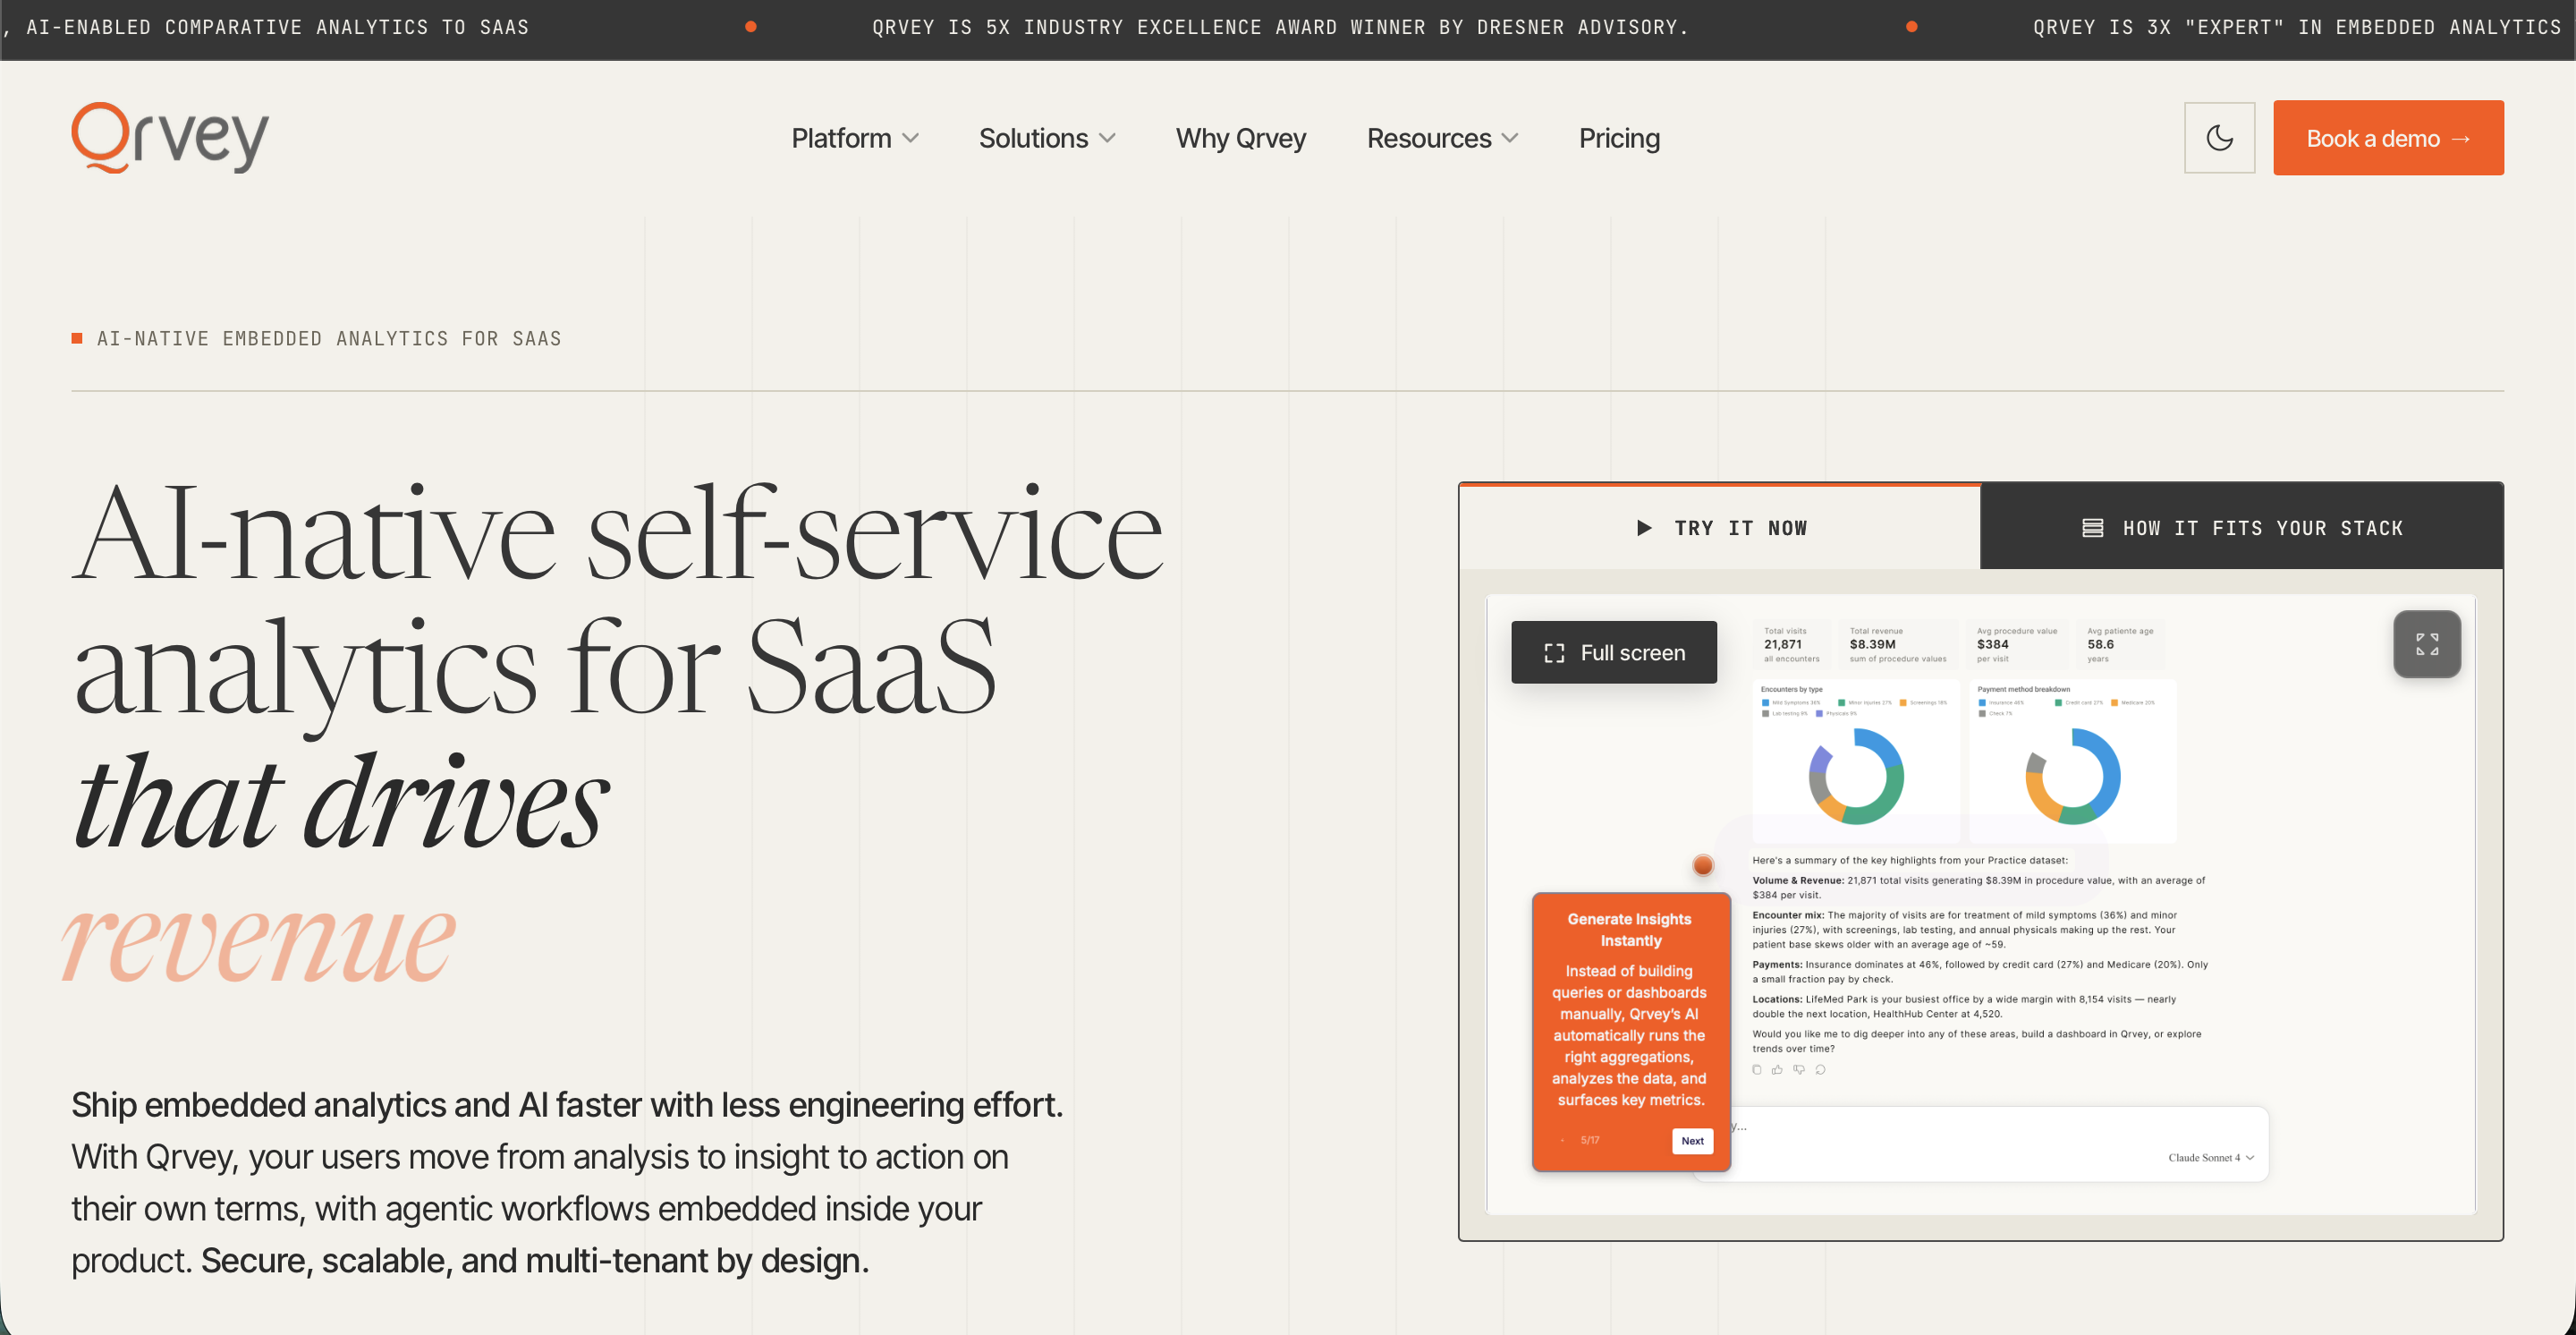
Qrvey is an embedded analytics platform that runs in your own cloud account instead of the vendor's. It installs with Terraform into AWS or Azure as a complete platform, and embeds as web-component widgets authenticated with a security token your backend requests from Qrvey's API (Qrvey quickstart).
- Customer self-service. Customers build dashboards with a drag-and-drop chart builder, custom formulas and custom datasets, design pixel-perfect reports and set up alerts and triggers in a no-code workflow builder.
- Multi-tenancy. Qrvey describes security at the row, column, object, asset and feature level, and record-level security is enforced through the token your backend generates.
- Hosting. On AWS that means an EKS cluster, a PostgreSQL database and a search cluster in your account, with at least 56 vCPUs of EC2 quota, and Qrvey warns that an upgrade can take up to two hours of downtime (Qrvey AWS deployment docs). Its Managed Infrastructure package puts Qrvey's DevOps team in charge of monitoring, patches and upgrades inside your account.
- AI. Sidekick and Qrvey's AI agents run through its MCP server on an LLM provider you connect, such as OpenAI, Azure OpenAI or Claude in Amazon Bedrock, so that provider bills the usage, as it does with Embeddable's chatbot (Qrvey AI docs).
- Pricing. Not published. Qrvey Pro and Qrvey Ultra are flat-rate with unlimited tenants, users and dashboards, both are available as a perpetual licence, and a quote arrives by email within 24 hours (Qrvey pricing).
- Watch out for. Pro queries six SQL sources live through Live Connect, and loading MongoDB, S3 files or API data into Qrvey's own engine needs Ultra. Running that stack in your account is the trade-off most Qrvey alternatives evaluations turn on.
4. Reveal
Best for .NET, Node.js and Java teams that want a native embedding SDK they can also host themselves.
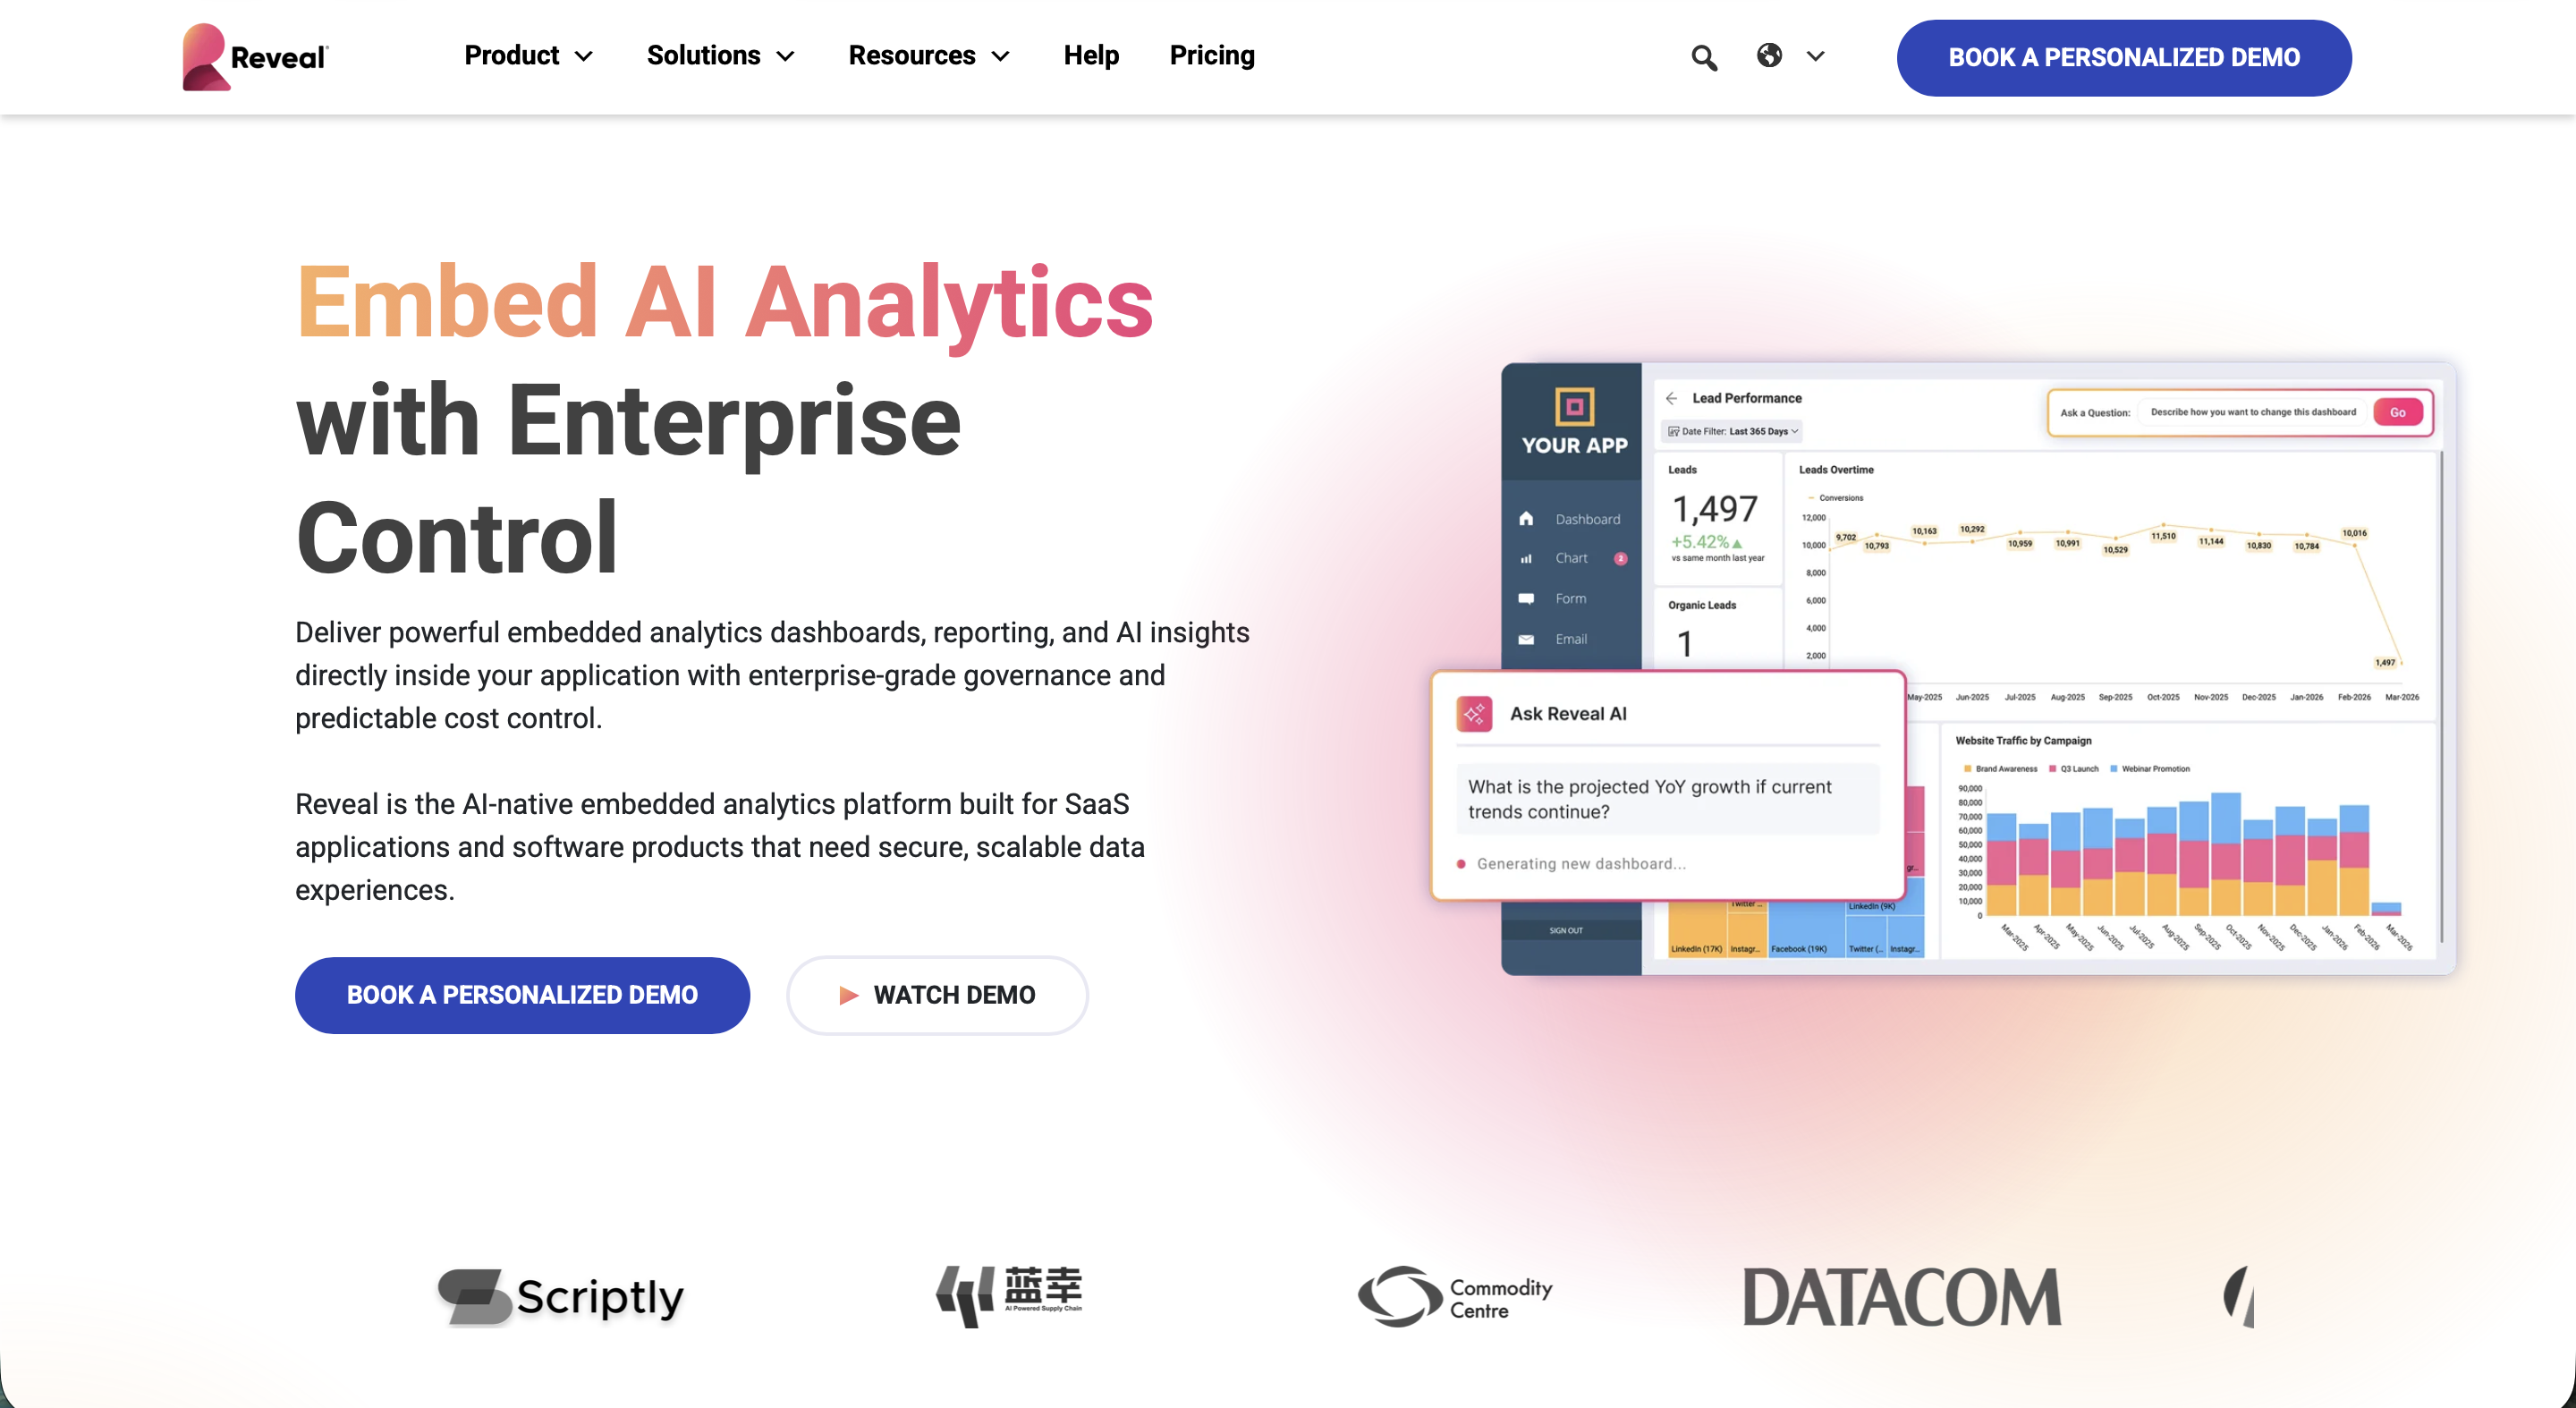
Reveal, made by Infragistics, embeds natively without iframes, like Embeddable, but the work sits in your backend instead of a components repository. Your developers install Reveal's server package in an ASP.NET Core, Node.js or Java backend and its JavaScript client in your frontend, which works with React, Angular, Vue, Blazor and Windows Forms apps. It connects to more than 30 data sources, including MongoDB, Elasticsearch and REST APIs.
- Customer self-service. Customers edit dashboards and add visualizations and calculated fields on the data sources your server code exposes. Custom SQL is set in your server code, and the docs describe no way for a customer to write a query or keep one as their own (Reveal custom queries docs).
- Multi-tenancy. Reveal enforces tenant isolation as each query runs, with the rules supplied by your server code. A user context provider passes who is signed in, an object filter hides tables a user shouldn't see, and data source callbacks point each tenant at its own database (Reveal user context docs).
- Hosting. Reveal says it runs cloud-hosted, in a private cloud or fully self-hosted, including air-gapped environments, which goes further than Embeddable's US and EU cloud regions.
- AI. Like Embeddable's chatbot, Reveal AI runs on an LLM account you bring, through provider packages for OpenAI, Azure OpenAI, Anthropic or Google Gemini, or any OpenAI-compatible endpoint. Its AI chat answers questions and can generate dashboards, and the Node.js and Java AI servers are still marked as preview (Reveal AI requirements).
- Pricing. Not published. Reveal sells one flat rate with unlimited users and no extra embed cost per added customer, with every connector and white labeling included and a 30-day SDK trial (Reveal pricing).
- Watch out for. Dashboards are saved as files on the Reveal server by default, and Reveal's docs say the SDK "does not provide a Save As implementation", so storage and save logic are code your team writes (Reveal saving docs). That backend work is what most Reveal BI alternatives evaluations weigh.
5. Bold BI
Best for developer teams that want an embedding SDK with published per-user or per-application pricing.
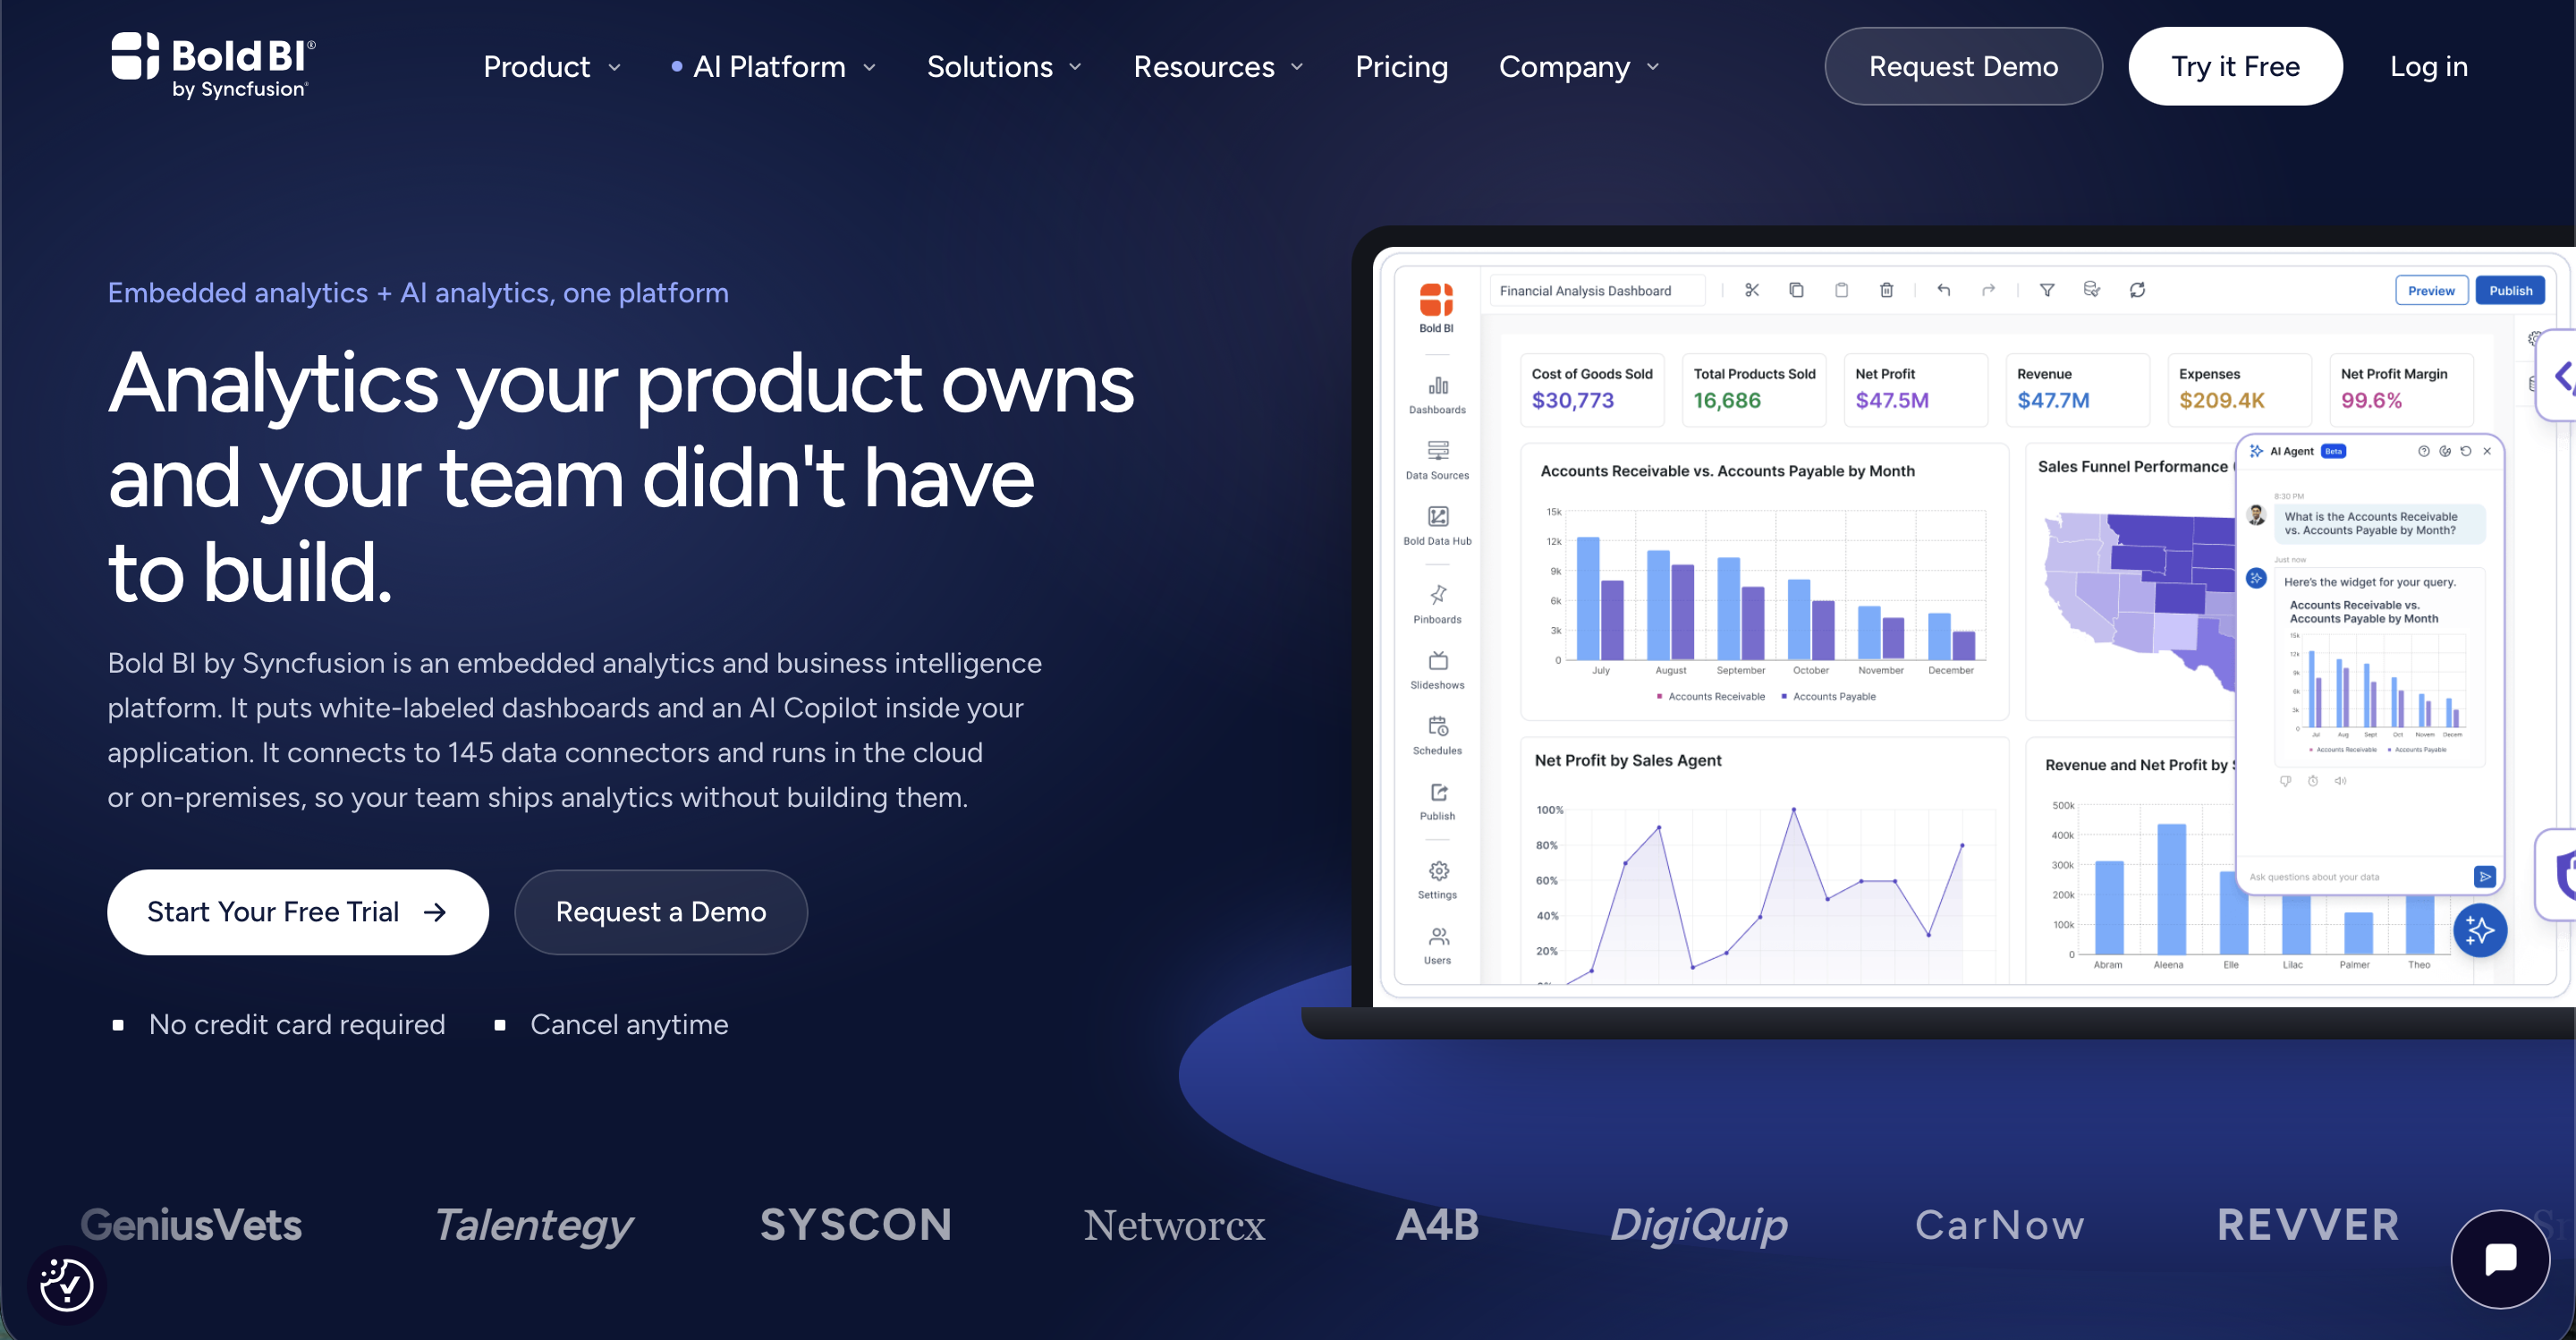
Bold BI, from Syncfusion, is a developer-focused embedded analytics platform with published prices and the choice of running in its cloud or on your own servers. Its JavaScript SDK installs from npm and renders dashboards inside your app's own DOM, with React, Angular, Vue, .NET and Blazor named as supported frameworks, and an iframe is available when you want less code (Bold BI embedded analytics).
- Customer self-service. Dashboards are built in the Dashboard Designer, where AI Copilot turns a plain-English request into a chart and Prompt to Dashboard builds a six-widget starter dashboard from one prompt. When customers need more than one dashboard, Full Server Embedding puts the whole Bold BI platform inside an iframe in your app.
- Multi-tenancy. Row-level security is enforced at query time through JWT claims, in up to three layers of isolation code, custom attributes and user-based filters. One instance can serve many isolated tenants, each with its own database, on Managed Private Cloud and On-Premises. Bold BI states that its Cloud Edition does not support multi-tenancy.
- Hosting. Cloud Edition is hosted by Bold BI, Managed Private Cloud is operated by Bold BI in a region you choose, and On-Premises runs on your own Windows, Linux, Docker or Kubernetes servers, including air-gapped ones.
- AI. AI features use credits, sold at $40 per 1,000. On On-Premises you can use your own OpenAI, Azure OpenAI or Anthropic key instead, while Cloud Edition uses Bold BI's own AI service.
- Pricing. Published. On-Premises starts at $499/month for 100 users plus $3 for each additional user, Cloud Edition at $999/month for 100 users plus $5 per user, and per-application pricing for unlimited users is $1,999/month on your own servers. Managed Private Cloud is quoted, every edition includes white-labeling, row-level security and scheduled reports, and the free trial runs 30 days with no credit card (Bold BI pricing).
- Watch out for. Cloud Edition doesn't support Bold BI's multi-tenant setup, where each tenant gets an isolated database, so that needs On-Premises or the quote-only Managed Private Cloud, although row-level security works on every edition. Per-user pricing grows with every customer user unless you move to per-application licensing on your own servers, and AI credits are bought separately from the licence.
6. Sisense
Best for enterprises that want code-first SDK embedding with on-premise deployment.
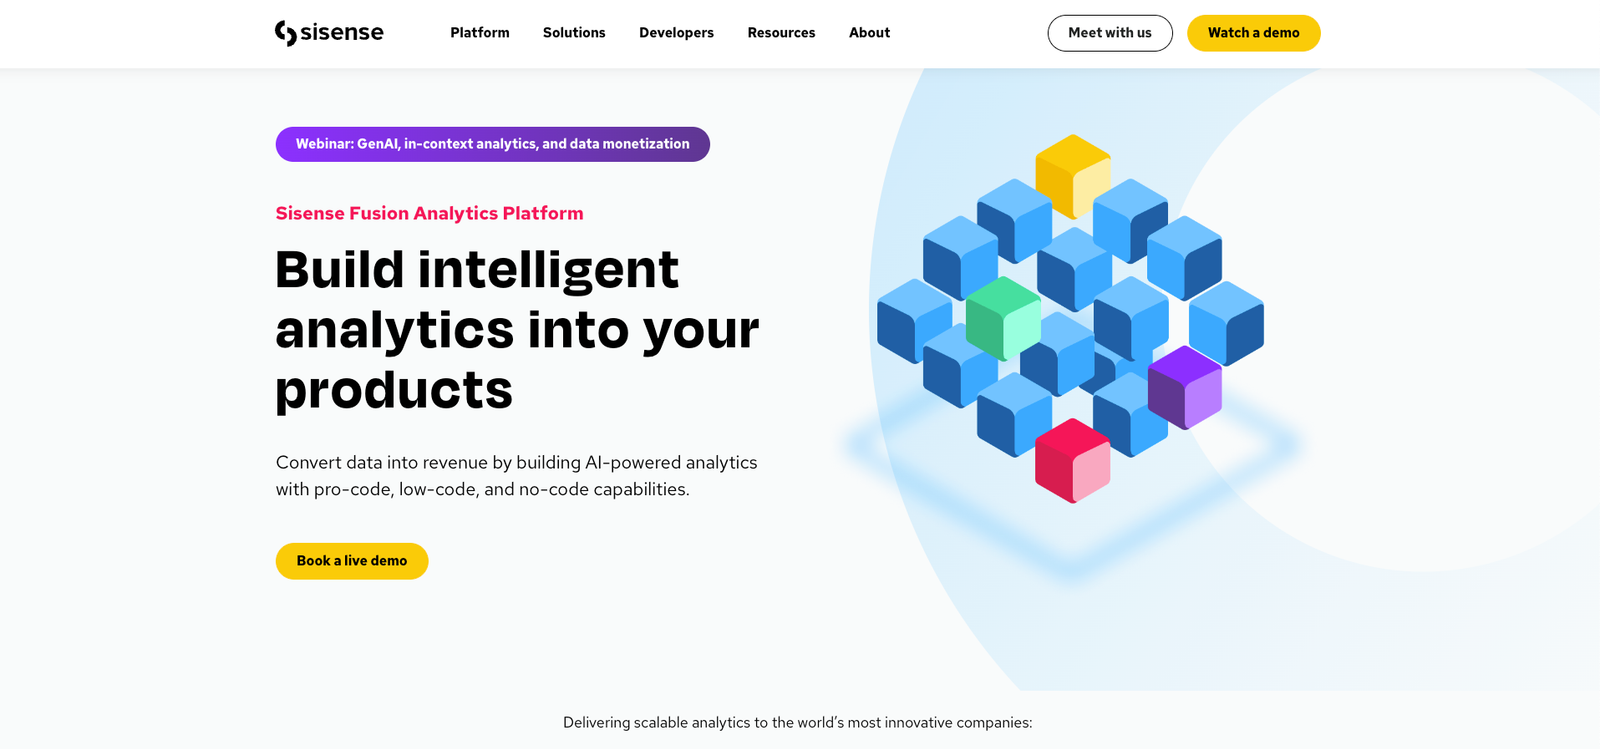
Sisense is an enterprise analytics platform with a code-first embedding SDK. Its Compose SDK lets developers embed an existing Sisense dashboard, customise one, or build one entirely in code, in React, Angular or Vue with TypeScript, against data models defined in Sisense (Sisense Compose SDK docs). Iframe embedding is available too.
- Customer self-service. Customers explore dashboards and build widgets, depending on the roles you give them, and Self-Serve includes natural-language queries, auto-narratives and an assistant your customers can use.
- Multi-tenancy. Data security rules give row-level access, and Enterprise adds a native multi-tenant architecture, column-level security and an SSO Router.
- Hosting. Sisense cloud on Self-Serve. Enterprise adds your own cloud on AWS, Azure or GCP, and on-premise deployment.
- AI. Enterprise lets you bring your own LLM alongside the Sisense Intelligence suite.
- Pricing. Not published. The plans page lists Self-Serve, which has a free trial, and Enterprise, which is built to your specification (Sisense plans).
- Watch out for. The Compose SDK needs a Sisense instance behind it, so you run or rent a full BI platform as well as the code you write. Native multitenancy, full white-labeling and on-premise deployment all sit on the quote-only Enterprise plan.
7. GoodData
Best for multi-tenant products that need governed metrics across many customer workspaces.
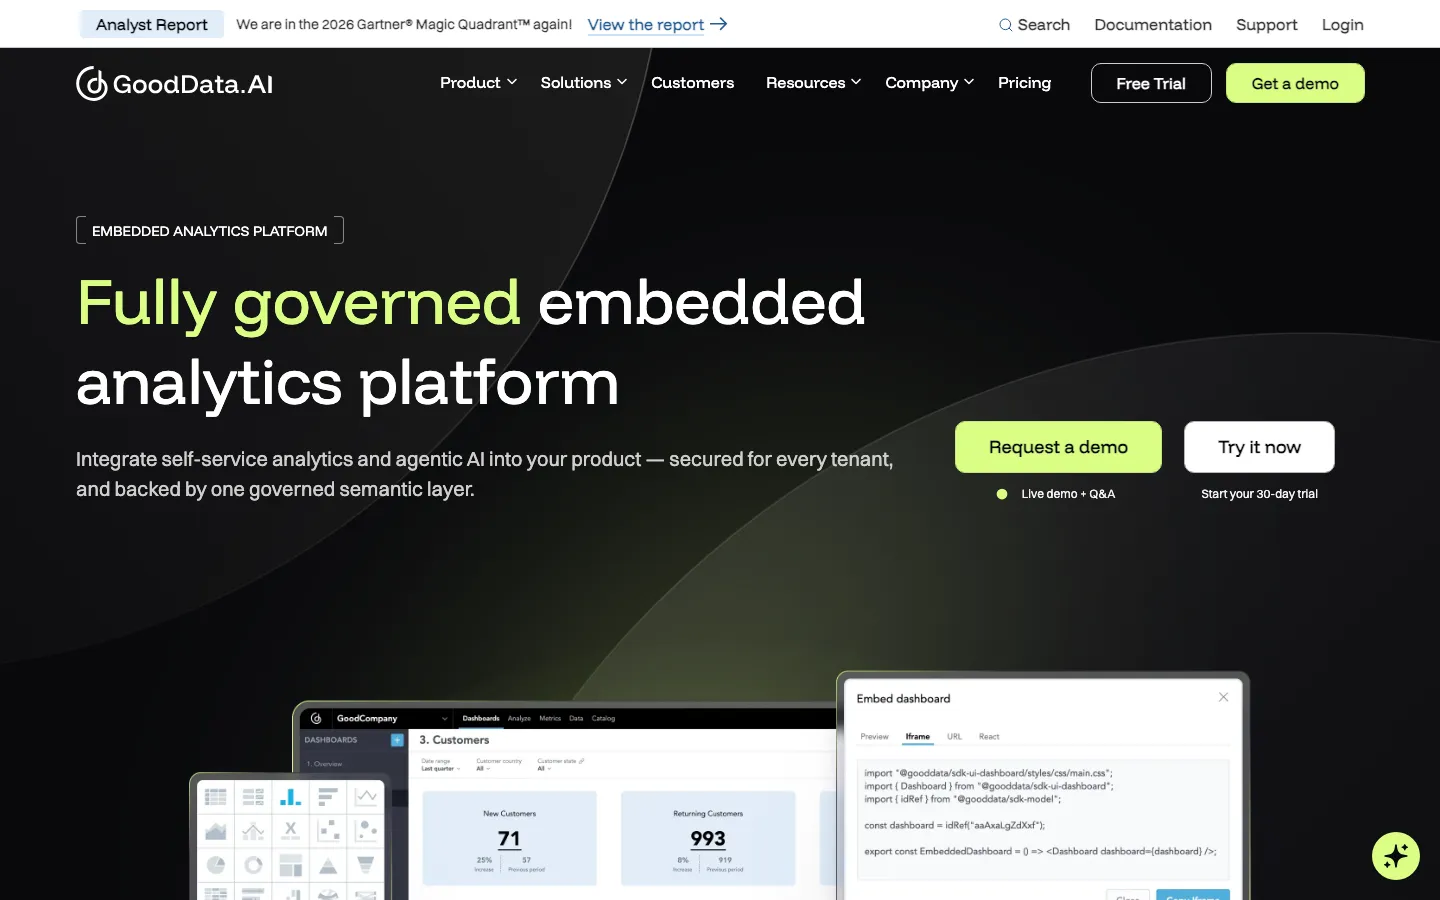
GoodData shares Embeddable's semantic-layer approach and scales it across tenants. It is an API-first analytics platform that gives each customer a workspace of their own, with a React SDK and a Python SDK for your developers.
- Customer self-service. Customers get unlimited self-service reports and dashboards inside their own workspace.
- Multi-tenancy. Multitenancy is built in with hierarchical workspaces, and data filters limit what each workspace and user can see.
- Hosting. GoodData's cloud, with self-hosted deployment as an on-demand Enterprise option.
- AI. An AI assistant, an agent builder and an MCP server are part of the platform.
- Pricing. Not published. Professional is a platform fee plus a charge per workspace, with unlimited users and data, and Enterprise adds governance and self-hosting (GoodData pricing).
- Watch out for. The bill rises with every tenant workspace you add, and, as with Embeddable's Cube models, your team builds a semantic data model before customers see a chart.
Explo still shows up on Embeddable shortlists as a developer-friendly embedding option. Omni acquired it on 22 October 2025 and said it would spend the following 12 months moving Explo customers onto Omni (Omni announcement), so a new project on Explo means planning a second migration.
Which Embeddable alternative is right for you?
| If you need | Start with |
|---|---|
| A complete analytics workspace for every customer, with saved queries, a no-code query builder and AI that's ready today, on your SQL database with no models or components to build | Draxlr (Power plan) |
| A hosted embedded dashboard editor with packages for React, Vue, Angular and React Native | Luzmo |
| Unlimited tenants on a perpetual licence, running in your own AWS or Azure account | Qrvey |
| A native SDK in a .NET, Node.js or Java backend, with air-gapped self-hosting or a Windows Forms client | Reveal |
| An embedding SDK with a published self-hosted price | Bold BI |
| Enterprise SDK embedding with on-premise deployment | Sisense |
| Governed metrics across many tenant workspaces | GoodData |
| Every chart written as your own React component, dashboards versioned in your repository, and a Cube semantic layer your data team already maintains | Stay on Embeddable |
What is the best Embeddable alternative?
For most teams looking beyond Embeddable, the best alternative is Draxlr. Your customers get more than dashboards assembled from templates. Each one opens a complete analytics workspace inside your product, builds reports from your tables with a no-code query builder, a SQL editor or the AI assistant, and saves them as their own queries and dashboards. Your developers skip the components project, the data models and the push-and-publish workflow, because Draxlr works on your database as soon as it is connected and embeds with a snippet. The AI assistant is ready today with credits included in the plan, row-level security is a permission configured once, and if data must stay inside your network, the Enterprise plan self-hosts with Docker. Pricing is published and flat with unlimited customer viewers, from $75/month for white-labeled dashboard embedding and $250/month for row-level security and full app embedding.
Pick another tool when one requirement outweighs the rest. Luzmo suits teams that want a hosted dashboard editor with packages for every major framework, and Qrvey fits unlimited tenants on a perpetual licence in your own cloud. Reveal suits .NET, Node.js and Java teams that want a native SDK they can host themselves, Bold BI suits developers who want an SDK with a published self-hosted price, Sisense fits enterprise SDK embedding with on-premise deployment and GoodData fits governed metrics across many workspaces.
Whichever you shortlist, test it against your real database, your tenant model and the number of customers you expect before you sign.
FAQs
1. What is Embeddable?
Embeddable is a developer toolkit for building customer-facing analytics into a software product. Engineers define React chart components and Cube data models in their own repository and push them to Embeddable, and dashboards are built in a no-code builder or written as YAML files. Dashboards embed as a web component without an iframe, row-level security is driven by the security context in a short-lived token, and Custom Canvas lets customers build their own dashboards from templates you define. Embeddable hosts the platform on AWS in a US or EU region.
2. How much does Embeddable cost?
Embeddable doesn't publish prices. Its pricing page describes a flat monthly subscription with unlimited usage and every feature included, priced mainly on project scope after a short scoping conversation, with Startup, Scale-up and Enterprise packages. Monthly active users, dashboard views and query volume aren't the main pricing driver, and evaluation starts with a supported proof-of-concept phase. If you use its AI chatbot, budget separately for the LLM provider it runs on.
3. Who are Embeddable's main competitors?
Embeddable's main competitors in embedded analytics are Draxlr, Luzmo, Qrvey, Reveal, Bold BI, Sisense and GoodData. Of these, Draxlr is the pick when you want each customer to get a full analytics workspace without building components and data models first, because it works on your SQL database as soon as it is connected and gives customers saved queries, a no-code query builder and a built-in AI assistant.
4. Which Embeddable alternatives don't need developers to build the analytics?
Draxlr, Luzmo and Qrvey are configured instead of coded. Draxlr connects to your SQL database and builds on its tables directly, Luzmo builds dashboards in a hosted editor on datasets you add in its interface, and Qrvey's datasets and dashboards are built in its own no-code tools, although Qrvey itself is installed and run in your cloud account. Reveal, Bold BI, Sisense and GoodData keep more of the work in code, through server SDKs, frontend SDKs or semantic models, much like Embeddable.
5. Does Embeddable have AI chat for customers?
Embeddable's AI Chatbot lets customers ask questions in plain language and get answers as text and live charts, and it can add or edit charts on their Custom Canvas. As of November 2026 its docs mark the chatbot as a prototype that "will be released very soon" and its AI Endpoints as beta. It runs on an LLM provider you connect with your own API key, such as Anthropic, OpenAI, Google, Mistral, Amazon Bedrock or Ollama, so that provider bills the usage. Among the alternatives, Draxlr's AI assistant is already available to embedded customers with credits included in the plan, 300 a month on Power with 200 more for $10, and Luzmo includes 500 AI conversations a month in its licence.
6. Which Embeddable alternatives let customers build their own dashboards?
All of them, with different limits. Draxlr customers build dashboards from queries they create with a no-code query builder, the AI assistant or a SQL editor, and keep those queries as their own. Luzmo customers create and edit dashboards in an embedded editor and can upload their own data, and Qrvey customers use a drag-and-drop builder with custom formulas and datasets. Reveal and Sisense let customers edit dashboards and add visualizations depending on the permissions you give them, and GoodData gives each customer self-service reports and dashboards in their own workspace. In Embeddable, Custom Canvas lets customers build dashboards from the datasets and chart templates you define.
7. Is there a self-hosted Embeddable alternative?
Yes. Embeddable runs its platform in its own cloud on AWS, in a US or EU region, and lets you run its Cube data layer in your own environment. Draxlr's Enterprise plan self-hosts with Docker on your own cloud or servers, or runs on a dedicated server in the region you choose. Reveal says it can be fully self-hosted, including air-gapped environments, Bold BI On-Premises runs on your own Windows, Linux, Docker or Kubernetes servers, Qrvey installs into your own AWS or Azure account, and Sisense offers on-premise deployment on Enterprise.
8. How hard is it to move from Embeddable to another tool?
Embeddable's components and data models live in your own repository, and dashboards live there as YAML files or in Embeddable's builder, so plan to rebuild your most-used dashboards in the new tool. Moving to Draxlr mostly means removing work. You connect the same databases your Embeddable connections use, rebuild dashboards with the query builder or the AI assistant, using the SQL in your Cube models as a reference, set up row-level security to match your security filters, and swap the <em-beddable> web component for Draxlr's HTML snippet or its React or Vue package. Once the last customer has moved, the components project and data models can be retired.
About the author

Ameena is the co-founder of Draxlr, a modern embedded analytics platform focused on making data analysis simpler and faster. She writes about embedded analytics, databases, SQL, dashboards, and building scalable data products for modern teams.
If you have questions about anything in this guide, or want to compare options for your specific stack, you can try Draxlr free, or reach out directly through the Draxlr team.