Best Bold BI Alternatives in 2026
Explore the best Bold BI alternatives in 2026. Compare features, pricing, AI capabilities, self-service analytics, and SQL flexibility to find the right BI platform for your team.

Finding the right Bold BI alternative can change how your team builds dashboards, runs analytics, and gets data into the hands of people who need it. Bold BI is a capable platform, but it is not the right fit for every team. Pricing transparency, setup complexity, SQL flexibility, and ease of use for non-technical users all come up regularly when teams start looking elsewhere.
If you are evaluating your options in 2026, this guide covers the best alternatives with enough context to help you make the right call for your situation.
Why consider a Bold BI alternative?
Bold BI has a solid feature set and a high overall satisfaction rating across review platforms. That said, a consistent set of frustrations shows up in G2, Capterra, and Gartner Peer Insights reviews. If any of these sound familiar, it may be worth looking at what else is out there.
1. Data source schema changes are clunky
Once you create a data source in Bold BI, adding new fields later means going back into the configuration manually. Users flag this regularly, noting that you need to think through your data model upfront. If your schema changes down the line, the update process feels cumbersome rather than straightforward. Teams working with fast-moving datasets tend to feel this friction most.
2. Performance degrades with large datasets
This is the most common technical complaint across review platforms. Dashboards that load quickly at first often become noticeably slow as data volumes grow. Getting performance back requires deliberate optimization work on your end. Teams that have scaled into Bold BI over time tend to notice this more than those who started with large data from the beginning.
3. Specific visualization gaps
Bold BI has 40+ chart types, but users point to specific missing capabilities. Bar charts cannot show a different color per category in a single-series view, and map visualizations are described as limited for many real-world use cases. These are not edge cases. When a chart type cannot do what you need it to do, you end up working around it rather than with it.
4. No published pricing
Bold BI does not list pricing publicly. Plans are custom-quoted based on deployment type and user count, with a 30-day free trial available. If you want to know whether it fits your budget before getting on a sales call, you cannot. That adds friction when you are comparing multiple tools at the same time.
5. Mobile experience lags behind desktop
Bold BI has a mobile app, but reviewers note that it does not match the desktop experience in terms of polish and interaction quality. For teams where stakeholders check dashboards on their phones, this gap is noticeable.
What to look for in a Bold BI alternative
1. AI-powered querying
The tools worth considering in 2026 let non-technical users ask questions in plain English and get answers without writing SQL. A solid text-to-SQL layer removes the analyst bottleneck that most BI teams run into as the organization grows.
2. Direct database connectivity
Your alternative should connect straight to your existing databases whether that is PostgreSQL, MySQL, BigQuery, Snowflake, or Redshift, without needing a separate data layer or ETL pipeline in between.
3. Transparent pricing
If you cannot see the price on the website, budgeting becomes guesswork. Look for a tool with published tiers so you know what you are getting into before the sales process starts.
4. Sharing and alerts
From public dashboard URLs to team sharing and scheduled email and Slack alerts, the ability to get data to people without them logging in every time matters more than most teams expect.
5. Visualization flexibility
A good SQL data visualization tool should support the chart types you actually need and let you customize them without jumping through hoops.
6. Performance at scale
Check how each option handles large datasets and concurrent users before committing. Slow dashboards frustrate users and erode confidence in the data.
7. Support quality and product pace
A team that responds quickly and ships regularly matters. Smaller, focused vendors often move faster and give you better access than large enterprise platforms do.
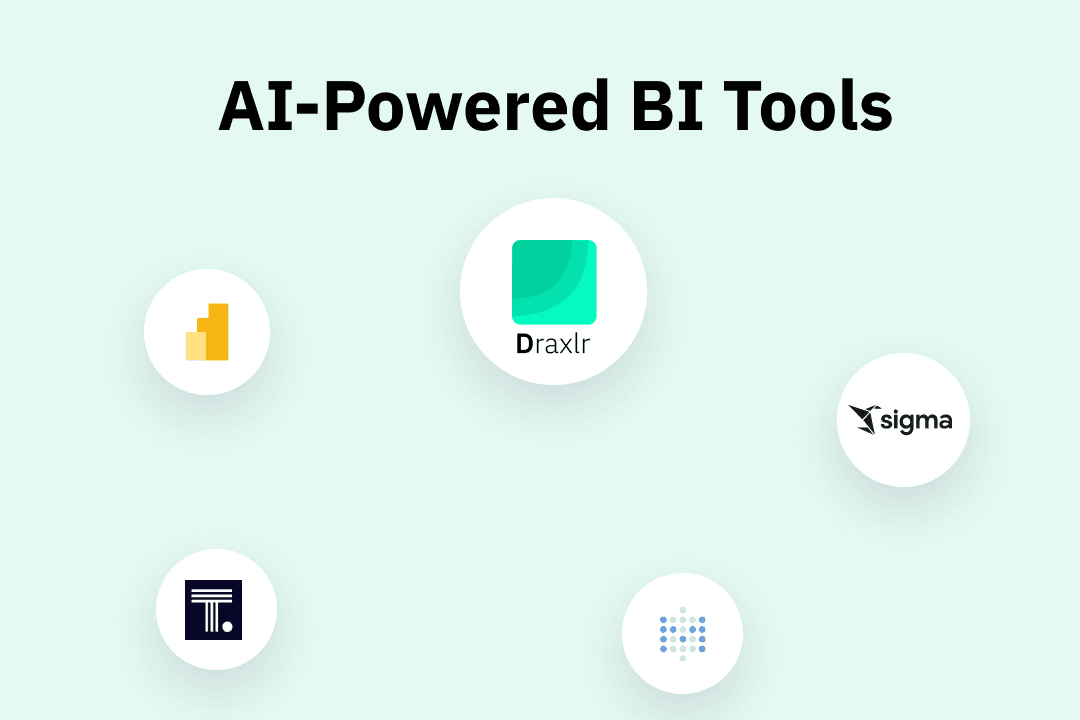
Best Bold BI alternatives in 2026 at a glance
| Tool | Best for | Ease of use | AI capabilities | Starting price |
|---|---|---|---|---|
| Bold BI | Enterprise BI and dashboards | Medium | Moderate | Custom (quote-based) |
| Draxlr | AI-powered self-service BI for SQL teams | High | Good | From $25/month |
| Tableau | Enterprise visualization | Medium | Moderate | From $15/user/month (billed annually) |
| Microsoft Power BI | Microsoft ecosystem analytics | Medium | Moderate | $14/user/month (billed annually) |
| ThoughtSpot | AI-powered search and natural language analytics | High | Strong | From $50/user/month (atleast 25 users, billed annually) |
| Metabase | Simple internal dashboards | High | Good | Free or $500/month |
| Qlik Sense | Self-service analytics for large enterprises | Medium | Moderate | From $300/month |
1. Draxlr
Best Bold BI Alternative for Teams That Want AI-Powered Self-Service Analytics
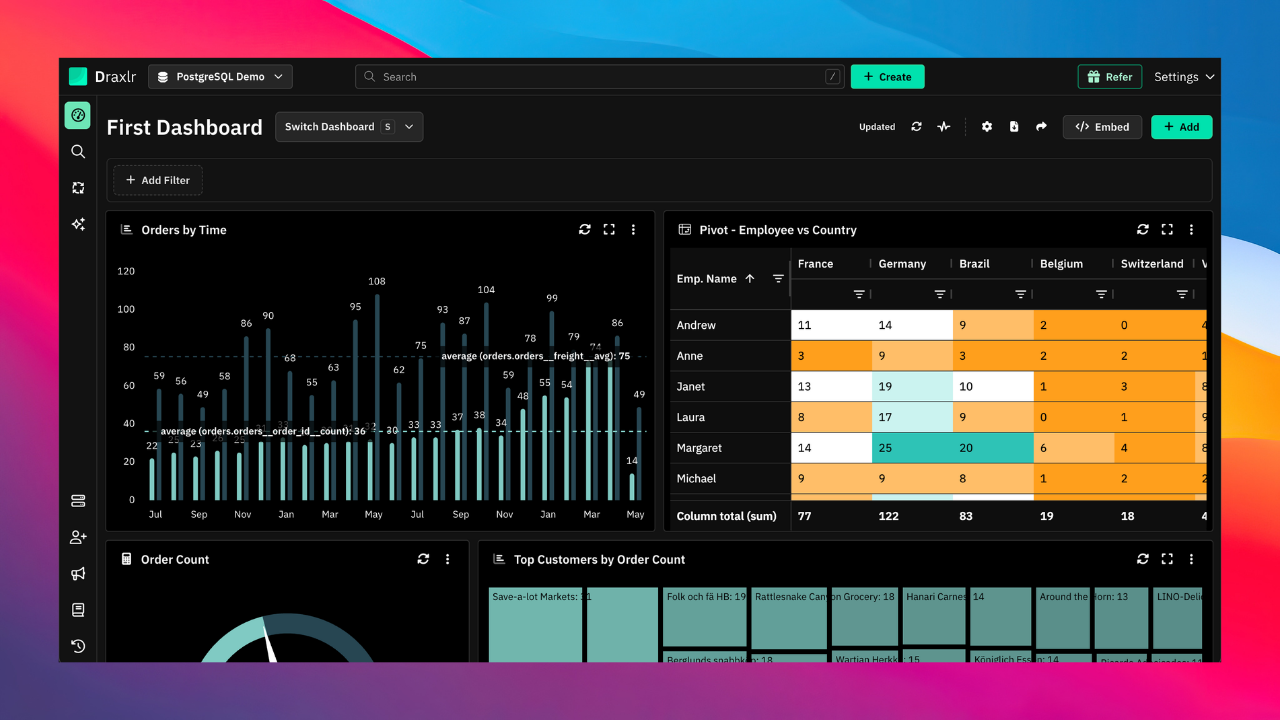
Draxlr is a SQL-native, AI-powered tool built for teams that want to move from database connection to working dashboard without a heavy setup process or a steep learning curve. Both data engineers and non-technical business users can get answers on their own without routing every question through a developer.
You get three ways to query your data. A visual query builder for point-and-click filtering and aggregation, a full SQL editor for complex joins and custom logic, and an AI text-to-SQL layer that converts plain English into executable queries. Analysts get full SQL control while operations and product teams can self-serve without writing a single line of code.
Draxlr connects directly to 14+ SQL databases including PostgreSQL, MySQL, Snowflake, BigQuery, Redshift, ClickHouse, Databricks, and more. No data warehouse migration or ETL pipeline required. You connect and query from your existing setup.
For teams building customer-facing analytics, Draxlr supports embedded dashboards via iframe, React SDK, Vue SDK, and Backend APIs. You can filter data per customer, apply row-level security for multi-tenant setups, and white-label the experience to match your product. Embedding starts at $75/month with flat pricing and no per-viewer fees.
Connect your DatabaseKey Features
- Text-to-SQL AI that converts plain English into executable queries with no SQL skills required
- Visual query builder for filtering, sorting, joining, and summarizing data across tables
- Full SQL editor for advanced users who need complete query control
- 14+ direct database connections including PostgreSQL, MySQL, Snowflake, BigQuery, and Redshift
- Multiple chart types with flexible visualization customization
- Embedded analytics via iframe, React SDK, and Vue SDK with per-customer data filtering and multi-tenant row-level security
- White-label and self-hosted options for full branding and infrastructure control
- Dashboard sharing via public URLs, team access, and scheduled email or Slack delivery
- Automated alerts triggered by data changes or threshold crossings
- Transparent pricing from $25/month
Pricing
Draxlr offers a free plan with no credit card required. Paid plans start at $25/month and cover team dashboards, AI querying, and direct database connections. Embedding starts at $75/month with unlimited customer users. Enterprise and self-hosted plans are available for teams that need SSO, dedicated support, or full infrastructure control.
2. Tableau
Best Bold BI Alternative for Enterprise Visualization
Tableau is one of the most widely used enterprise analytics platforms. Large analytics teams reach for it when they need deep visual storytelling, complex data blending, and executive-level reporting. If sophisticated visualization is the primary requirement and budget is not a constraint, Tableau is hard to beat.
Key Features
- Drag-and-drop visualization builder with a wide chart library
- Data blending across multiple sources
- Forecasting, trend analysis, and predictive modeling
- Tableau Prep for data transformation
- Enterprise-grade security and governance
- Large ecosystem of extensions and connectors
Pricing
Tableau has four plans billed annually. Standard starts at $15/user/month and covers authoring, Tableau Desktop, Prep Builder, and Tableau Pulse. Enterprise is $35/user/month and adds advanced data and access management. Tableau Cloud+ and the Tableau+ Bundle are both contact-sales only. For most teams, Standard or Enterprise is where you start.
3. Microsoft Power BI
Best Bold BI Alternative for Microsoft Ecosystem Teams
Microsoft Power BI is the natural choice for organizations already running on Azure, Excel, Microsoft 365, or Dynamics. If Microsoft infrastructure is already the standard at your company, Power BI slots in without much friction. If you are evaluating a broader set of options, our Power BI alternatives guide is worth reading alongside this one.
Key Features
- Deep integration with Azure, Excel, and Microsoft 365
- Drag-and-drop report builder
- AI-powered visuals and natural language Q&A
- Power BI Embedded for application integration
- DirectQuery and Import modes for data connectivity
- Row-level security and governance controls
Pricing
Power BI also has plans billed annually. Pro starts at $14/user/month. Advanced features like AI Copilot and higher refresh rates require Power BI Premium, which adds significant cost. Embedded use cases layer on further licensing complexity.
4. ThoughtSpot
Best Bold BI Alternative for Natural Language Analytics
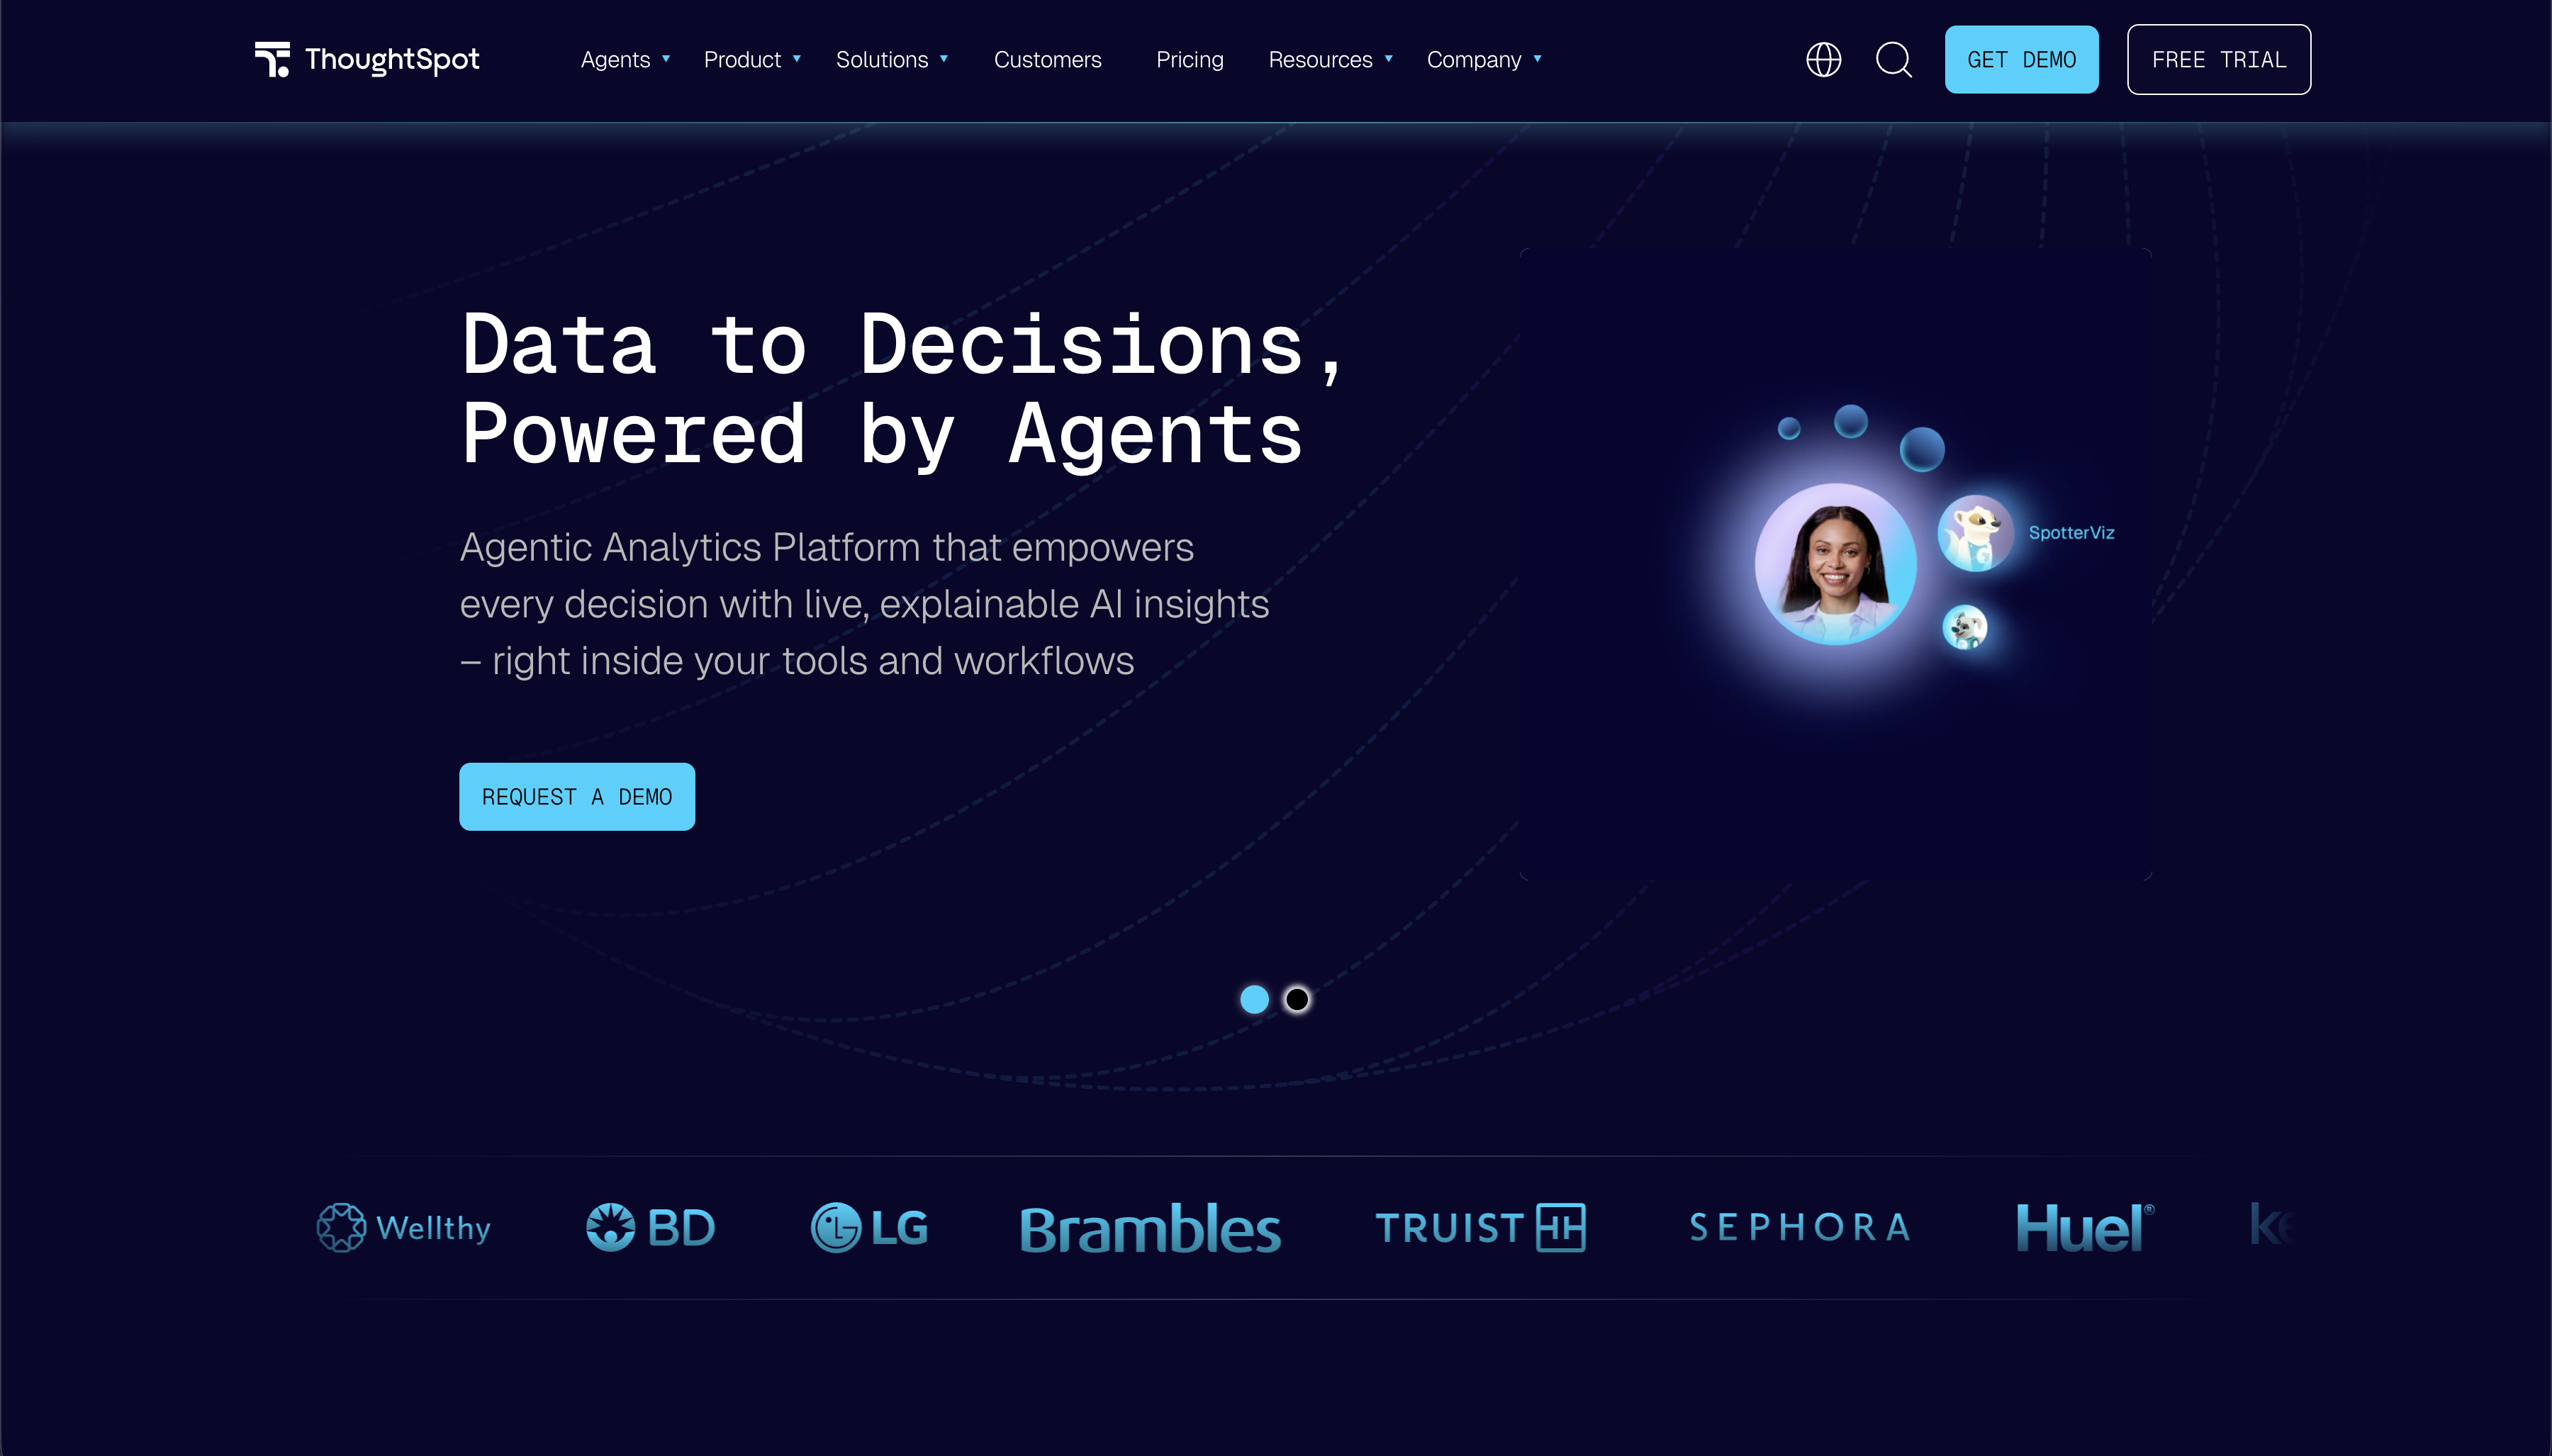
ThoughtSpot is built around the idea that anyone in the organization should be able to get answers from data by typing a question, the same way you would search on Google. Its natural language search sits on top of your cloud data warehouse and returns charts and insights without the user needing to know SQL or build a dashboard first. If you have already looked at ThoughtSpot and want to compare it further, our ThoughtSpot alternatives guide covers how it stacks up against other options.
Key Features
- Natural language search that returns charts and answers instantly
- AI agents for automated analysis and follow-up questions
- Live query to Snowflake, Databricks, BigQuery, and other warehouses
- SpotIQ automated insight detection
- Embedded analytics for product teams
- Row-level security and enterprise governance
Pricing
ThoughtSpot publishes its pricing. The Pro plan starts at $50/user/month with a minimum of 25 users and it is billed annually. The embedding plan is custom.
5. Metabase
Best Open-Source Bold BI Alternative for Developer Teams
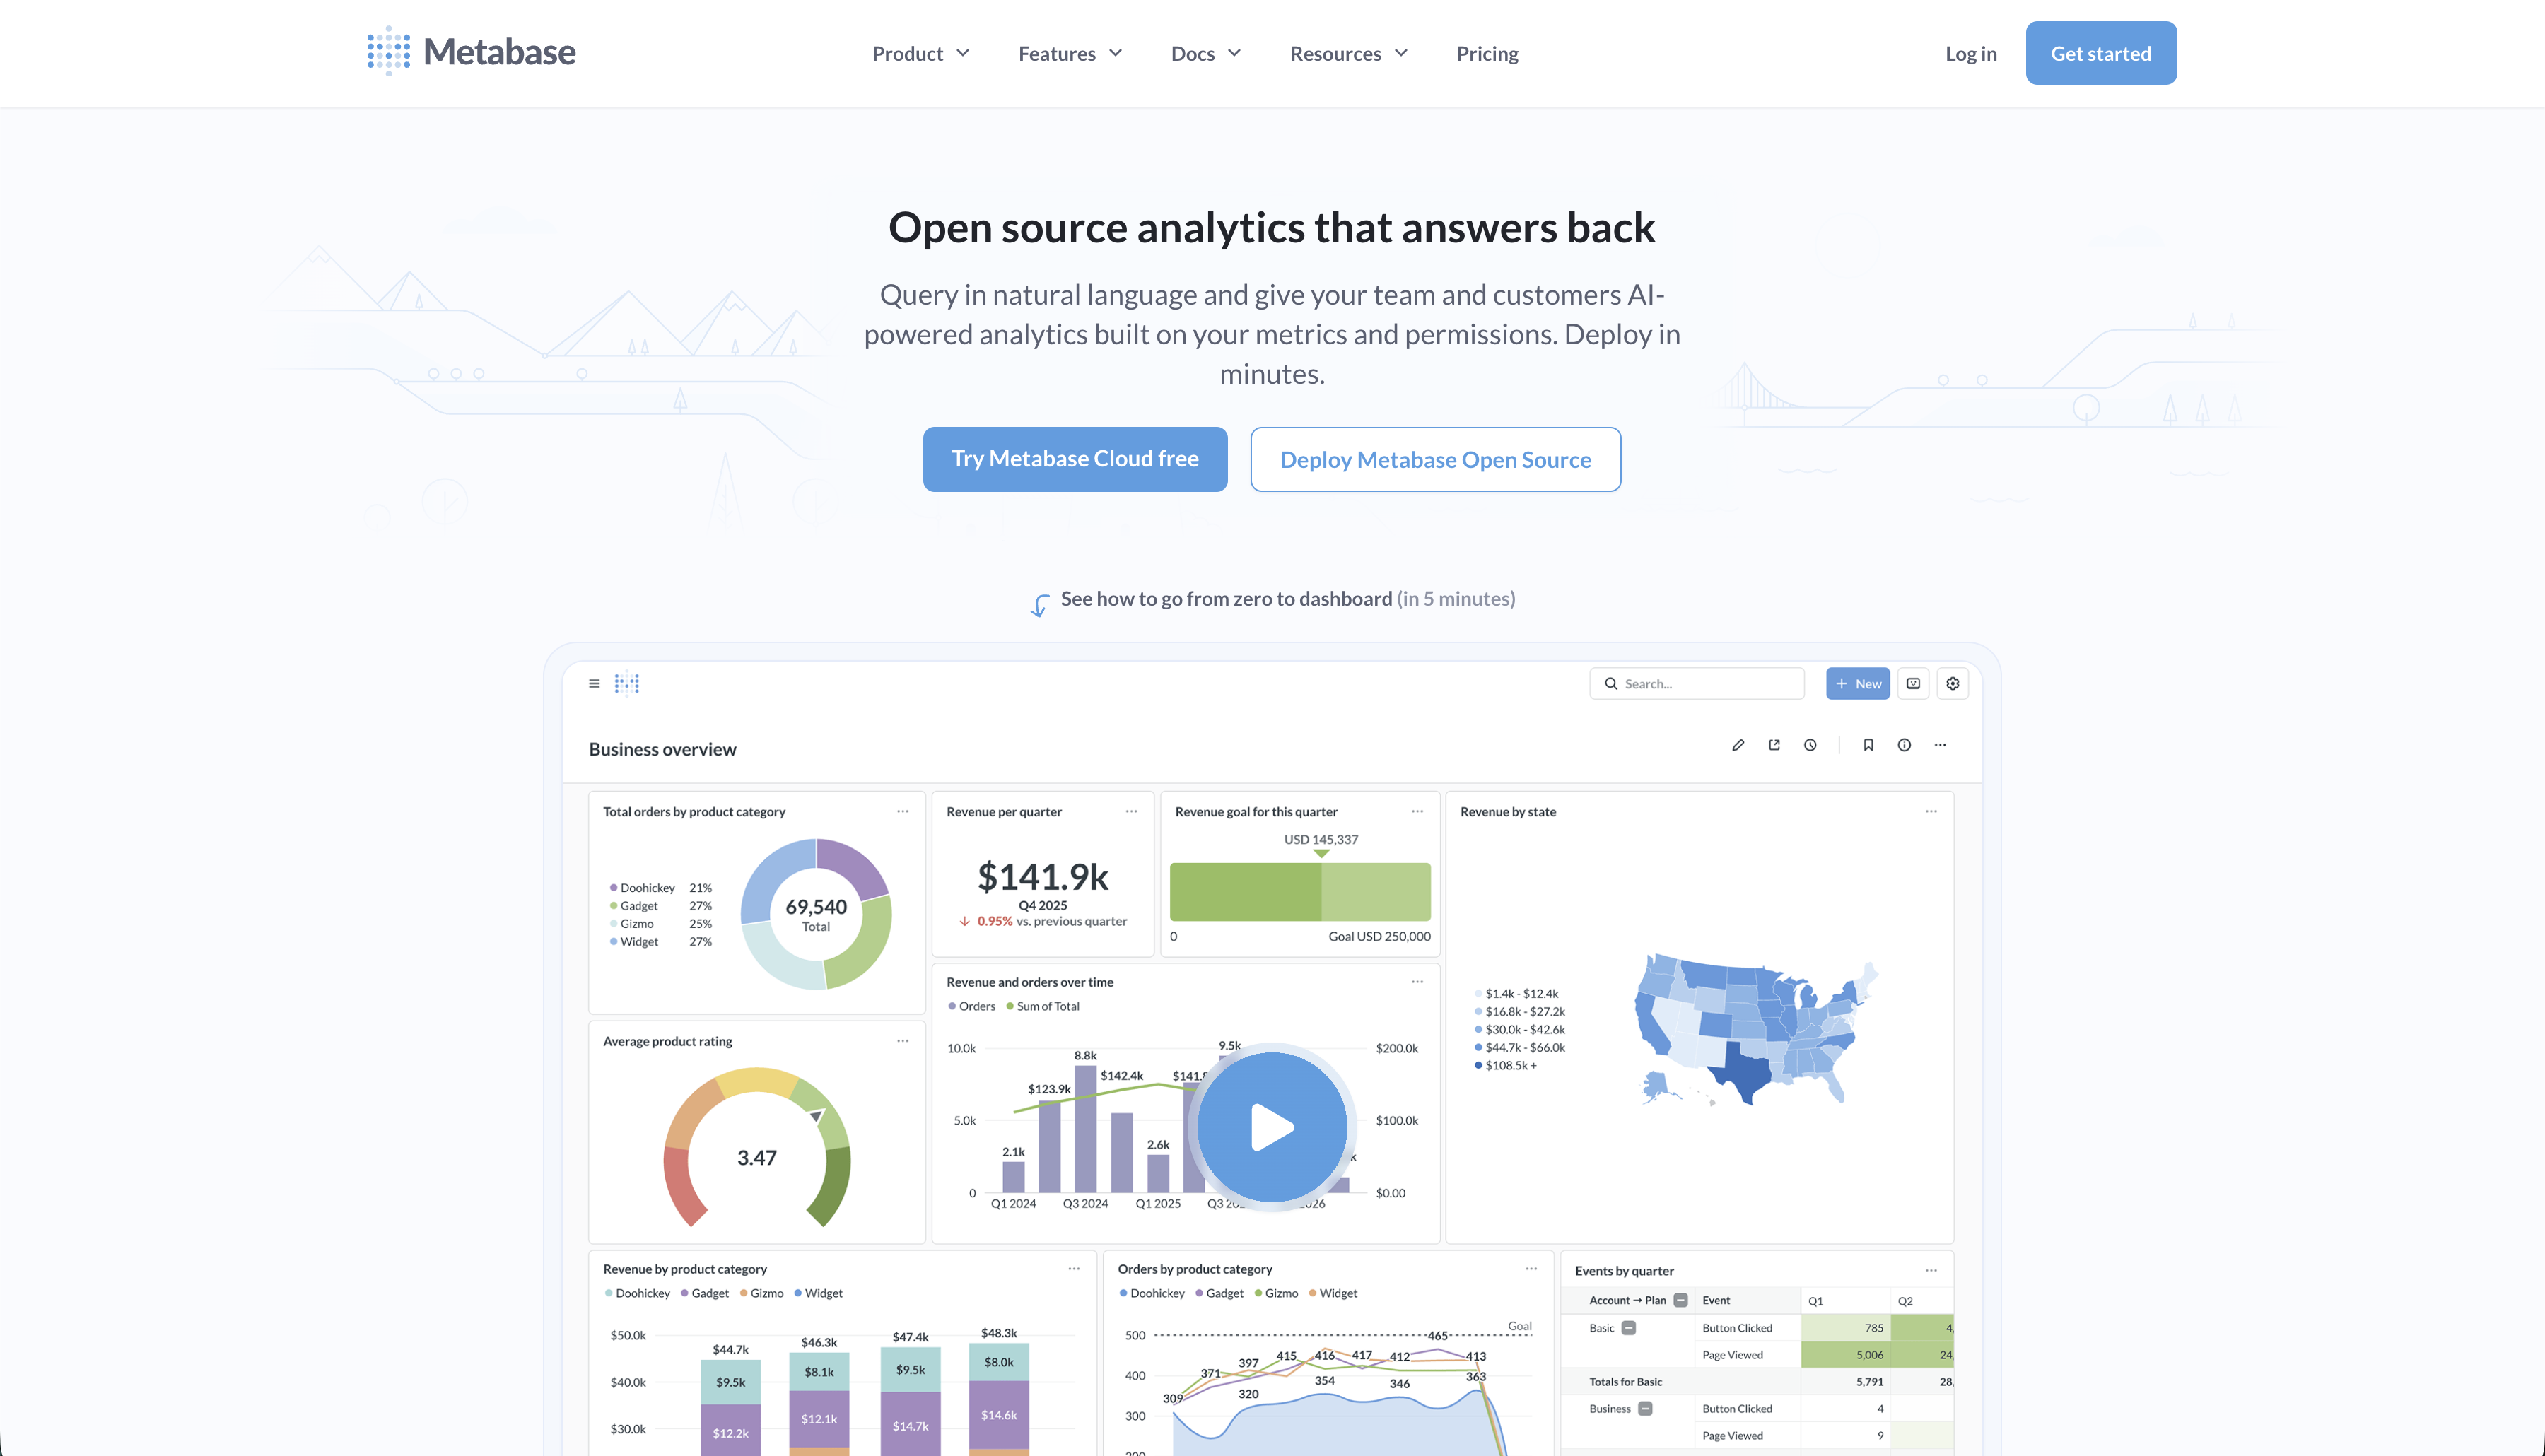
Metabase is one of the most widely adopted open-source BI tools, mainly used for internal reporting and self-service dashboards. The question-based interface is approachable for non-technical users, and the free open-source version keeps costs low for teams that do not need advanced features. If Metabase is already on your shortlist, our Metabase alternatives comparison covers where teams tend to outgrow it.
Key Features
- Question-based query builder and SQL editor
- Automatic chart recommendations based on data shape
- Dashboard filters, drill-through, and interactive controls
- Scheduled reports and email delivery
- Open-source with self-hosting support
- Embedding available on Pro and Enterprise plans
Pricing
Metabase open-source is free and self-hosted. Metabase Pro, which includes embedding and whitelabeling, starts at around $500/month. Enterprise pricing is custom.
6. Qlik Sense
Best Bold BI Alternative for Large Enterprise Self-Service Analytics
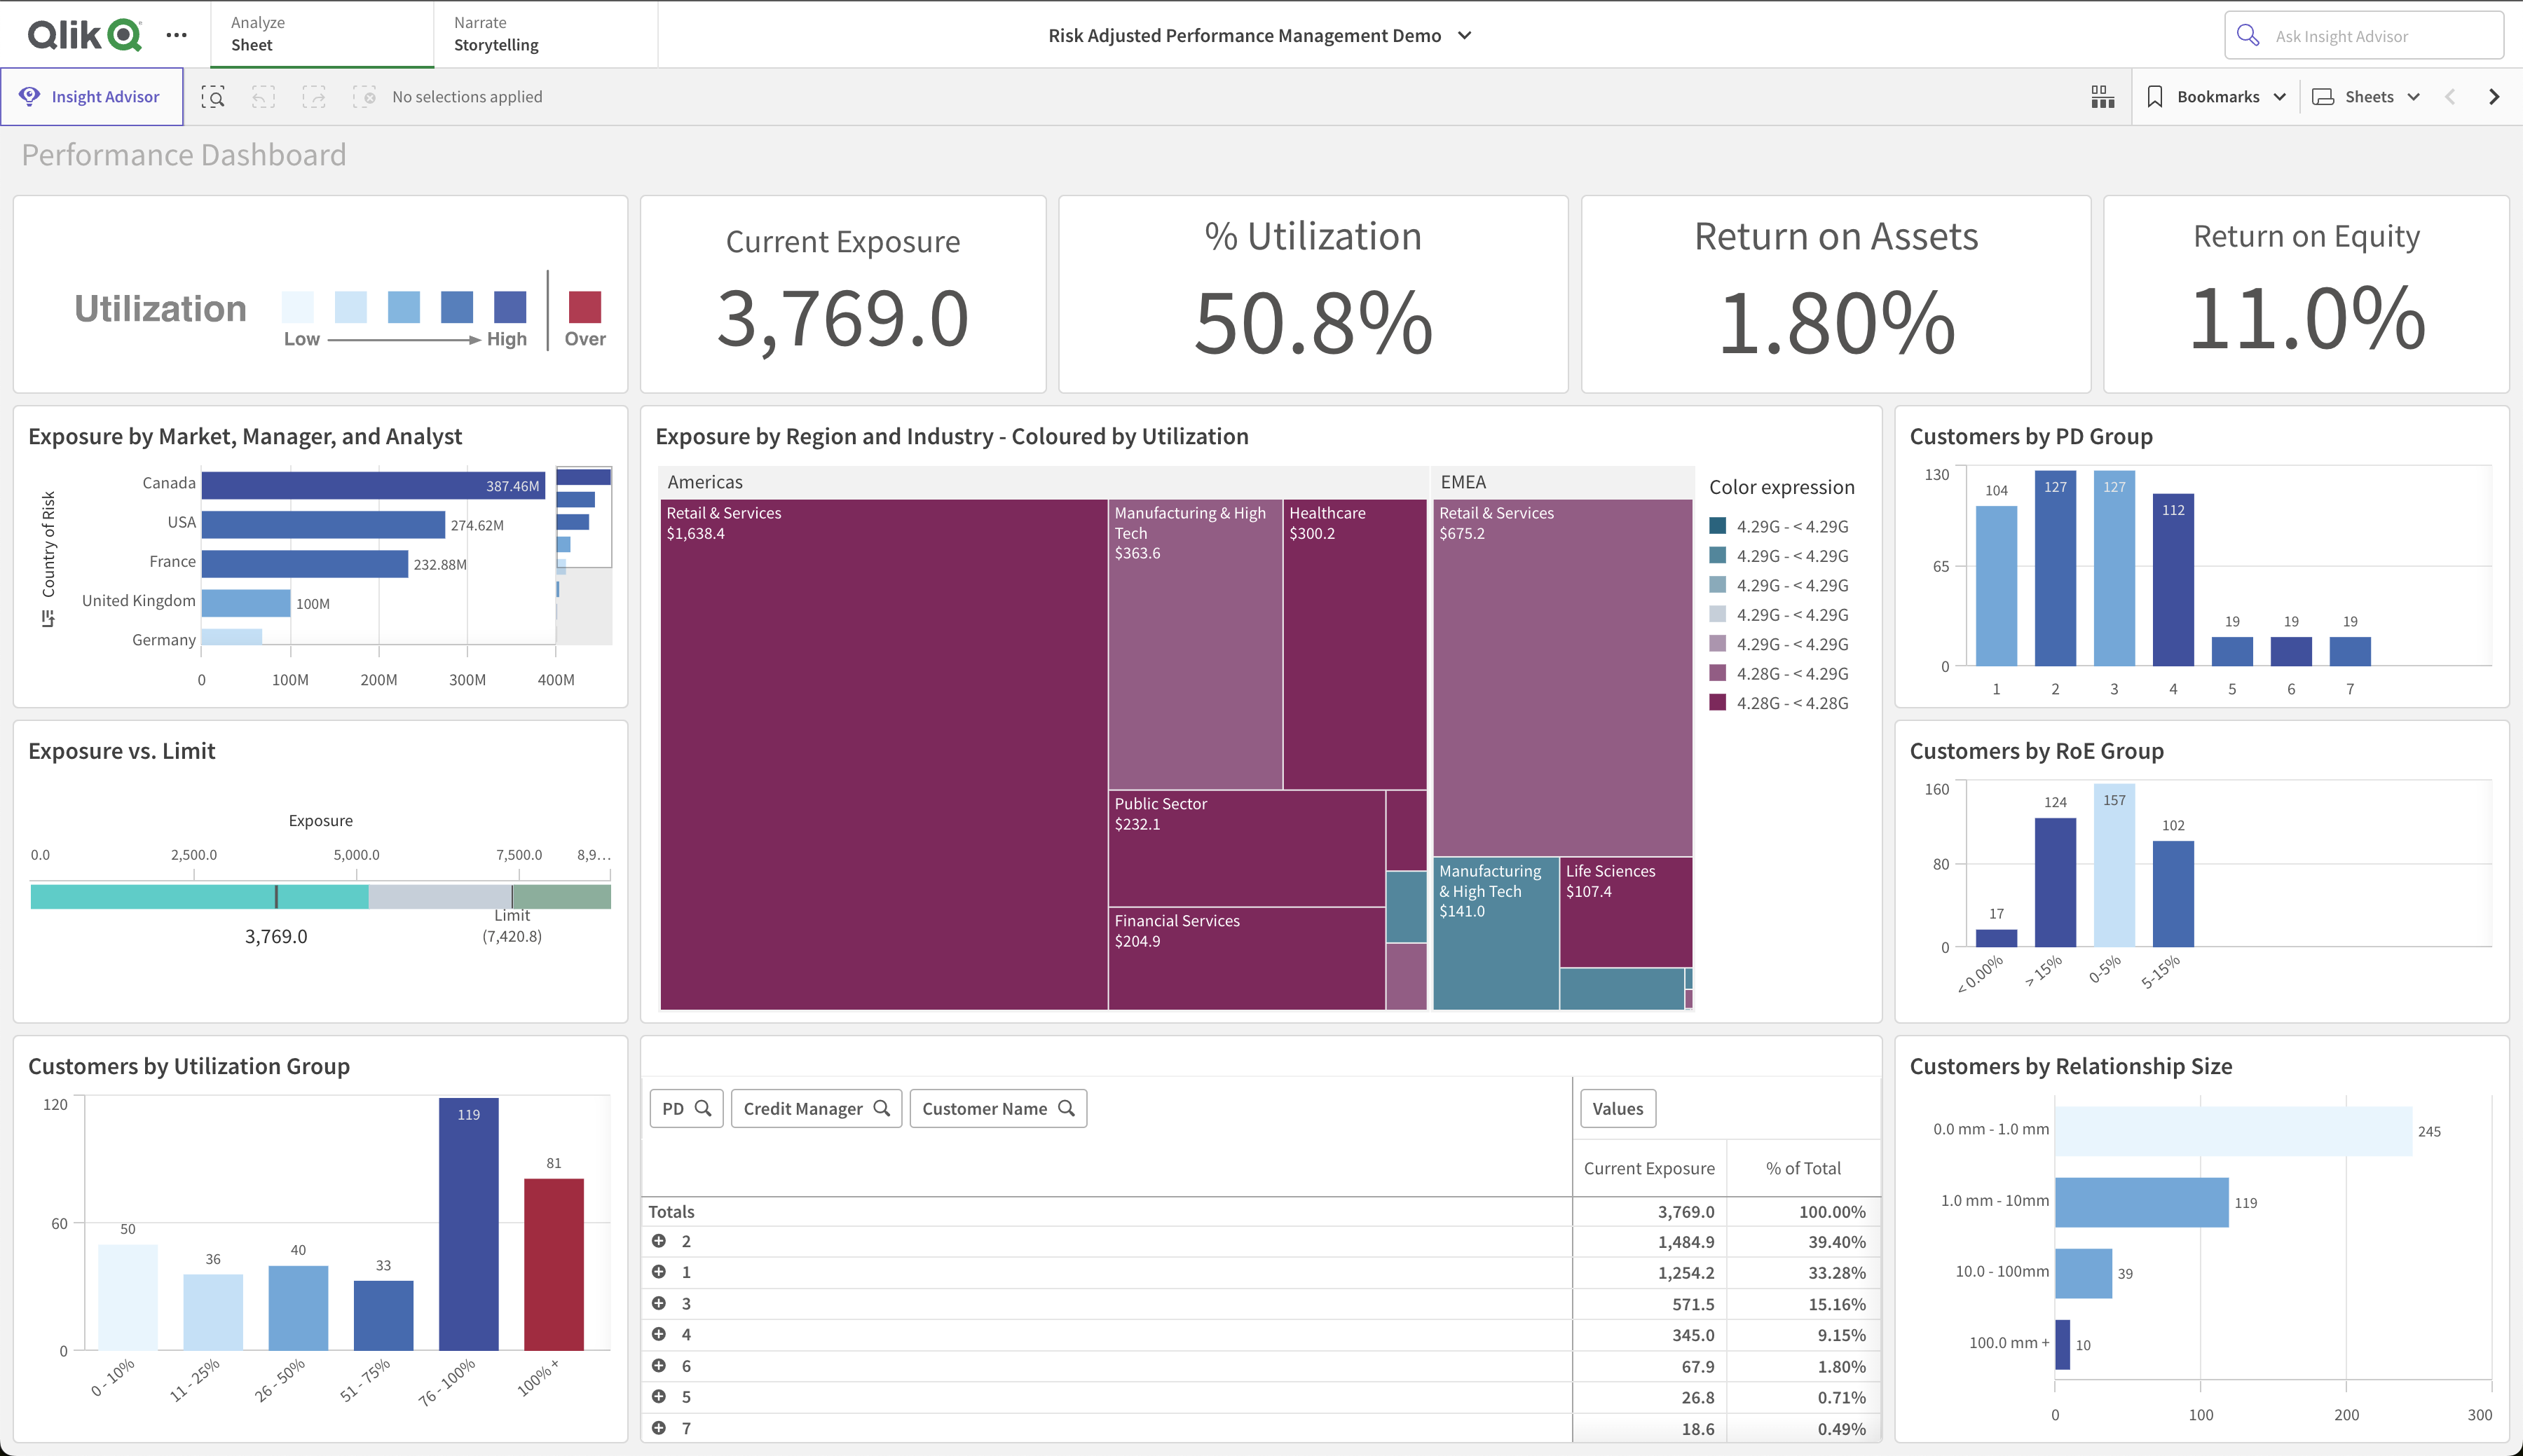
Qlik Sense is an enterprise BI platform known for its associative data engine, which lets users explore relationships across data without being locked into predefined query paths. It is used mainly by larger organizations that need flexible, self-directed data exploration across complex datasets. If you have already evaluated Qlik and are looking at lighter options, our Qlik alternatives guide is worth a read.
Key Features
- Associative data engine for exploring data relationships freely
- Drag-and-drop dashboard and report builder
- AI-assisted insights and natural language querying
- Multi-cloud and on-premise deployment options
- Row-level security and enterprise governance controls
- Active community and a broad library of extensions
Pricing
Qlik Sense Business starts at $300/month, with Enterprise plans available for larger deployments. Pricing is published on their website so you can evaluate cost fit without a sales call.
How to choose the right Bold BI alternative
If you need AI-powered self-service analytics or affordable embedded analytics with transparent pricing, Draxlr is the strongest starting point. Plain English querying, a visual builder, and full SQL access in one platform from $25/month.
If your team is already on Microsoft infrastructure, Power BI is the natural fit with deep Azure and Excel integration.
If enterprise-grade visualization is the priority and budget is not a constraint, Tableau delivers on that better than anything else on this list.
If your team wants to search data in plain English without building dashboards upfront, ThoughtSpot is built around that workflow.
If you want open-source internal dashboards at low cost, Metabase covers most basic BI needs without much setup.
If you are in a large enterprise and need flexible data exploration across complex, interconnected datasets, Qlik Sense is worth evaluating.
Conclusion
Bold BI is a solid tool with a real feature set. The reasons teams look elsewhere are specific and usually practical. Data source management that requires planning ahead, performance that degrades at scale, a few chart type gaps, deployment instability on Linux environments, and pricing that requires a sales conversation before you can assess fit.
Most alternatives on this list connect directly to your existing SQL databases, so switching is less disruptive than it sounds. The main work is rebuilding your dashboards, not moving your data.
FAQs
1. What are the best Bold BI alternatives in 2026?
The best Bold BI alternatives in 2026 are Draxlr, Tableau, Microsoft Power BI, ThoughtSpot, Metabase, and Qlik Sense. The right choice depends on your priorities: AI-powered self-service analytics, embedded analytics, pricing transparency, SQL flexibility, ease of use for non-technical users, or enterprise visualization depth.
2. Why do teams switch from Bold BI?
The most common reasons are schema management friction when data sources evolve, dashboard performance issues as data volumes grow, specific chart type limitations, instability on Docker and Kubernetes, and the lack of published pricing.
3. Which Bold BI alternative is best for non-technical users?
Draxlr and Metabase are the easiest to pick up for non-technical users. They both have text-to-SQL AI that lets business users ask questions in plain English and get chart results without writing SQL.
4. Which Bold BI alternative has the best AI features?
Draxlr and ThoughtSpot lead here, with text-to-SQL, AI-assisted query building, and automated chart generation built into the core product rather than added on top. Power BI and Tableau have AI features too, but they are layered into broader platforms rather than being central to the query experience.
5. What is the cheapest Bold BI alternative?
Metabase is free as an open-source, self-hosted tool. Draxlr starts at $25/month with a free tier that requires no credit card. Both publish their pricing clearly, which makes budgeting straightforward before you commit.
6. Which Bold BI alternative is best for small businesses?
Draxlr is the strongest option for small businesses. Draxlr is quick to set up and scales without pricing surprises.
7. Is it hard to migrate from Bold BI?
Not particularly. Most alternatives connect directly to your existing SQL databases, so your data stays where it is. The main effort is rebuilding your dashboards in the new tool, which usually takes days rather than weeks.
About the author

Ameena is the founder of Draxlr, a modern business intelligence platform focused on making data analysis simpler and faster. She writes about embedded analytics, databases, SQL, dashboards, and building scalable data products for modern teams.