What Do People Ask AI in a BI Tool? 13 Question Types From Real Chats
We sorted the first messages people typed into Draxlr's AI chat: 18.6% asked to look up records, 15.8% pasted SQL, and just 1.8% asked the AI to find insights.
What do people type when a BI tool hands them an AI chat box? We sorted the opening messages of conversations in Draxlr's AI chat into 13 question types. The most common request wasn't "find me insights." It was "show me these records," at 18.6% of opening messages. Open-ended insight requests came last, at 1.8%.
General chatbots can't tell us much about this. In 2025, researchers from OpenAI, Duke and Harvard classified a large sample of ChatGPT conversations in How People Use ChatGPT. Data analysis made up just 0.4% of messages (OpenAI, Duke and Harvard, 2025). In a BI tool, data is the reason the chat box exists.
This post covers all 13 types with real examples. It also covers what they say about how people use an AI analyst, how to phrase questions that get better answers, and what to build if you're adding an AI assistant to your own product.
Key Takeaways
- Most people ask for specific data, not insights. Lookups, single numbers, trends, breakdowns and top-N lists made up 51.2% of opening messages in Draxlr's AI chat. "Find insights for me" was 1.8%.
- More than 1 in 4 conversations start from existing work. 28.2% of opening messages pasted SQL or asked to change a query or chart already on screen.
- About 1 in 8 opening messages isn't a request for a result: how-to questions, questions about what's in the data, tests and off-topic asks.
- Ask specific questions. Name the measure, the time window, the grouping and what you want back.
How Did We Sort the Questions?
We put each conversation's opening message in Draxlr's AI chat into one of 13 types. Every share in this post is a percentage of opening messages, and the 13 shares add up to 100%. We used opening messages because they show what people want before any back-and-forth with the AI.
Draxlr's AI chat works on a connected SQL database, such as PostgreSQL, MySQL or SQL Server. You ask a question in plain English. The AI writes the SQL, runs it and returns a table, chart or summary, and follow-up questions refine the same query (Draxlr docs).
For the examples, we pulled a random spread of real messages for each type, one per user so no single account dominates. Then we picked the clearest ones and cleaned them up:
- Typos are fixed.
- Names, emails, IDs and brand-specific table names are removed.
- Messages that weren't in English are translated and marked.
Two limits are worth stating. These are one product's users, so the mix reflects people who sign up for a BI tool that connects to SQL databases. And each message gets one type, even when it asks for two things, like "Top 10 customers with the most orders, as a graph."
What Do People Ask AI in a BI Tool?
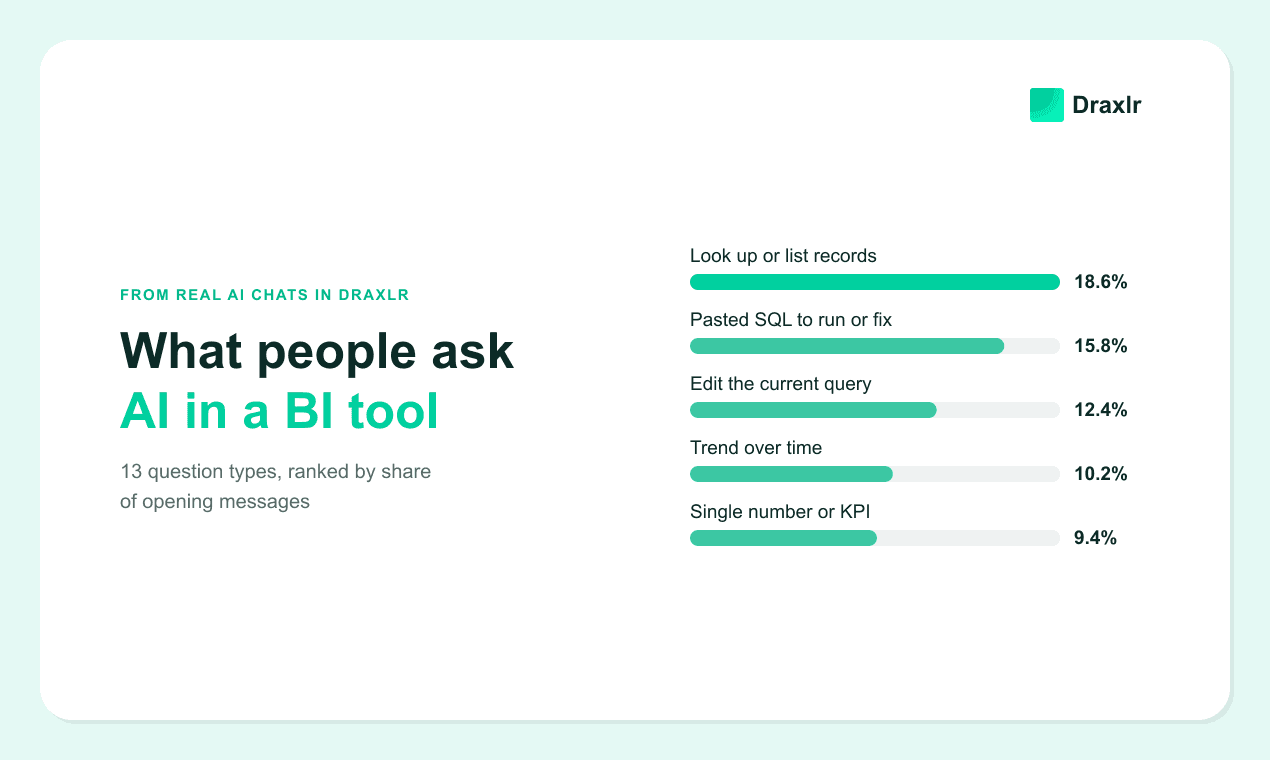
People mostly ask an AI in a BI tool for a concrete result: rows, a number or a query. In Draxlr's AI chat, the top five opening requests were looking up records (18.6%), pasted SQL (15.8%), edits to the current query or chart (12.4%), trends over time (10.2%) and single numbers or KPIs (9.4%). Together, they make up 66.4% of opening messages.
Breakdowns and top-N lists add another 13.0%. Named techniques like cohorts and funnels, plus open-ended "find insights" questions, come last at 3.8% combined.
The 13 Question Types, With Real Examples
Below is every type, from most to least common. The examples are real opening messages, cleaned up as described above.
1. Look up or list records (18.6%)
The most common first request is a list. People want rows back: customers, offers, accounts, orders. Many describe filters and joins in plain English that would take a subquery or two in SQL.
- "Show customers who visited the website many times but never purchased."
- "I would like to get all offers from the last 6 months that include a flight."
- "I'd like a list of each portfolio account, showing the portfolio name, institution, entity and tenant."
- "Join Orders and Shippers to find out which shipper was used for each order."
- "If I give an event ID, show the price of the tickets sold and whether the seller has normal permissions." (translated from Japanese)
- "I need an Excel list of all partner hotels that have a channel manager." (translated from German)
Notice how often these name the columns, and once even the file format. People know what they want to see. They want the AI to write the join. The right answer here is a table, not a chart.
2. Pasted SQL to run, fix or optimize (15.8%)
The second most common opening message isn't a question at all. It's SQL. People paste a query and ask the AI to run it, change it or make it faster.
- "Tune this SQL for me."
- "I need to optimize a MS SQL Server stored procedure."
- "Edit this query so it does not count the word 'fat'," followed by a SELECT
- "Update this query to show the top lessons instead of the top sequences," followed by a SELECT
- A pasted check-ins query, followed by "I want the total number of check-ins."
- A full take-home SQL test from a data analyst job application, pasted in whole
SQL is everywhere, so this shouldn't surprise anyone. In the 2025 Stack Overflow Developer Survey, 58.6% of respondents reported using SQL, behind only JavaScript and HTML/CSS (Stack Overflow, 2025). People who already write SQL treat the AI as a pair programmer. For a quick second opinion on a slow query, our free SQL optimizer does the same job outside the app.
3. Edit the current query or chart (12.4%)
About one opening message in eight is an edit. They already have a query or chart on screen, and they open the chat to change it.
- "Change the x axis to days instead of months."
- "Add a filter for state."
- "Change this where clause to the last 7 days."
- "Add a 2nd axis for units/order qty to the monthly chart."
- "Change the query so there is 1 row per name and email, including all skills for that user."
- "Why is this graph stopping at July 2026?"
The last one is a debugging question in disguise. To answer it, the AI has to read the query behind the chart, not just the chart. In Draxlr, follow-up questions refine the same query, and you can open the generated query in the query builder to change its tables, filters and columns with a few clicks.
4. Trend over time (10.2%)
The trend examples were among the most complete in the whole set. Most name a measure, a time grain and sometimes a filter.
- "I want to create a monthly active user chart."
- "Create a chart displaying the growth of users in the last 30 days."
- "Can you make me a report that shows how many students signed up each month?"
- "The average cost per category for each month."
- "Show me sales in the US and UK from last September vs this September."
- "Line chart of total claim amount per month where approval status is Approved."
What the AI has to guess is the definition. A "monthly active user" could be someone who logged in, placed an order or changed anything at all. Our monthly active users query shows one common definition.
5. Single number or KPI (9.4%)
Short questions, one number back.
- "How many orders this month?"
- "Total order value for November."
- "How much revenue did we bring in yesterday?" (translated from German)
- "Number of users created."
- "How many hotel contracts do we have with hotels in India?" (translated from German)
- "Show me the reship and refund rates for products in the enclosures category."
These look like the easiest questions, but they hide definitions. Does "orders" include cancelled ones? Is "yesterday" in your timezone or the database's? In Draxlr, Train AI lets you write those definitions down once, and the AI applies them to every question.
6. Breakdown by category (9.2%)
"By" is the key word. People want one measure split across a dimension, and sometimes two.
- "How many sales in the month do we have by store and salesperson?"
- "Can you give the average call duration by category?"
- "List the number of videos, documents and visitors by bot."
- "From the companies marked as ICP, group them by sub-industry."
- "Bar chart of total orders by employee, sorted highest to lowest."
One dimension fits a bar chart or a short table. Two dimensions, like store and salesperson, usually read better as a pivot table.
7. Off-topic, test or unclear (6.4%)
About one opening message in 16 isn't about the user's data at all. Some are greetings or a single character, typed to see what the box does. Others are essay paragraphs, requests for maps or printable templates, or asks to generate made-up datasets.
Testing a new tool before trusting it with a real question is fair. Sample questions in an empty chat give those people a better first try, and show everyone else what the assistant is for.
8. Build a full dashboard (4.7%)
Dashboard requests are rare, but they're the biggest asks. Some list four or five metrics in one message. Others ask the AI to decide what belongs on it.
- "Create a dashboard showing monthly bookings, monthly revenue, cancellations and the top 10 destinations for the last 12 months."
- "Come up with great dashboard ideas for our fintech app."
- "I want you to create a professional dashboard with the best information you have available." (translated from Portuguese)
- "Show me an overview of projects, including lengths, average fee, ranking of members, etc."
- "I have my own schema file and want you to generate a dashboard from it."
- "I want 1. top donors 2. donors approaching a total threshold in the last 6 months 3. ..." (translated from Spanish)
Draxlr's AI can build a full dashboard from one prompt. It plans the dashboard items, writes the SQL for each one, and lays them out as KPI metrics, trends, breakdowns and tables.
9. Top-N or best/worst (3.8%)
Rankings, usually with a condition attached.
- "Top 10 parts by inventory sales in 2024."
- "Show best customers by $ of sales and order volume (both)."
- "Which sales rep has the highest answer rate for the most recent week, with their total dials and talk time?"
- "Which countries are growing the fastest and have meaningful revenue? Give me two per major region."
- "Top 10 customers with the most orders, as a graph."
- "Top 15 sales in men's fragrances, only 100ml bottles." (translated from Spanish)
"Two per major region" is a top-N per group, which usually needs a window function in SQL. "Meaningful revenue" needs a threshold the user didn't give, so a good answer says which one it picked. Here's how a top 10 customers by lifetime value query is built.
10. How to use the product (3.6%)
Some people use the chat as the help desk.
- "Can I join across databases?"
- "Why is my public schema not showing as an option for my connected database?"
- "How do I use variables in raw SQL?"
The chat box is hard to miss, so people type whatever is on their mind, billing included. Most product answers live in the docs. Variables in raw SQL, for example, are covered in the raw SQL guide. Billing questions need a person.
11. What's in my data (2.1%)
Before asking a question, some people ask what they can ask.
- "What do you know about this database?"
- "Tell me something about the data."
- "Give me the fields related to payment."
- "Is there any data named WeChat or similar?"
- "Which tables have daily booking revenue in EUR for all our brands?" (translated from German)
An AI can only describe a database as well as its table and column names allow, and columns called amt_2 or flg_x don't say much. Fine-tune AI in Draxlr lets you describe tables and fields in plain words and choose which tables the AI can use.
12. Named technique like cohort, churn, funnel or RFM (2.0%)
Most of these examples describe the steps instead of naming the technique.
- "Days from seller registration to first listing, and from listing to purchase." (translated from Japanese)
- "For inbound call tracking, create a funnel: total calls, then answered, then processed."
- "Average days between application validation and decision, grouped by year."
- "How many customers bought last September, and how many of those also bought this September?"
- "Group players into buckets by matches played (1-5, 6-20, 21-50...) and return stats per bucket."
- "Create an ABC curve chart by value for partners who bought this product in 2025." (translated from Portuguese)
The September question is a retention cohort without the word "cohort." See user retention by cohort for a worked example. These questions take several steps of SQL, which is where text-to-SQL has been weakest. When the Spider 2.0 benchmark of 632 real enterprise text-to-SQL tasks was published at ICLR 2025, an agent built on OpenAI's o1-preview solved only 21.3% of them, compared with 91.2% on the older Spider 1.0 benchmark (Lei et al., Spider 2.0, ICLR 2025). Read the SQL before you trust the number.
13. Open-ended "find insights for me" (1.8%)
The smallest group of all.
- "Are there any claims that look unusual compared to past months?"
- "Explain the biggest drivers of the change in orders from February to March."
- "How did our revenue do last month, and what drove it?"
- "Which product is projected to have maximum sales this year?"
- "Create a backlog analysis for leadership."
- "Make any visualization that you think is meaningful."
The strongest of these carry their own comparison: "compared to past months," "from February to March." That gives the AI something to measure against. Trust is catching up, too.
What Do These Questions Say About AI in BI?
Grouped into three kinds of request, the 13 types have one clear leader. Most opening messages, 59.7%, ask for data. Another 28.2% bring SQL or edit a query, and 12.1% are something else.
People ask for data, not insights
Lookups, single numbers, breakdowns, trends and top-N lists make up 51.2% of opening messages on their own. Open-ended insight requests are 1.8%. These people already know their question. What they want from the AI is the query they'd otherwise write by hand or click together in a builder.
That changes what "good" means. A wrong count on "How many orders this month?" costs more trust than a missed insight.
The AI is an editor, too
More than one conversation in four starts with pasted SQL or a change to something already on screen. Many of them want to read the SQL, change it and run it again, not have it hidden behind a friendly answer.
One user pasted a full take-home SQL test from a data analyst job application. It's funny. It also shows how people see the tool: a SQL expert on call, not a chart button. We'll let the hiring manager decide how they feel about it.
The chat box is the front door
Product questions, billing questions and test messages all land in the same box.
How do I use variables in raw SQL?
That message wasn't for an AI analyst. It was for whoever was listening. An assistant that spots a message like this and hands it to a human does more for that user than any query could.
Some people hand over the whole job
Make any visualization that you think is meaningful.
This user isn't being lazy. They're facing a blank page, a database they may not know well and a box that invites any question. A short tour of what's in the data, a few sample questions or a dashboard generated from one prompt gives them somewhere to start.
How Can You Get Better Answers From an AI Analyst?
Write the question the way the clearest messages in our data were written. The best trend request (trends were 10.2% of opening messages), "Line chart of total claim amount per month where approval status is Approved," names the measure, the time grain, the filter and the output in one sentence.
Five habits cover most of it:
- Name the measure and how it's counted. "Paid orders, excluding refunds," not "revenue."
- Give a time window and a grain. "Each week in the last 90 days."
- Say how to split it. "By plan" or "by country."
- Say what you want back. A list, a number, a table, a chart or a dashboard.
- Describe the steps for multi-step analysis. "Users who signed up in January, and how many of them ordered again in February."
Then read the SQL before you share the result. In the 2025 Stack Overflow Developer Survey, 46% of developers said they distrust the accuracy of AI tools, against 33% who trust it (Stack Overflow, 2025). Checking the query takes a minute, and you can generate SQL with AI and still edit it by hand.
On a typical SaaS database with users, orders and bookings, the difference looks like this:
| Vague | Specific |
|---|---|
| "Number of users created." | "How many users signed up each week in the last 90 days, by plan?" |
| "Revenue last month." | "Total value of paid orders in October 2026, excluding refunded orders." |
| "Make a bar chart." | "Bar chart of bookings by country for last month, top 10 countries only." |
| "Show me churn." | "Users who placed an order in Q2 but none in Q3, with their last order date." |
| "Find insights." | "Which plans had the biggest drop in weekly active users between September and October?" |
What Should You Build When You Add AI to Your Product?
Your customers' mix will differ from ours, since fewer of them will arrive with SQL in hand. Still, plan for the same kinds of request. In our data, 59.7% of opening messages asked for data, 12.4% changed something already on screen, and 12.1% asked about something else entirely.
Picture launch week.
Jared: The first AI chat logs are in. Someone typed "hi" and waited.
Gilfoyle: Did it say hi back?
Jared: It wrote a SQL query.
You can plan for that conversation:
- Show sample questions. Use the top types: a list, a number, a trend. They give people who are testing the box somewhere to start.
- Make edits cheap. 12.4% of opening messages change what's already on screen, so follow-ups should refine the same query, not start over.
- Keep the SQL one click away for the people who want it, and out of the way for those who don't.
- Describe your tables and define your metrics once, so "orders" means the same thing for every customer.
- Send product and billing questions elsewhere. Link the docs, and hand billing to a person.
- Scope every answer to the customer's own data. AI-written SQL needs the same tenant boundary as your dashboards.
In Draxlr, Full App Embedding gives each of your customers an analytics workspace inside your product. It includes shared dashboards, their own dashboards and saved queries, a query builder, a SQL editor and the AI assistant. It's on the Power plan ($250/month) and above. Row-level security applies to the AI assistant as well as to dashboards and saved queries. Our guide to letting customers build their own dashboards walks through the setup.
Try Draxlr's AI Chat on Your Own Data
Draxlr's AI chat connects to your SQL database, writes the SQL for each question, and returns a table, chart or summary you can add to a dashboard. See how it works on the AI chat feature page, from follow-up questions to a full dashboard generated from one prompt.
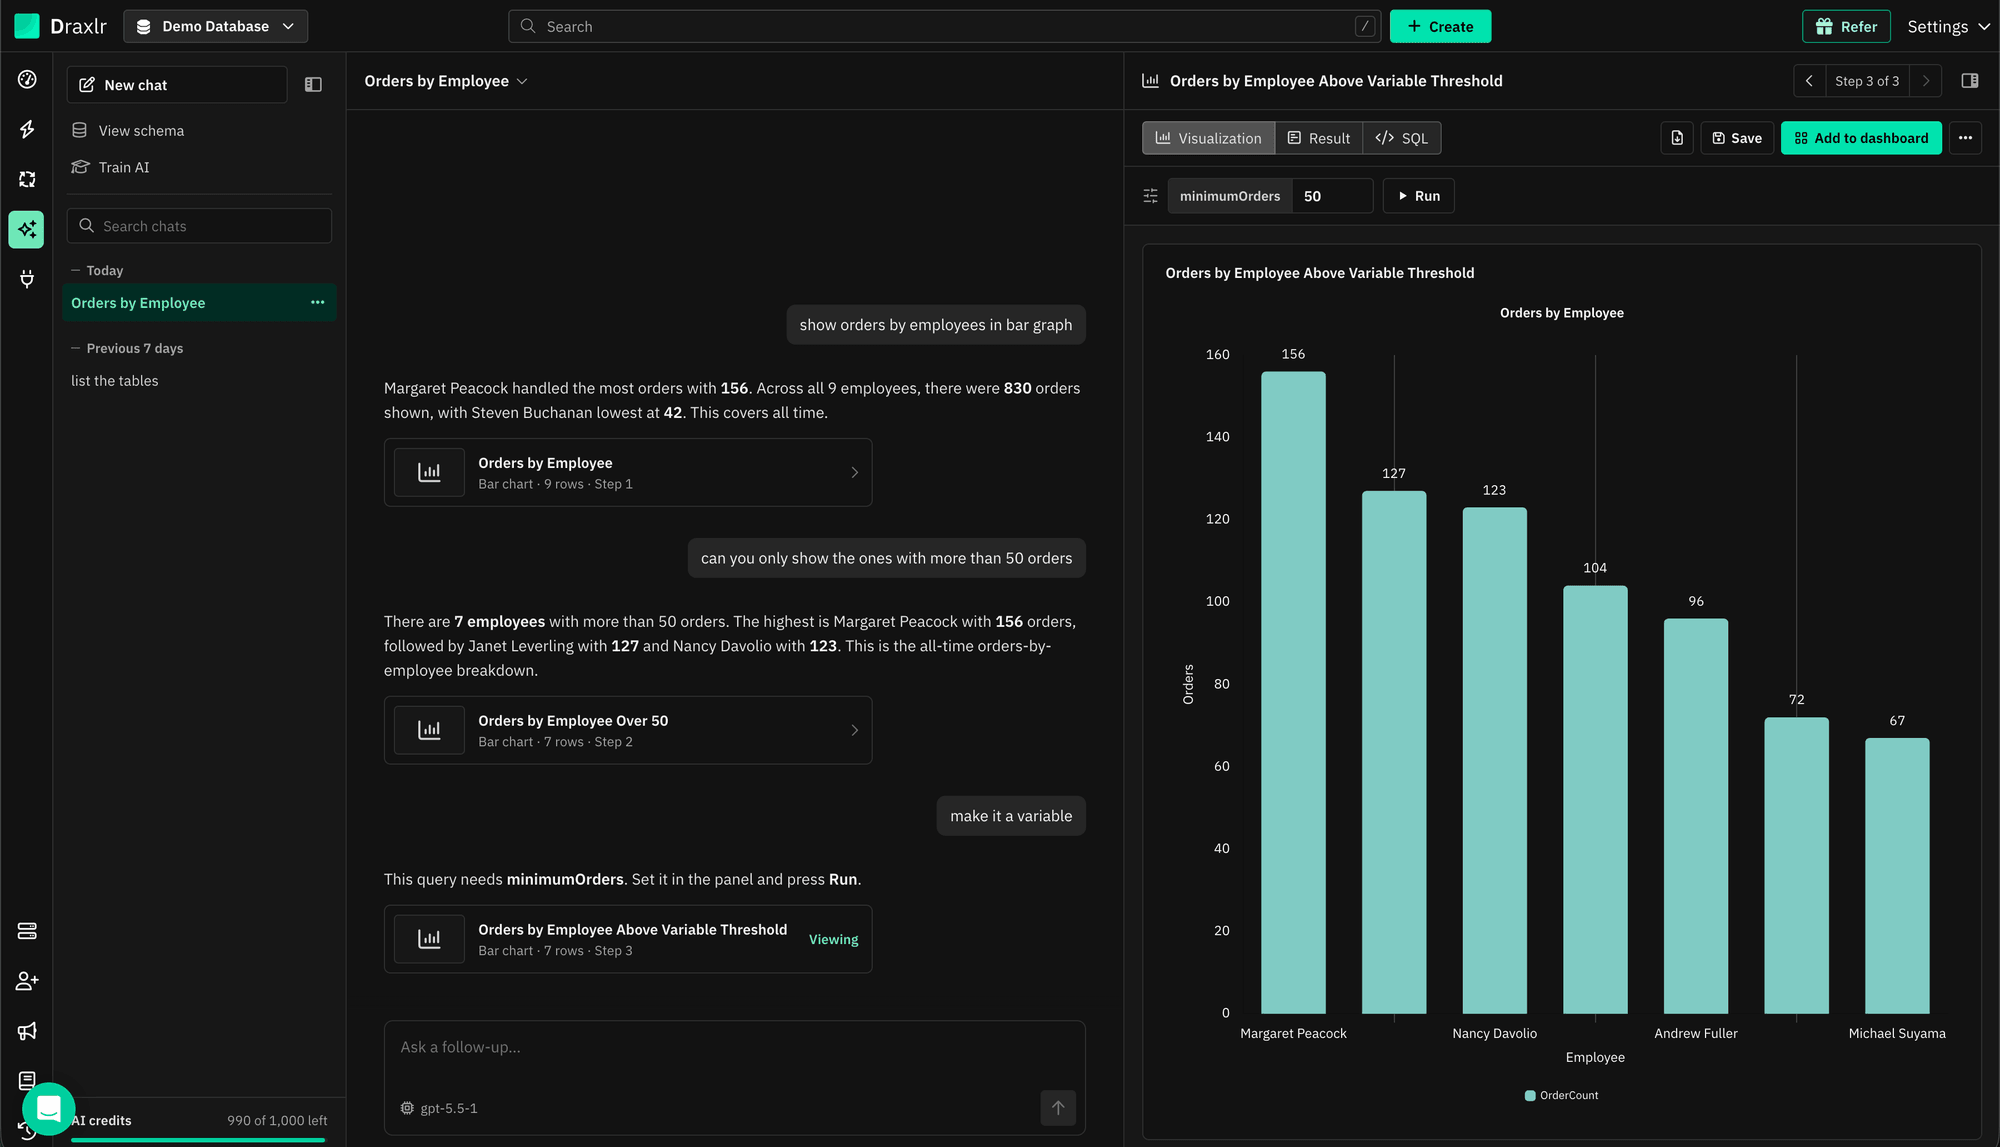
Then try your own opening message on your own data. Every new account starts with a 7-day free trial, and no credit card is required.
Connect your DatabaseFAQs
1. What do people ask AI in a BI tool most often?
In Draxlr's AI chat, the most common opening requests are looking up or listing records (18.6%), pasted SQL to run, fix or optimize (15.8%), and edits to the current query or chart (12.4%). Open-ended "find insights for me" requests are the least common of 13 types, at 1.8% of opening messages.
2. Can AI in a BI tool find insights on its own?
It can help, but insight requests were only 1.8% of opening messages in Draxlr's AI chat. They work best when they include a comparison, like "from February to March." Multi-step questions are hard for AI: when the Spider 2.0 benchmark was published in 2025, an o1-preview agent solved 21.3% of its enterprise tasks. Review the SQL.
3. Do you need to know SQL to use AI in a BI tool?
No. Most opening messages in Draxlr's AI chat are plain-English requests for lists, numbers, trends and charts. Still, 15.8% of conversations started with pasted SQL, so people who know SQL use the AI too. A good tool shows the generated SQL and lets you edit it.
4. How do you write a good question for an AI data analyst?
Name the measure and how it's counted, the time window and grain, how to split the result, and what you want back. "How many users signed up each week in the last 90 days, by plan?" beats "Number of users created." Trend questions, 10.2% of Draxlr's opening messages, often read like that.
5. Can I add an AI assistant to my own SaaS product?
Yes. Draxlr's Full App Embedding gives each customer an analytics workspace inside your product, with dashboards, saved queries, a query builder, a SQL editor and the AI assistant. It's on the Power plan ($250/month) and above. In our data, 6.4% of opening messages were tests or off-topic, so sample questions help customers start.
About the author

Vivek is a coder and the founder of Draxlr who cares deeply about building good products. He works at the intersection of AI, SQL, dashboards, and embedded analytics, with a strong focus on making complex data workflows feel simple, useful, and fast for real teams.
If you have questions about anything in this guide, or want to compare options for your specific stack, you can email Vivek at vivek@draxlr.com, try Draxlr free, or reach out directly through the Draxlr team.