Best CockroachDB Reporting Tools
Looking for CockroachDB reporting tools? Explore the best options for dashboards, analytics, and internal reporting on your CockroachDB data.
CockroachDB gives you a resilient, distributed SQL database that survives node failures and scales horizontally across regions — but the built-in console only takes you so far. As your product or data team grows, you need dashboards, shared reports, and structured data access without writing ad-hoc SQL for every question.
Engineering teams often start by querying CockroachDB directly through the CLI or using the DB Console for basic monitoring. Eventually that workflow breaks down. You end up gatekeeping data access, writing throwaway queries for stakeholders, and building one-off scripts to export metrics. Without a proper reporting layer, your data team becomes a bottleneck rather than an asset.
CockroachDB reporting tools solve this by connecting directly to your database and giving your team clean, controlled access to dashboards, charts, and scheduled reports — without rebuilding analytics from scratch. In this article, we cover the most reliable options worth considering in 2026.
What are CockroachDB reporting tools?
CockroachDB reporting tools are applications that connect to your CockroachDB cluster and let you build dashboards, run queries, and share data insights without writing SQL for every request. They sit on top of your existing database and provide a visual interface that works for both technical users and those who prefer not to touch the query editor.
Because CockroachDB is wire-compatible with PostgreSQL, most tools that support Postgres can connect to CockroachDB with minimal configuration. This makes the ecosystem of available reporting tools quite broad — you get the resilience and distributed scale of CockroachDB while benefiting from the mature Postgres tooling landscape. Queries run directly against your live schema, no pipelines or data duplication required.
How to choose a CockroachDB reporting tool
The right CockroachDB reporting tool depends on what problem you're actually trying to solve. A startup team tracking product metrics has very different needs from an ops team monitoring SLAs across a multi-region cluster.
Start by identifying your primary goal.
1. If your goal is internal reporting for your team
Pick a tool with strong SQL support, an intuitive dashboard builder, and simple sharing. You want your team to answer data questions quickly without relying on engineers for every request.
2. If your goal is customer-facing analytics
Look for embedding, white-label controls, and row-level filtering. Your customers should see dashboards that feel like a native part of your product, not a third-party tool bolted on.
3. If your goal is replacing an existing analytics stack
Prioritize flexible permissions, reusable query definitions, scheduled exports, and scalable embedding. These features reduce duplication and help standardize how your organization defines and shares metrics.
4. If your goal is minimal engineering involvement
Choose a tool that non-technical teammates can use independently. Visual query builders, AI-assisted SQL, and self-serve filters reduce the number of reporting requests that land in engineering backlogs.
Ultimately, the right CockroachDB reporting tool depends on whether you need speed, customer experience, operational visibility, or long-term scalability.
Key features to look for in CockroachDB reporting tools
Not every reporting tool is equally suited to CockroachDB's distributed architecture. Here are the core features to evaluate when comparing your options.
1. Native PostgreSQL compatibility
CockroachDB uses the PostgreSQL wire protocol, so your reporting tool should connect the same way it would to a Postgres database. This means:
- No specialized drivers required
- No ETL pipelines or schema duplication
- Queries run directly on your live CockroachDB cluster
- Permissions stay consistent with your existing setup
Avoid tools that require you to mirror or export your CockroachDB data before you can build reports.
2. Ease of dashboard building
Most CockroachDB teams don't have a dedicated analytics department, so reporting tools need to be accessible. Look for:
- Visual query building for non-technical users
- AI text-to-SQL support
- Reusable chart definitions
- Filters, grouping, and drilldowns
- Clear layout controls
- Easy dashboard sharing
The goal is that any member of your team should be able to answer a basic data question without filing a request with engineering.
3. Embeddability (for customer-facing dashboards)
If you plan to embed analytics inside your product, look for:
- Secure embed tokens
- Row-level filtering for multi-tenant architectures
- White-label styling options
Dashboards embedded inside your app should feel native, not like a third-party iframe.
4. API access for automation
Teams running on CockroachDB often automate workflows like scheduled reports, alerting, and dashboard generation. A reporting tool with API access gives you:
- Programmatic control over dashboards and queries
- Integration with your existing automation stack
- Scheduled delivery via email or Slack
- Flexibility as your reporting needs evolve
5. Data security and access control
CockroachDB is often used for multi-region, production-critical applications. Your reporting tool needs to match that standard. Look for:
- No data copying or exporting to third-party servers
- Role-based access control
- Secure embedding with user-level filtering
- Self-hosting options if required by your compliance posture
6. Documentation, support, and reliability
Good documentation and responsive support matter, especially when you're integrating a reporting layer into a production-critical CockroachDB deployment. Pick a tool with clear setup docs, an active community or support channel, and a track record of stability.
The best CockroachDB reporting tools to consider in 2026
Here's a breakdown of the top CockroachDB reporting tools worth exploring in 2026 and beyond.
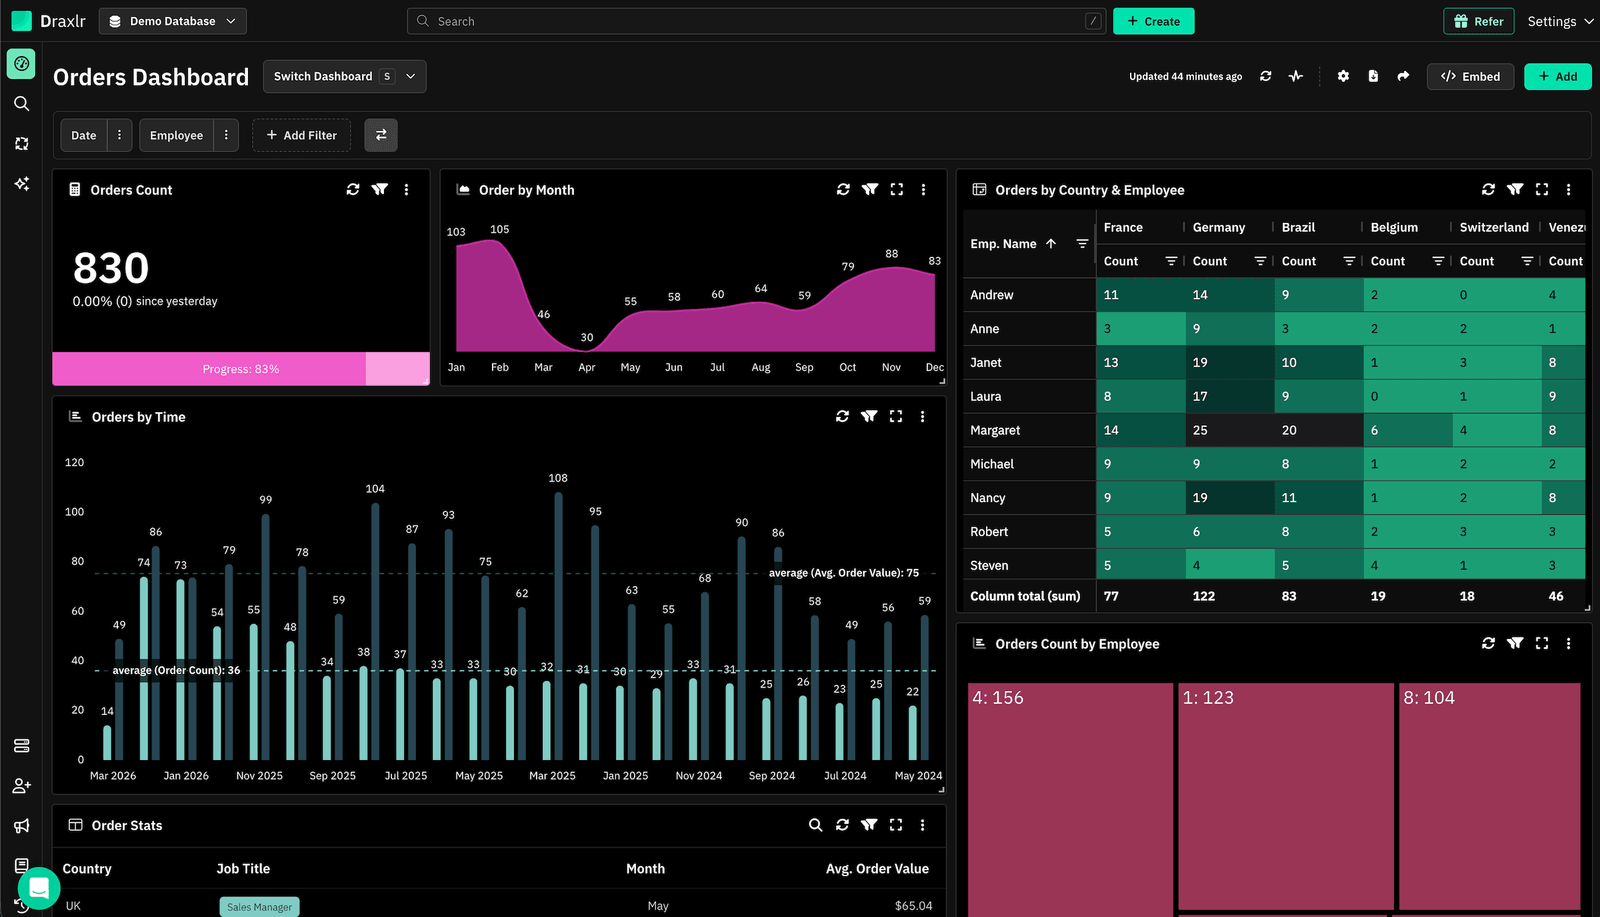
1. Draxlr: Best CockroachDB reporting tool for dashboards, team insights, and embedded analytics
Best for
SaaS teams and data teams running on CockroachDB who want a fast way to build dashboards, explore data, and deliver embedded analytics without adding a complex BI stack.
Connect your DatabaseDraxlr connects directly to your CockroachDB cluster using the standard PostgreSQL connection string and gives your team a clean interface for building reports, running SQL, and sharing dashboards — without any infrastructure overhead. Because CockroachDB speaks the PostgreSQL wire protocol, Draxlr connects seamlessly without any special configuration.
For technical users, Draxlr offers full SQL control, virtual columns, filters, drill-through navigation, and database-aware autocomplete. For non-technical teammates, the visual query builder and AI text-to-SQL make it easy to explore data without writing a single query. Both modes work against your live CockroachDB schema.
If you need customer-facing analytics, Draxlr supports embedded dashboards with row-level filtering, secure embed tokens, white-label controls, and React and Vue SDKs that integrate naturally inside your product. Teams can also automate reporting with scheduled email delivery, Slack alerts, and CSV or Excel exports.
Draxlr runs directly on your existing CockroachDB infrastructure — no pipelines, warehouses, or data modeling required.
Key features
- Connects directly to CockroachDB via PostgreSQL wire protocol — no ETL or extra setup
- Visual Query Builder, full SQL editor, and AI Chat for text-to-SQL
- Dashboard builder with filters, drill-through, and virtual columns
- Embedded dashboards with secure tokens, row-level filters, and white-label controls
- React and Vue SDKs for in-product analytics
- Export options (CSV, Excel, PDF) and scheduled reports
- Team-level permissions for controlled access to production data
- Supports both internal reporting and customer-facing analytics from the same workspace
What users say about Draxlr
Draxlr offers a clean, modern interface and makes it incredibly easy to build dashboards — even for non-technical users. I especially like the visual quality and flexibility of the available graph types. It's intuitive, fast to set up, and has excellent usability from the start. The ability to securely share dashboards via link is a game-changer for our client reporting. — Review from a SaaS Founder on G2
Pricing
Draxlr offers multiple plans depending on team size, embedding needs, and data volume. Pricing starts at $75/month
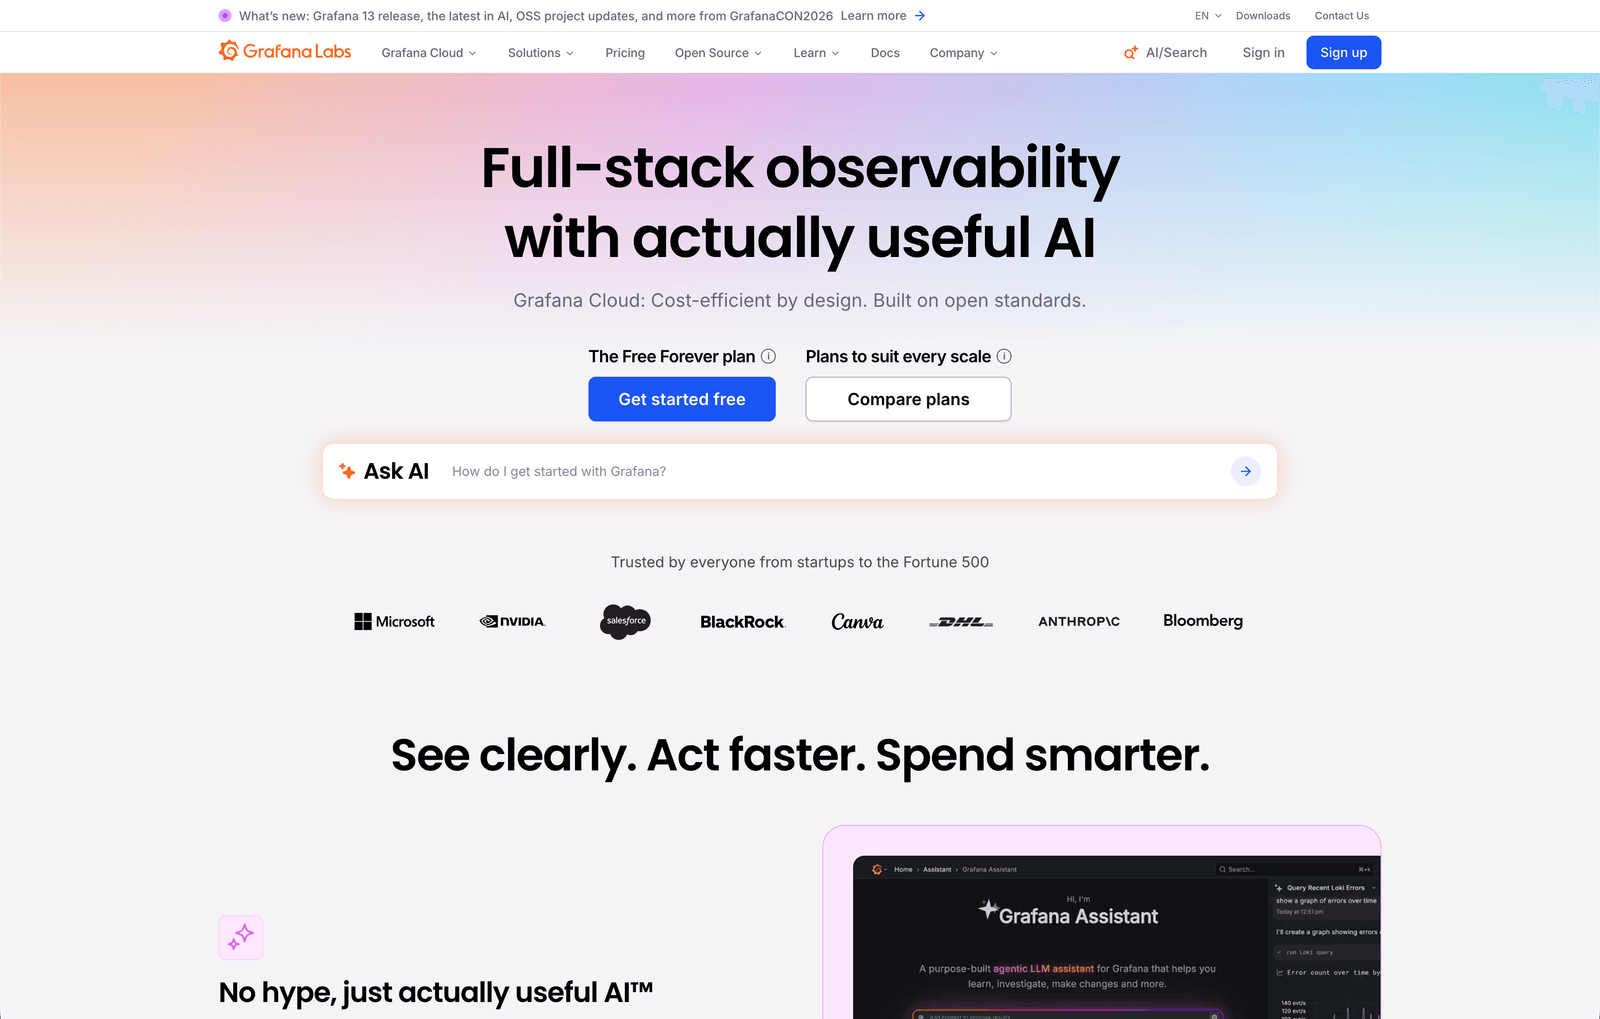
2. Grafana: Best for infrastructure and operational monitoring on distributed CockroachDB clusters
Best for
Engineering and DevOps teams that need to monitor CockroachDB cluster health, query performance, and infrastructure metrics alongside application observability data.
Grafana has official, first-party support for CockroachDB through a dedicated enterprise data source plugin and pre-built dashboards for cluster monitoring. Grafana Labs released the CockroachDB Enterprise data source in 2024, enabling secure and seamless connectivity directly to CockroachDB's distributed SQL engine. For teams already using Grafana for observability, this makes it a natural extension for database-level visibility.
The pre-built CockroachDB dashboards cover runtime metrics (node uptime, memory, CPU), storage availability, SQL query and transaction throughput, and replica information. CockroachDB also exposes a native Prometheus metrics endpoint, which makes Grafana-based monitoring straightforward to set up and maintain for teams managing multi-node clusters.
Where Grafana is less well-suited is business-level reporting — custom dashboards, non-technical user access, and customer-facing analytics are not its strengths. It excels at operational visibility rather than product analytics.
Key features
- Official CockroachDB enterprise data source plugin with native connectivity
- Pre-built dashboards for CockroachDB runtime, storage, SQL, and replica monitoring
- Prometheus metrics endpoint integration for automated alerting
What users say about Grafana
What I like most about Grafana Labs is its flexibility and strong visualization capabilities. Grafana makes it straightforward to create interactive, real-time dashboards by pulling data from multiple sources such as Prometheus, Elasticsearch, and various cloud platforms. — Review on G2
Pricing
Grafana Cloud offers a free tier. The Pro plan starts at $19/month base plus usage-based pricing. Enterprise plans start at approximately $25,000/year.
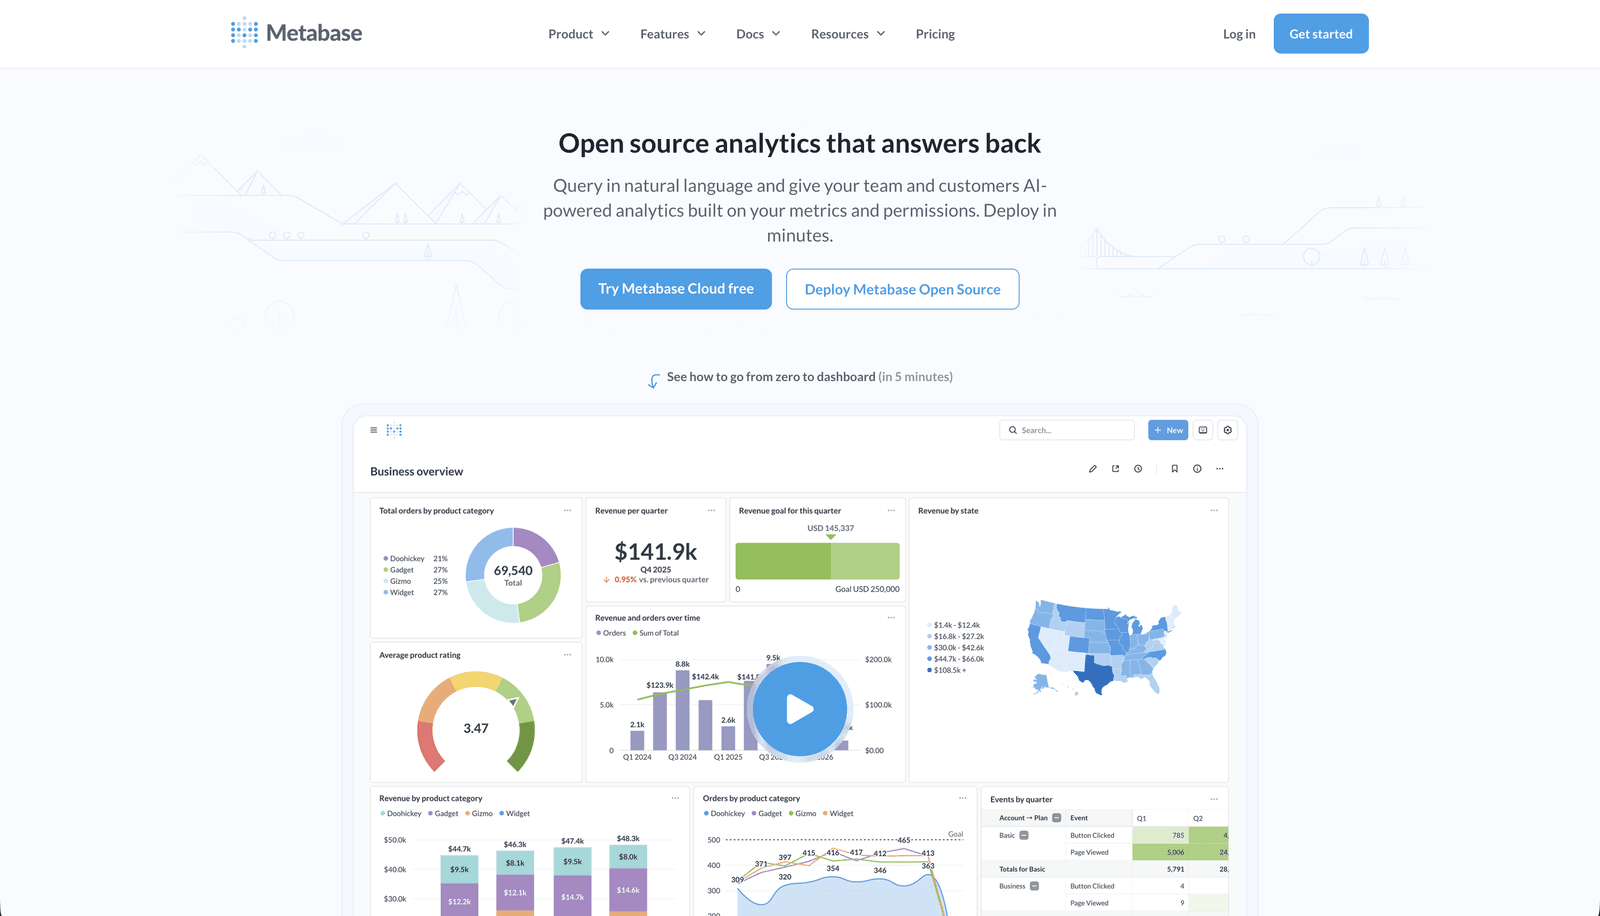
3. Metabase: Best for self-serve business intelligence on CockroachDB data
Best for
Product and operations teams that want a user-friendly BI interface where non-technical users can explore CockroachDB data without SQL.
Metabase connects to CockroachDB using the PostgreSQL driver — since CockroachDB is wire-compatible with PostgreSQL, Metabase treats it like a Postgres database. This gives teams access to Metabase's full feature set including the visual query builder, question-based dashboards, and automated pulses. Metabase has a large user community and extensive documentation, which simplifies adoption.
Metabase is particularly well-suited for teams that want business stakeholders — sales, marketing, support — to explore data independently. The no-SQL interface makes it accessible, and the dashboard sharing and embedding features make it easy to distribute insights. For more complex analytical workflows or customer-facing embedding, Metabase Pro and Enterprise tiers include advanced permissions and embedding controls.
Key features
- Visual query builder with no SQL required for basic reporting
- Connects to CockroachDB via PostgreSQL driver with no extra configuration
- Automated report delivery via email and Slack (pulse feature)
What users say about Metabase
Metabase has one of the most intuitive interfaces I've used for BI. Even team members with no SQL background can build dashboards and answer their own data questions in minutes. — Review on G2
Pricing
Metabase Open Source is free (self-hosted). Metabase Starter starts at $100/month (includes 5 users). Pro starts at $575/month (10 users). Enterprise plans are available.
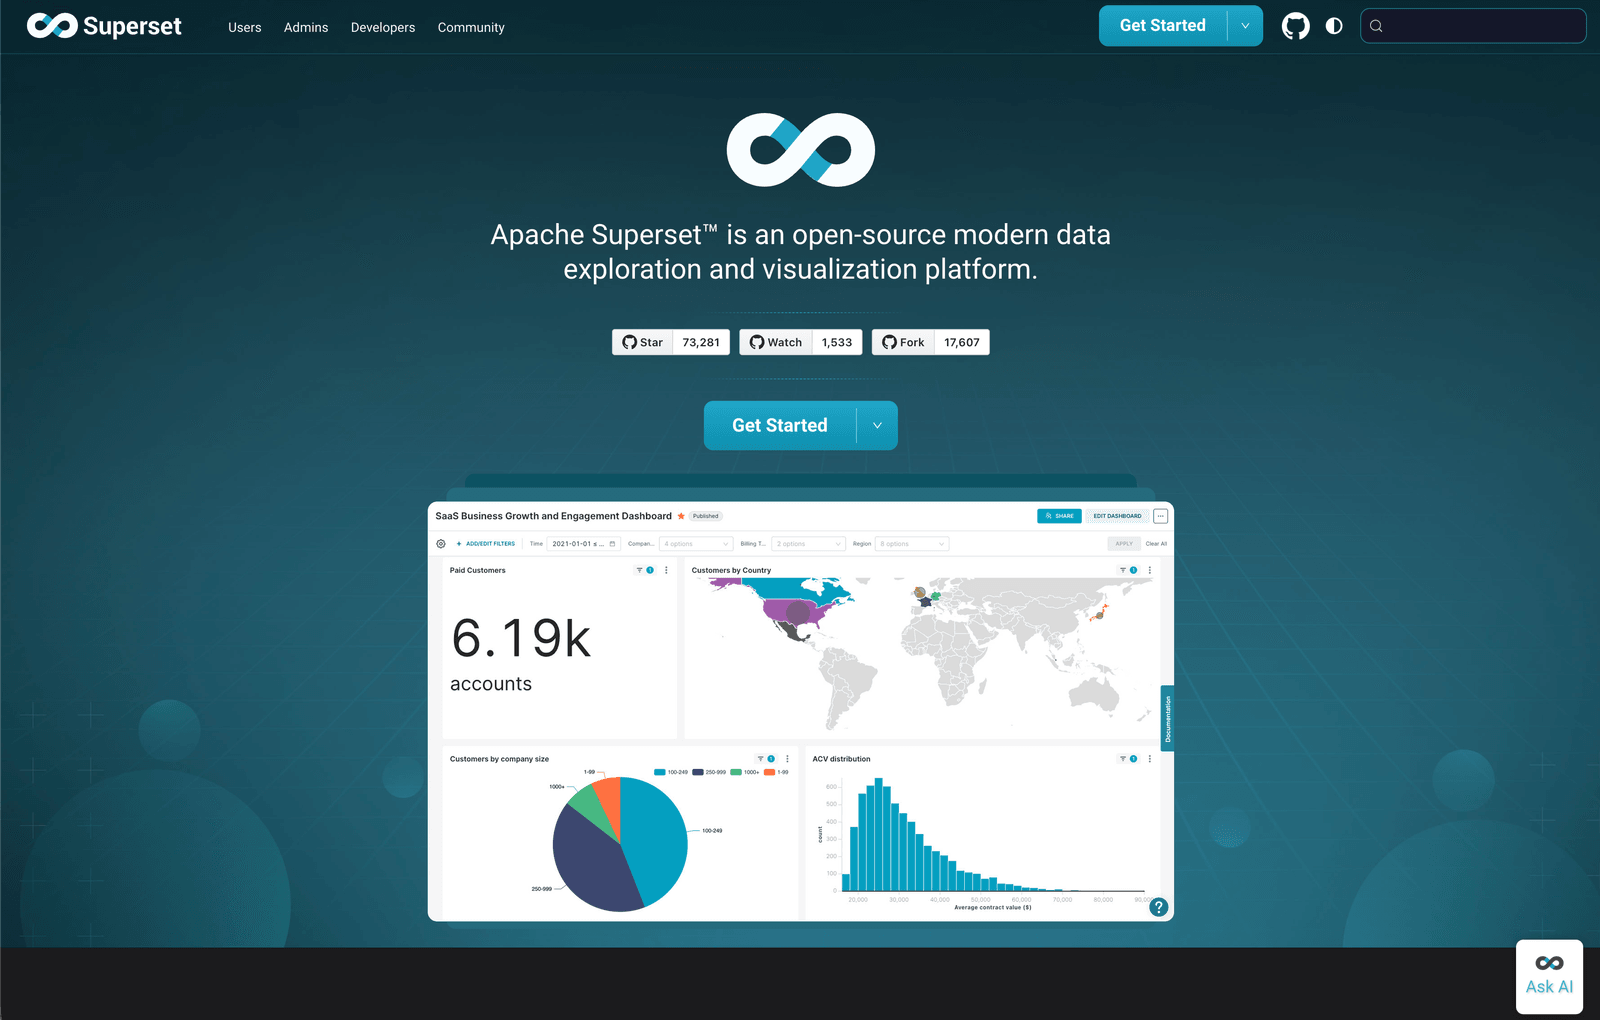
4. Apache Superset: Best open-source BI for CockroachDB with engineering support
Best for
Companies that want an open-source BI platform, have internal engineering capacity, and prefer full control over their analytics infrastructure.
Apache Superset officially lists CockroachDB as a supported database. You connect using a CockroachDB-specific SQLAlchemy URI (cockroachdb://), which requires installing the sqlalchemy-cockroachdb package. Once connected, Superset provides a full SQL IDE, an interactive chart builder, and a broad library of visualizations — all running against your live CockroachDB cluster.
Superset's open-source nature is its greatest strength and also its limitation. It's free and fully customizable, but deploying, securing, and maintaining your own Superset instance requires meaningful engineering time. For teams with that capacity, Superset offers exceptional flexibility — including support for semantic layers, role-based access control, and cross-database queries. For teams that want to move fast without managing infrastructure, a hosted solution may be a better fit.
Key features
- Officially supports CockroachDB via SQLAlchemy dialect
- Full SQL IDE alongside a visual chart builder
- Fully open-source, self-hosted, and extensible
What users say about Apache Superset
We can combine data from different systems for thorough analysis because the platform supports an extensive amount of data sources, including distributed SQL databases. The open-source nature means we can customize it exactly to our needs. — Review on G2
Pricing
Free and open-source. Hosting and maintenance costs vary by deployment size.
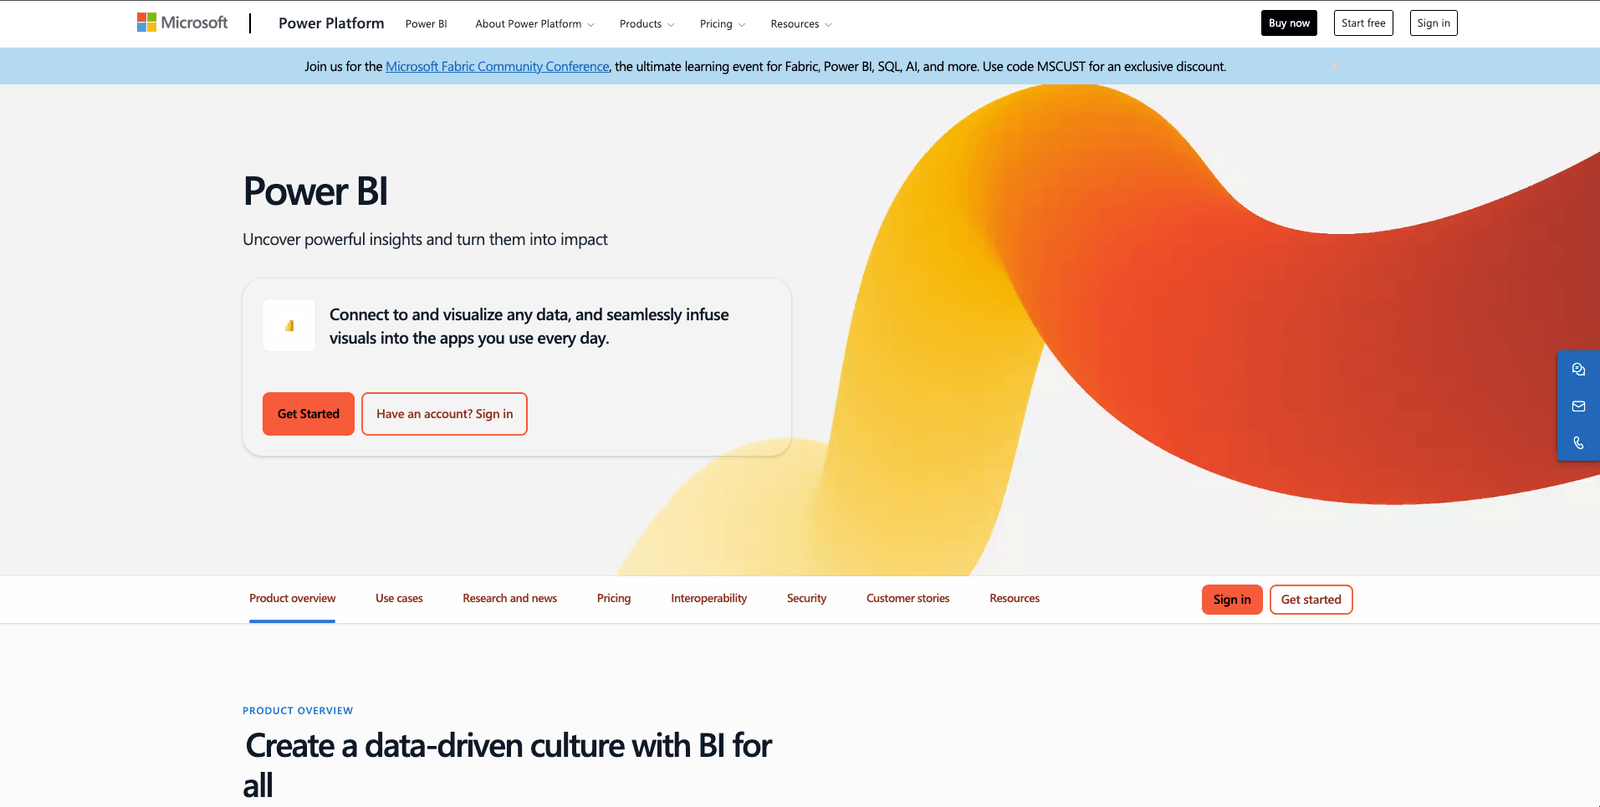
5. Power BI: Best for enterprise teams in the Microsoft ecosystem needing CockroachDB reports
Best for
Enterprise organizations already invested in Microsoft tooling that want to bring CockroachDB data into their existing Power BI workflows.
Power BI connects to CockroachDB through the PostgreSQL connector — since CockroachDB is PostgreSQL wire-compatible, Power BI's native Postgres data source works without additional drivers. For teams that need deeper integration or real-time access, CData also offers a dedicated CockroachDB Power BI Connector. Once connected, users can leverage Power BI's full suite of DAX-based modeling, interactive reports, and enterprise sharing features.
Power BI is a well-understood tool in enterprise environments, which simplifies stakeholder buy-in and reduces training overhead. That said, it is a heavy tool compared to the alternatives on this list — setup, data modeling, and maintenance require dedicated analyst capacity. It's not a good fit for small product teams or fast-moving SaaS environments that need quick access to CockroachDB data.
Key features
- Connects to CockroachDB via PostgreSQL connector with no extra setup
- Advanced DAX modeling and a large library of visualizations
- Deep integration with Microsoft 365, Azure, and Teams for enterprise sharing
What users say about Power BI
What I like most about Power BI is how it turns complex data into something easy to understand. The ability to create interactive dashboards and dynamic reports is a game changer for teams that live inside the Microsoft ecosystem. — Review on G2
Pricing
Power BI Desktop is free. Power BI Pro is $10/user/month. Power BI Premium starts at $20/user/month or a capacity-based plan from $4,995/month.
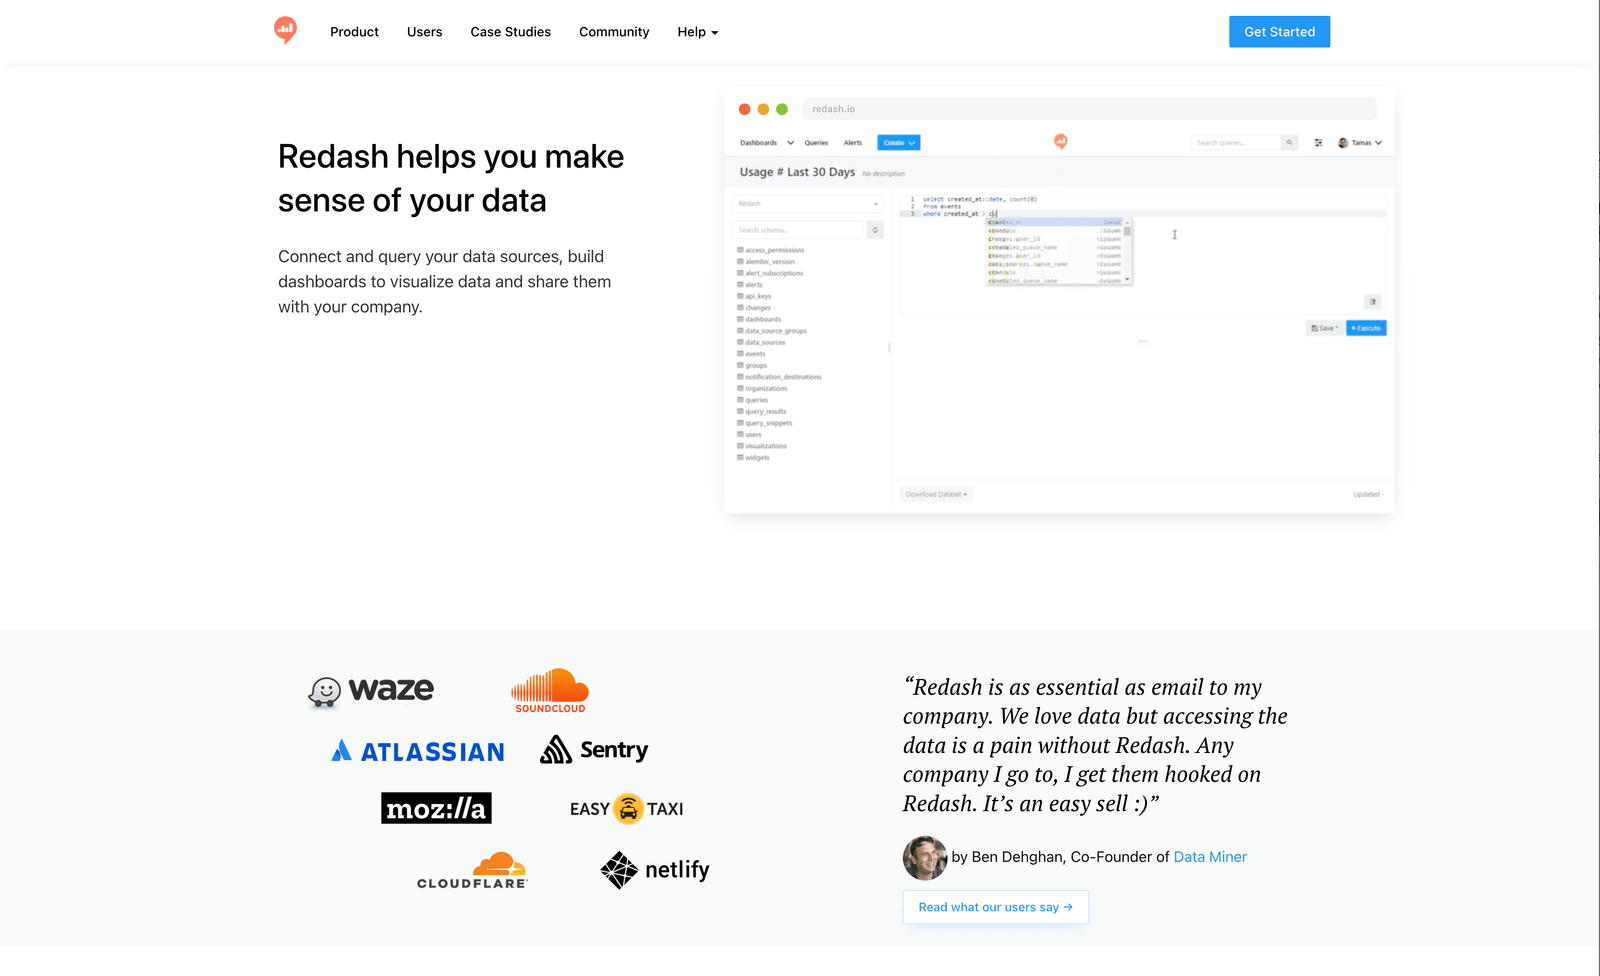
6. Redash: Best lightweight, open-source query and dashboard tool for CockroachDB
Best for
Small engineering teams that need a simple, SQL-driven dashboard tool and are comfortable self-hosting or using a managed provider.
Redash connects to CockroachDB using the PostgreSQL data source option — because CockroachDB speaks the PostgreSQL wire protocol, Redash's built-in PostgreSQL connector works without additional configuration. Redash is designed around the SQL editor workflow: write a query, save it, visualize the result, and add it to a shared dashboard. It's lightweight, fast to set up, and gets out of the way of engineers who just want to share SQL results with their team.
The hosted version of Redash was shut down, so you'll need to self-host or use a managed provider. For teams willing to manage their own instance, Redash is an easy way to give colleagues controlled access to CockroachDB data through shared dashboards and scheduled query refreshes without investing in a full BI platform.
Key features
- Connects to CockroachDB via the built-in PostgreSQL data source
- SQL-first workflow with dashboard sharing and scheduled query refreshes
- Fully open-source and self-hostable
What users say about Redash
On Redash we store several data from our internal system and database that could be complicated to find with manual research or using other tools. Everything is in one single place and you can share the queries and dashboards with anyone. — Review on G2
Pricing
Free and open-source (self-hosted). Managed hosting starts at approximately $25–$40/month for a small instance. Premium plans from third-party providers start at $10/month.
Implementing your CockroachDB reporting tool effectively
Choosing the right CockroachDB reporting tool is only the first step. Connecting to your cluster and building a few dashboards gets you started, but long-term value depends on how well you integrate reporting into your team's workflow.
1. Onboarding your team
Invest in proper onboarding from the start. Whether your team includes developers, product managers, or support staff, everyone who will use dashboards should understand the tool, know which reports exist, and feel comfortable adding filters or adjusting views. A short onboarding session prevents bottlenecks and avoids situations where reporting still falls back on one engineer.
2. Start with a pilot
Rather than rolling out dashboards company-wide immediately, start with one team or one use case. A focused pilot helps you validate that your CockroachDB queries return accurate results, your permissions are configured correctly, and the dashboards actually answer the questions stakeholders care about. It also reduces the risk of noisy, unused reports that undermine trust in your data.
3. Collect feedback continuously
Reporting is a living part of your product, not a one-time setup. Actively collect feedback from the people using your dashboards — internal teams or customers — and treat it like product feedback. As your schema evolves and your business questions change, your dashboards should evolve alongside them.
4. Monitor performance and usage
CockroachDB is designed to handle distributed, high-concurrency workloads, but poorly written reporting queries can still cause performance issues. Monitor which queries run most frequently, which dashboards get viewed regularly, and which reports are ignored. Optimize slow queries, retire dashboards that nobody opens, and use this data to improve the ROI of your reporting layer over time.
Conclusion
The CockroachDB reporting tool you choose determines how your team and your customers experience data. It shapes whether stakeholders can answer their own questions or depend on engineers for every insight. It determines whether your analytics layer is a drag on your infrastructure or a reliable part of your product.
CockroachDB's PostgreSQL wire compatibility means you have a wide range of battle-tested reporting tools to choose from — from purpose-built dashboard tools to open-source BI platforms to enterprise suites. The right choice depends on your team's size, technical resources, and whether you need internal visibility, customer-facing dashboards, or operational monitoring.
If you want a reporting layer that connects to CockroachDB without pipelines or extra infrastructure, Draxlr lets you ship dashboards quickly while keeping your stack simple. Whether your priority is team analytics, embedded customer dashboards, or scheduled reporting, it's worth exploring what fits your workflow.
FAQs
1. What is a CockroachDB reporting tool?
A CockroachDB reporting tool connects directly to your CockroachDB cluster and lets you build dashboards, charts, and reports without writing SQL for every request. These tools give teams safe, structured access to live data without requiring ETL pipelines or a separate analytics warehouse.
2. Can I connect standard Postgres reporting tools to CockroachDB?
Yes. CockroachDB is wire-compatible with PostgreSQL, which means most tools that support Postgres — including Metabase, Redash, Superset, Power BI, and Draxlr — can connect to CockroachDB using standard PostgreSQL credentials and connection strings.
3. Does CockroachDB have built-in reporting?
CockroachDB includes a DB Console with cluster monitoring dashboards for nodes, SQL performance, and storage. However, the DB Console is designed for operational visibility rather than business reporting or customer-facing dashboards.
4. Is it safe to connect a reporting tool directly to a CockroachDB cluster?
Yes, provided the tool uses secure connections, respects your database-level permissions, and supports user-scoped access controls. Use read-only credentials for your reporting connection and avoid tools that require copying or exporting your data to external servers.
5. Can non-technical team members use CockroachDB reporting tools?
Yes. Tools like Metabase and Draxlr offer visual query builders, saved reports, and interactive filters that let product, support, or operations teams explore CockroachDB data without writing SQL.
6. Do I need a data warehouse to report on CockroachDB?
Not in most cases. CockroachDB's distributed SQL architecture handles complex queries well, and most reporting tools connect directly to it without requiring a separate warehouse. A warehouse becomes relevant only for very large-scale analytical workloads or when you need to combine CockroachDB data with other sources.
About the author

Vivek is a coder and the founder of Draxlr who cares deeply about building good products. He works at the intersection of AI, SQL, dashboards, and embedded analytics, with a strong focus on making complex data workflows feel simple, useful, and fast for real teams.
If you have questions about anything in this guide, or want to compare options for your specific stack, you can email Vivek at vivek@draxlr.com, try Draxlr free, or reach out directly through the Draxlr team.