How to build Dashboards from Cockroach DB data
By creating dashboards with data from Cockroach DB, a distributed SQL database, Draxlr visualises your Cockroach DB data and assists you in making better business decisions.

Cockroach is a distributed SQL database that helps you run your database at scale, so you don't have to worry about your database's performance for your users across the world.
Key highlights of Cockroach DB:
- Scale indefinitely without the need for painful sharding.
- No outages or downtime.
- By rapidly deploying anywhere across the world, you can ensure low-latency data access and compliance with data regulations.
- It allows you to achieve maximum fault tolerance by deploying across different clouds.
- Use SQL to run your queries.
- Awesome support from a team of experts.
Using Draxlr to Build Dashboards from Cockroach Data
Draxlr is a no-code business intelligence solution that allows you to create dashboards, receive data alerts, and embed dashboards on customer-facing websites.
Draxlr connects with the Cockroach DB database and helps you get data answers without writing SQL.
Here is a quick video walkthrough of how to build a dashboard from Cockroach DB data in Draxlr:
Ok, let's go!
Connecting Cockroach DB with Draxlr
In Cockroach DB, you can have multiple clusters, and each cluster can have multiple databases.
-
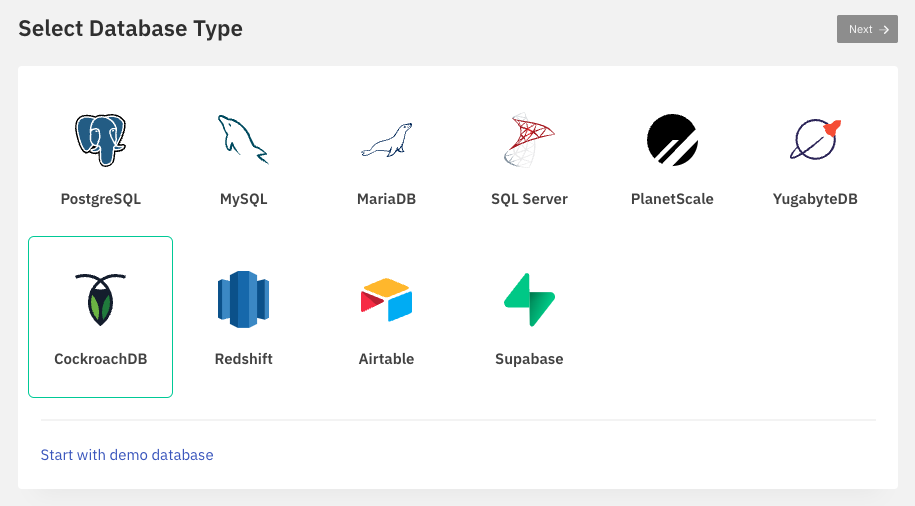
Login to Draxlr, visit the Add Database page, and select CockroachDB.
-
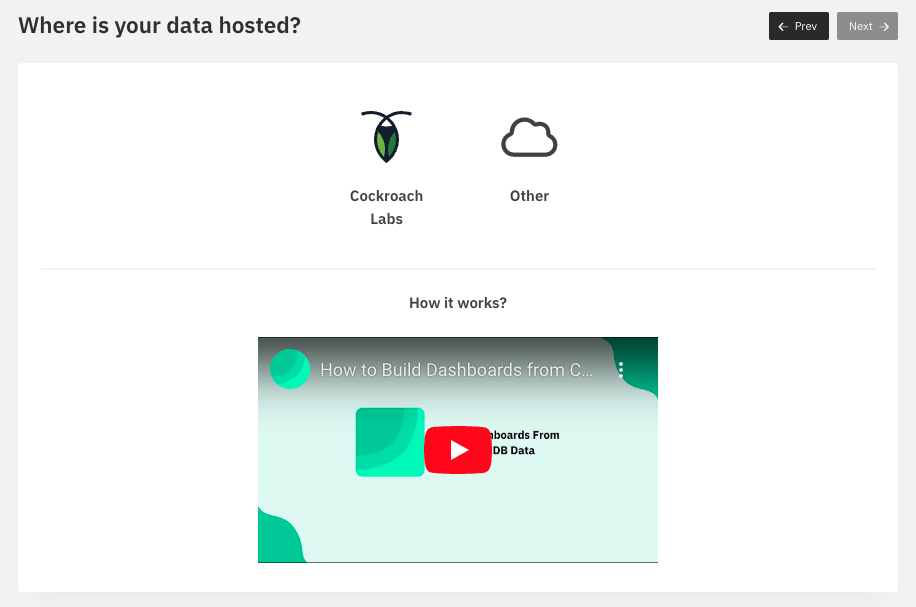
Select the source where your database is hosted.
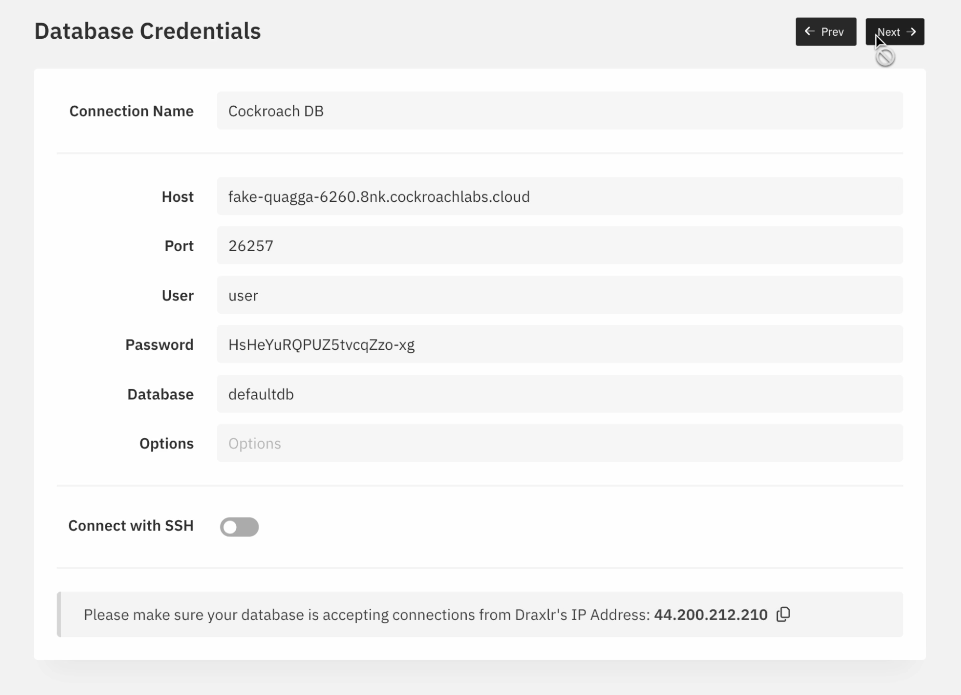
- You can now enter the database credentials of CockroachDB into Draxlr.
- Let's consider that your Cockroach DB is hosted on CockroachLabs. You can visit their site and select the database that you want to connect with.
-
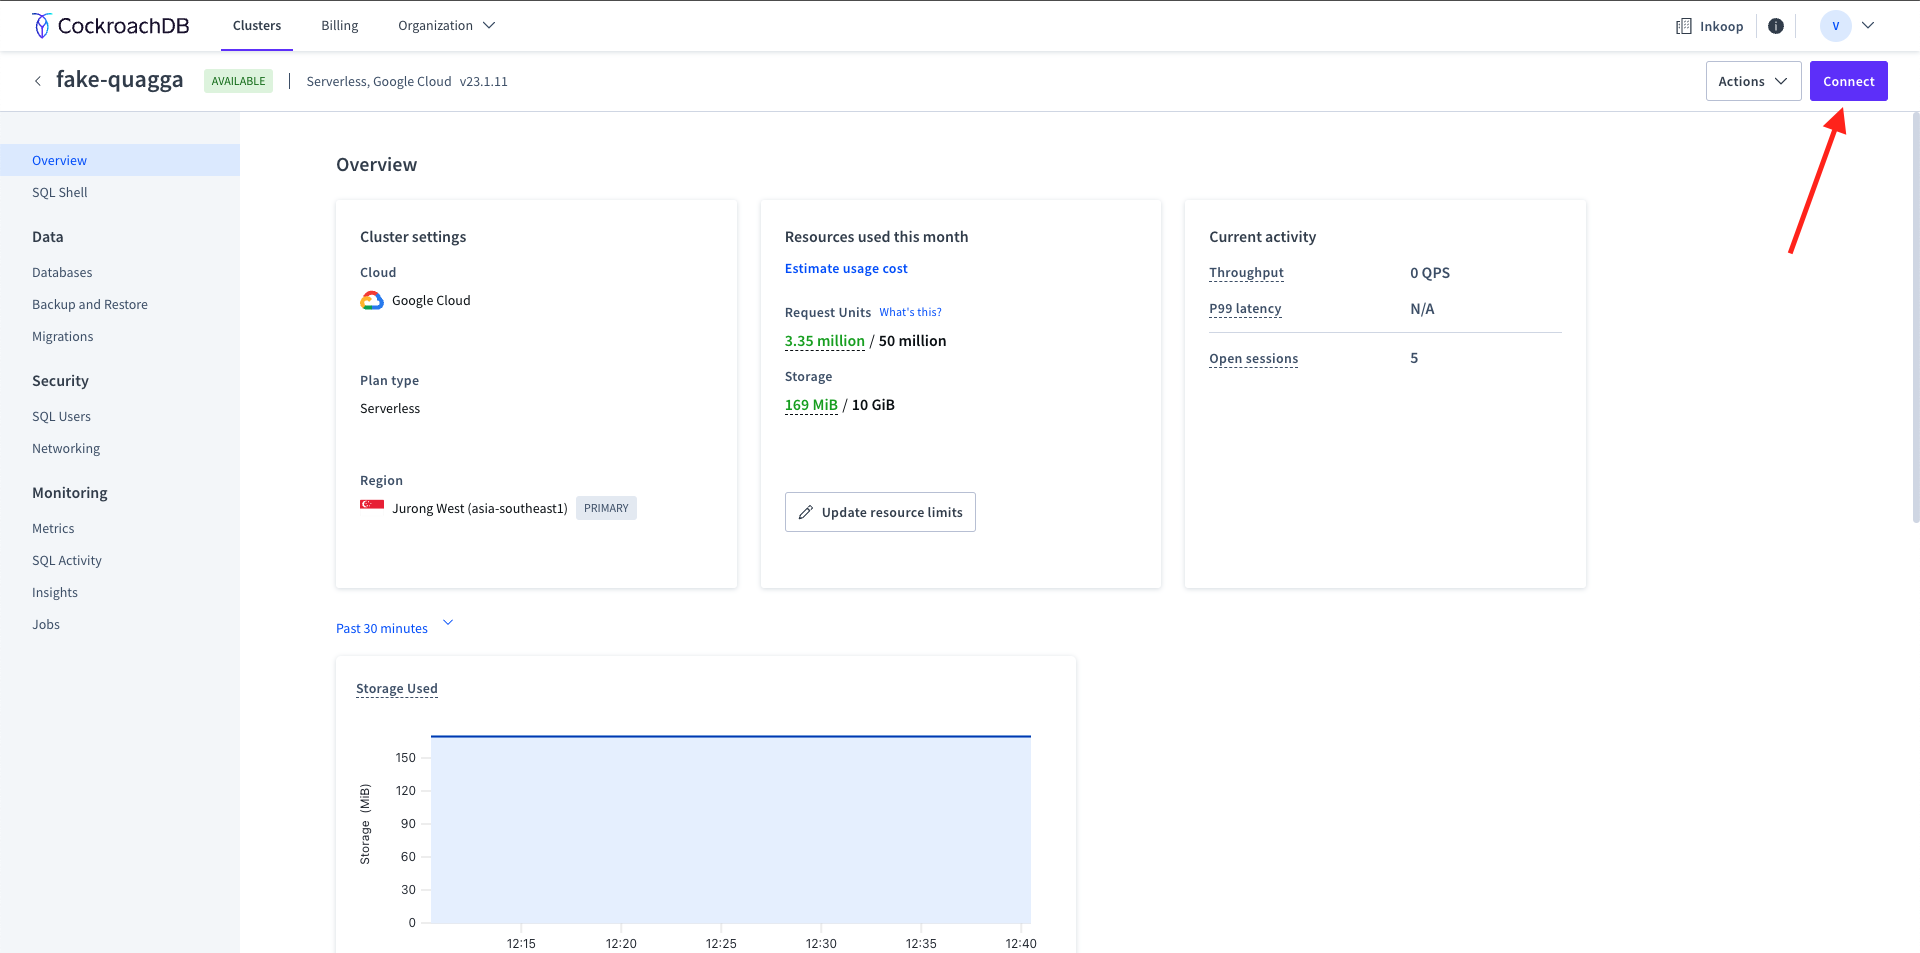
Click on the "Connect" button on the database; it will open a pop-up with options to connect to your database.
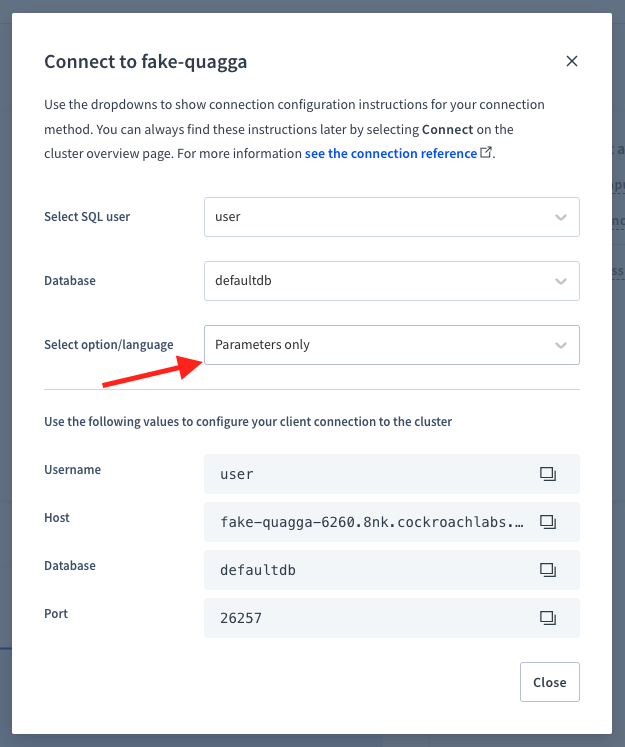
 On the pop-up, you can select "Parameters only" in the "Select option/language" field, and you can see the required credentials for the database.
-
You can now copy the credentials from CockroachLabs UI to Draxlr and enter the database password as well. Click on "Next" once you are done.
-
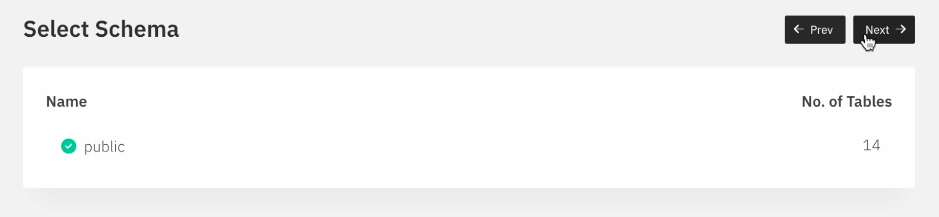
You can now select the database schema; by default, it is public.
-
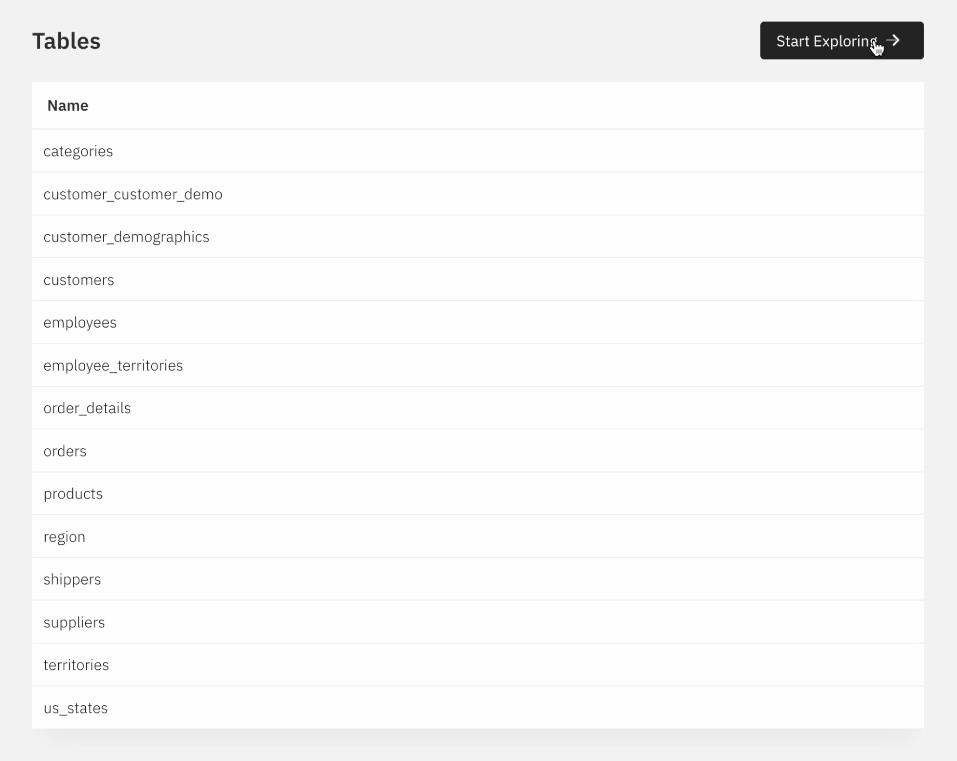
Now you can see the list of tables, and you can start exploring your data.
Generating queries and visualising the data
After connecting Cockroach DB with Draxlr, you can build dashboards from your Cockroach DB data.
- You can generate data with Draxlr's no-code query builder by using Filters, Joins, Sort, Summarise, and Group by options.
- When you get the desired data output, you may visualise it using a variety of graph options, such as bar, pie, line, area, and others.
- For example, here we showcase two queries that are built using the query builder.
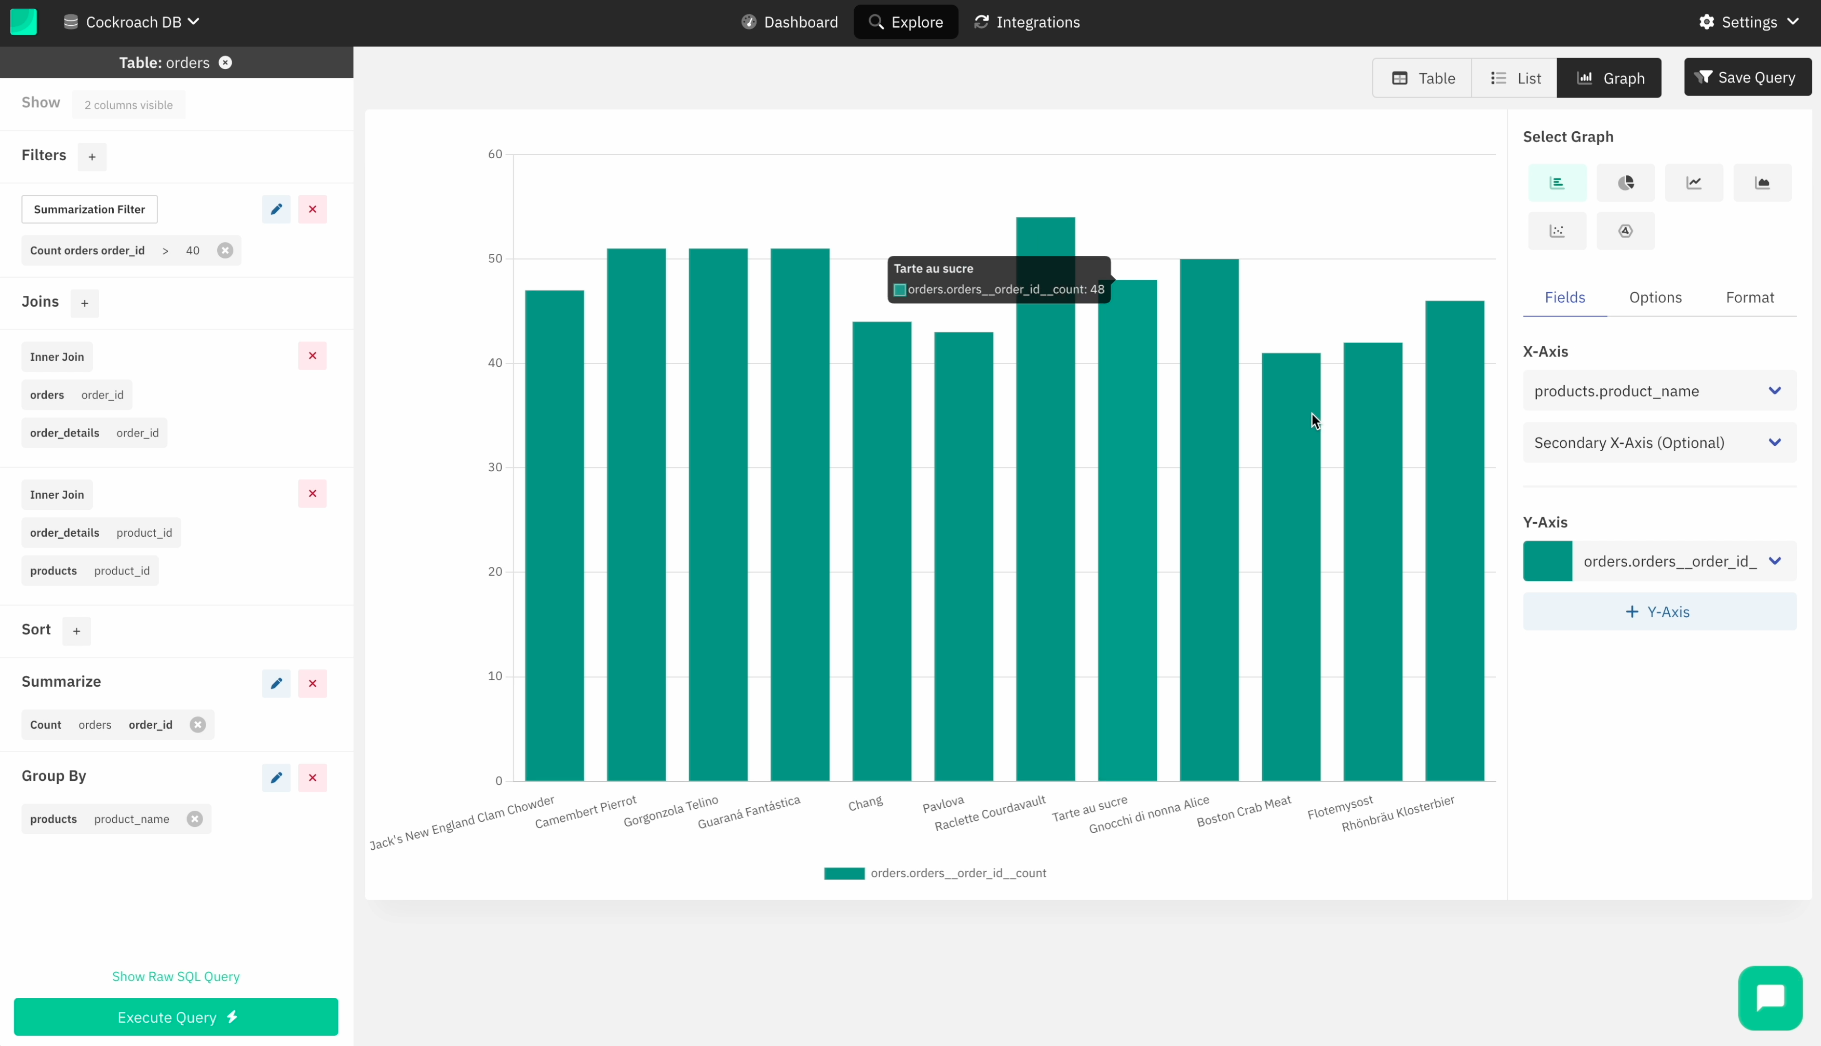
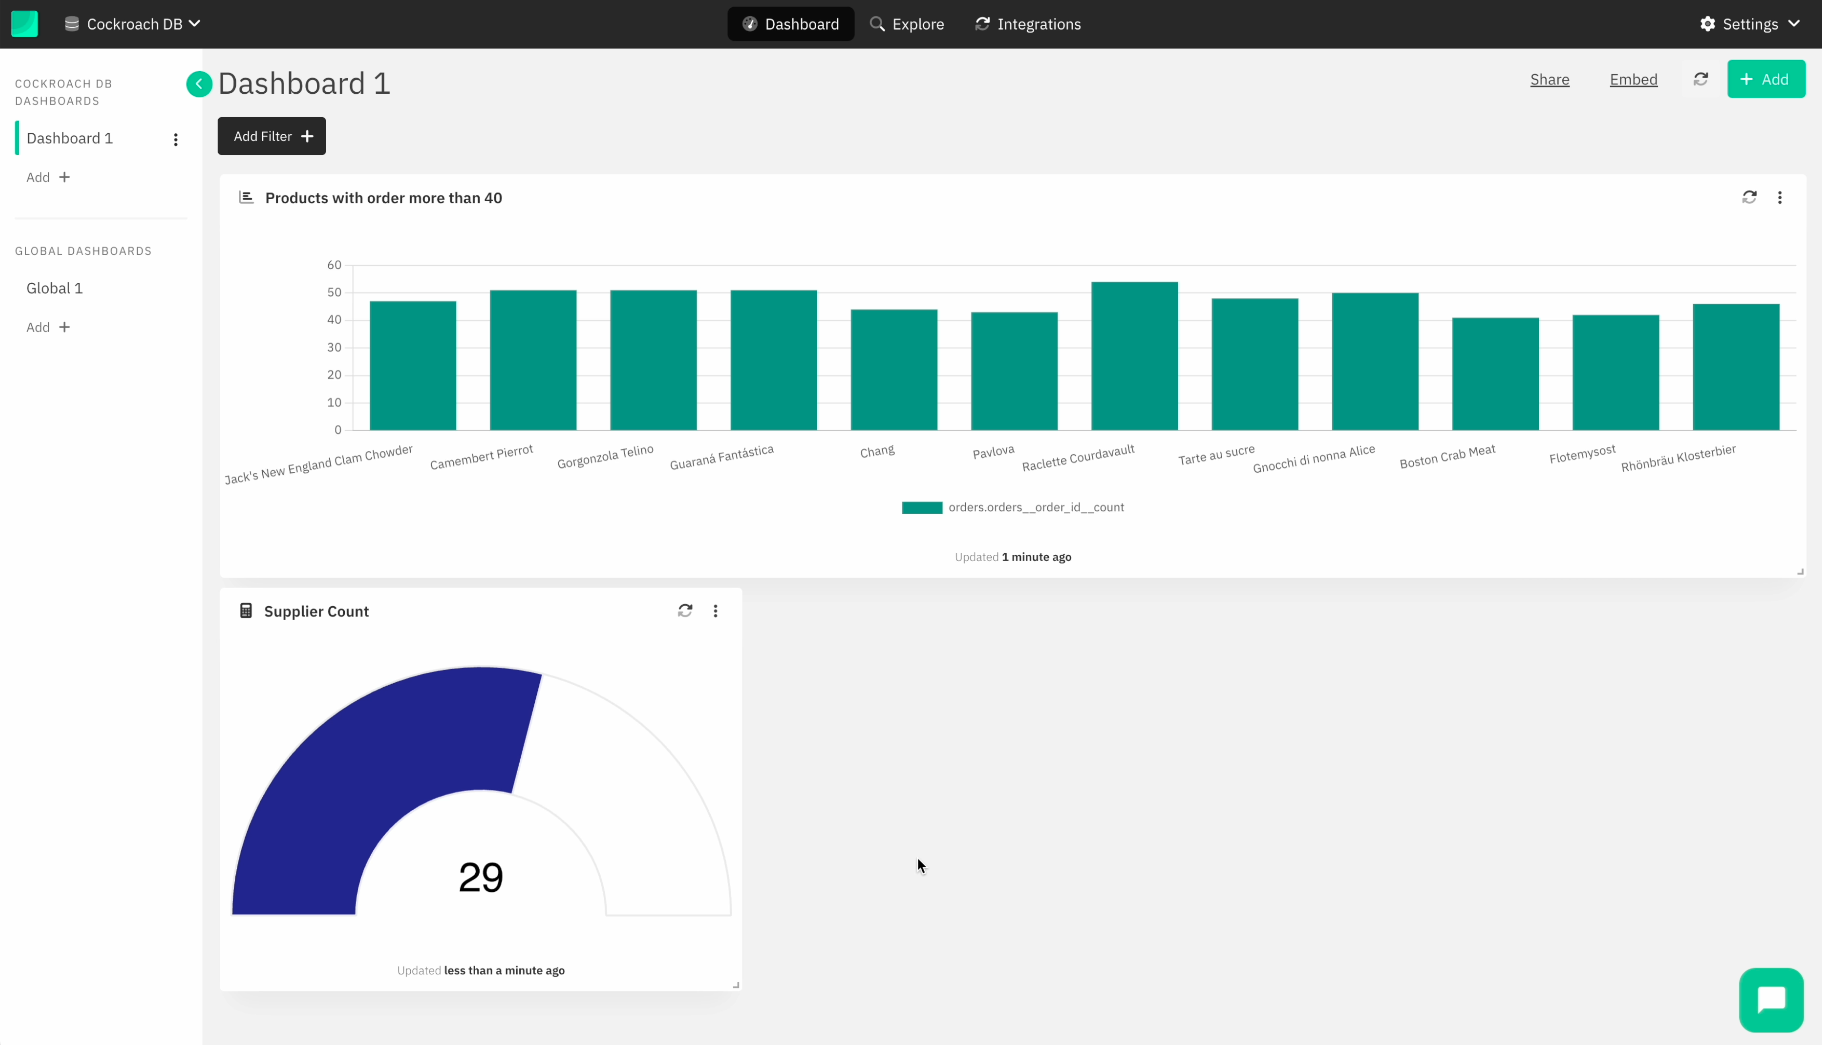
- Products with an order of more than 40
- We select the "orders" table and join the "order_details" and "products" tables. We then group the results by product's name and summarise by count of products.
-
We can also filter the products that have more than X orders.
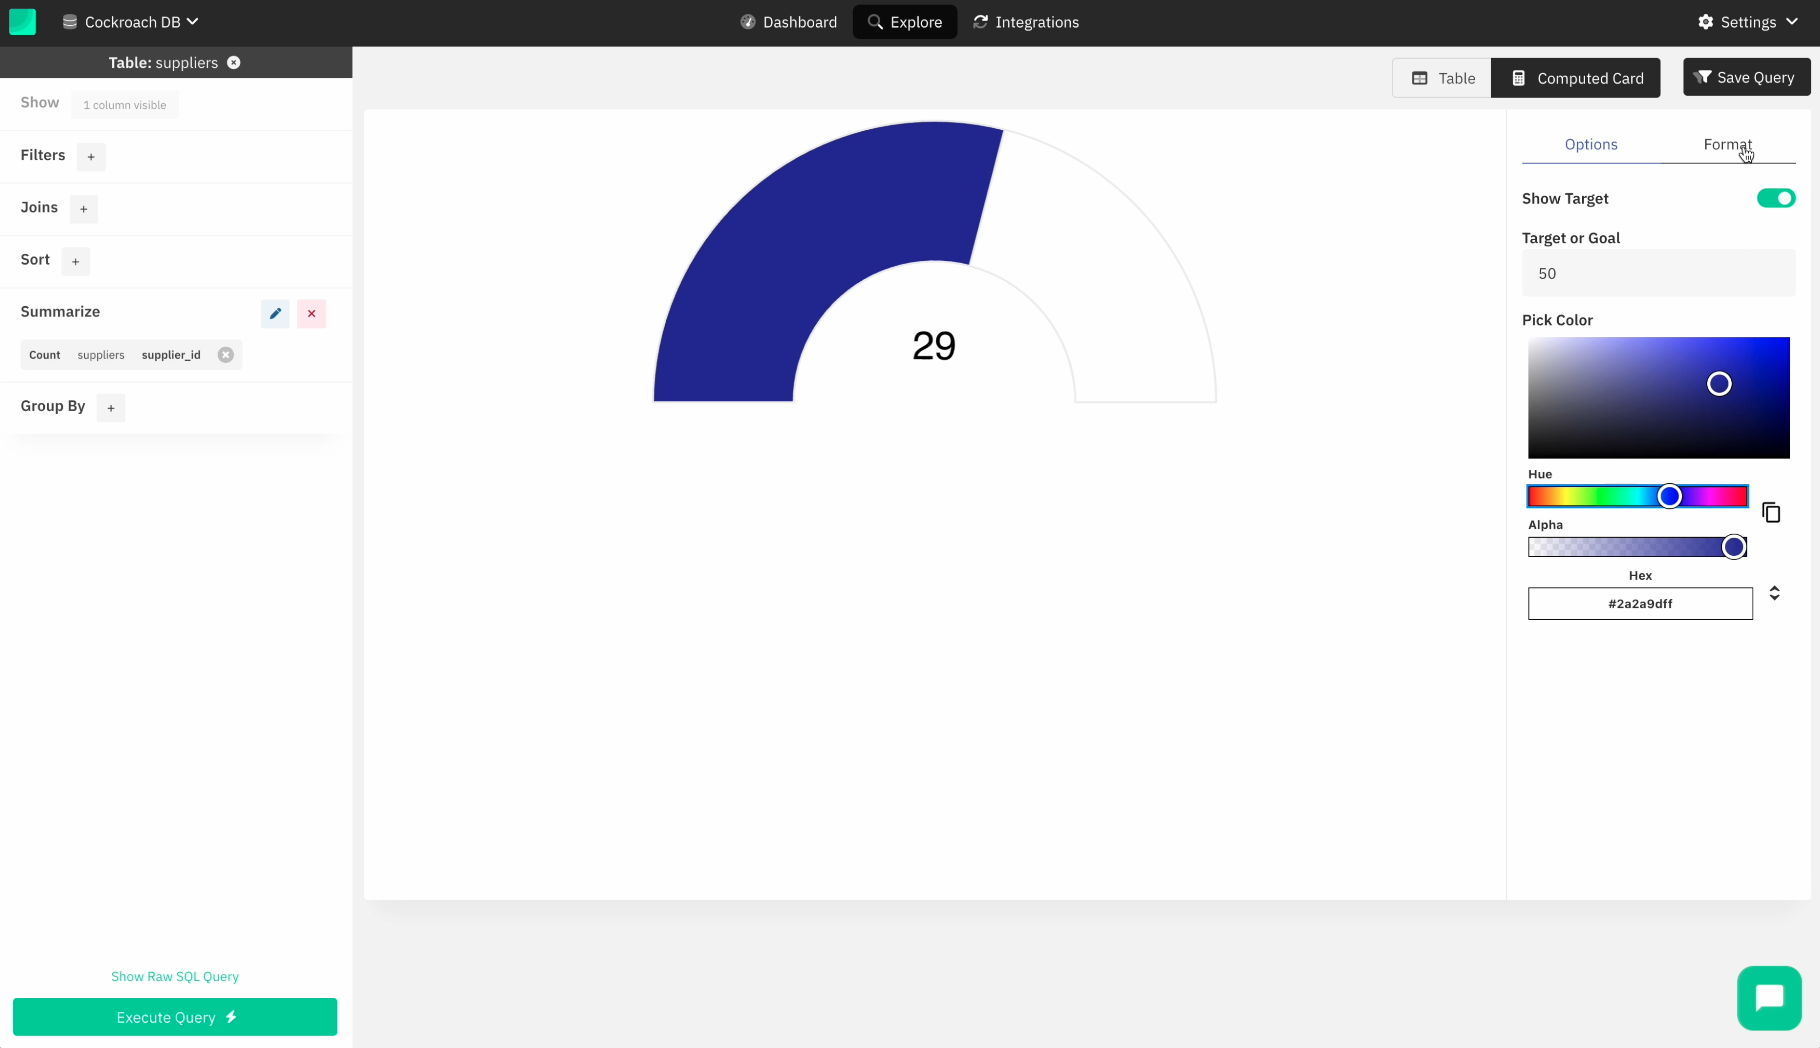
- Suppliers count
-
We select the "suppliers" table and perform a count on the table. We then show the result in the form of a gauge chart.
-
We select the "suppliers" table and perform a count on the table. We then show the result in the form of a gauge chart.
- After you've finished configuring the graphs, you can save the query and add it to a dashboard.
-
That's it; your dashboard is complete!
- You can share the dashboard with your team, embed the dashboard in your customer-facing application, and even set a schedule to receive a snapshot of the dashboard every day.
- You can also set Slack or email alerts that trigger alerts when data changes in the queries that you have created.
You can make smarter business decisions by using dashboards created from your data. You can also set up data alerts to get notified when your data changes by email or Slack.
- Vivek
About the author

Vivek is a coder and the founder of Draxlr who cares deeply about building good products. He works at the intersection of AI, SQL, dashboards, and embedded analytics, with a strong focus on making complex data workflows feel simple, useful, and fast for real teams.
If you have questions about anything in this guide, or want to compare options for your specific stack, you can email Vivek at vivek@draxlr.com, try Draxlr free, or reach out directly through the Draxlr team.

