AI SQL Tool: What it is and How to Build Dashboards from Plain-English Questions
Use Draxlr’s AI SQL tool to turn plain English into powerful SQL queries, build dashboards instantly, and get insights without writing a single line of code.

The AI SQL tool is changing how teams access data.
Yet, writing SQL still feels intimidating for many. Not everyone on your team can run a "SELECT * FROM" confidently. But they do have questions about the data.
"Which campaign got us the most users?"
"What’s our revenue in Europe?"
These questions often sit in Slack threads or email drafts, waiting on someone with SQL expertise.
That’s where AI SQL tools come in.
In this guide, you’ll learn exactly how AI SQL tools work, why they matter, and how Draxlr makes querying, charting, and dashboard building as easy as asking a question.
What is an AI SQL tool?
An AI SQL Tool is software that turns plain English into working SQL queries. It removes the need for manual SQL writing and opens access to data for all roles across the company. Think of it as a translator between humans and databases.
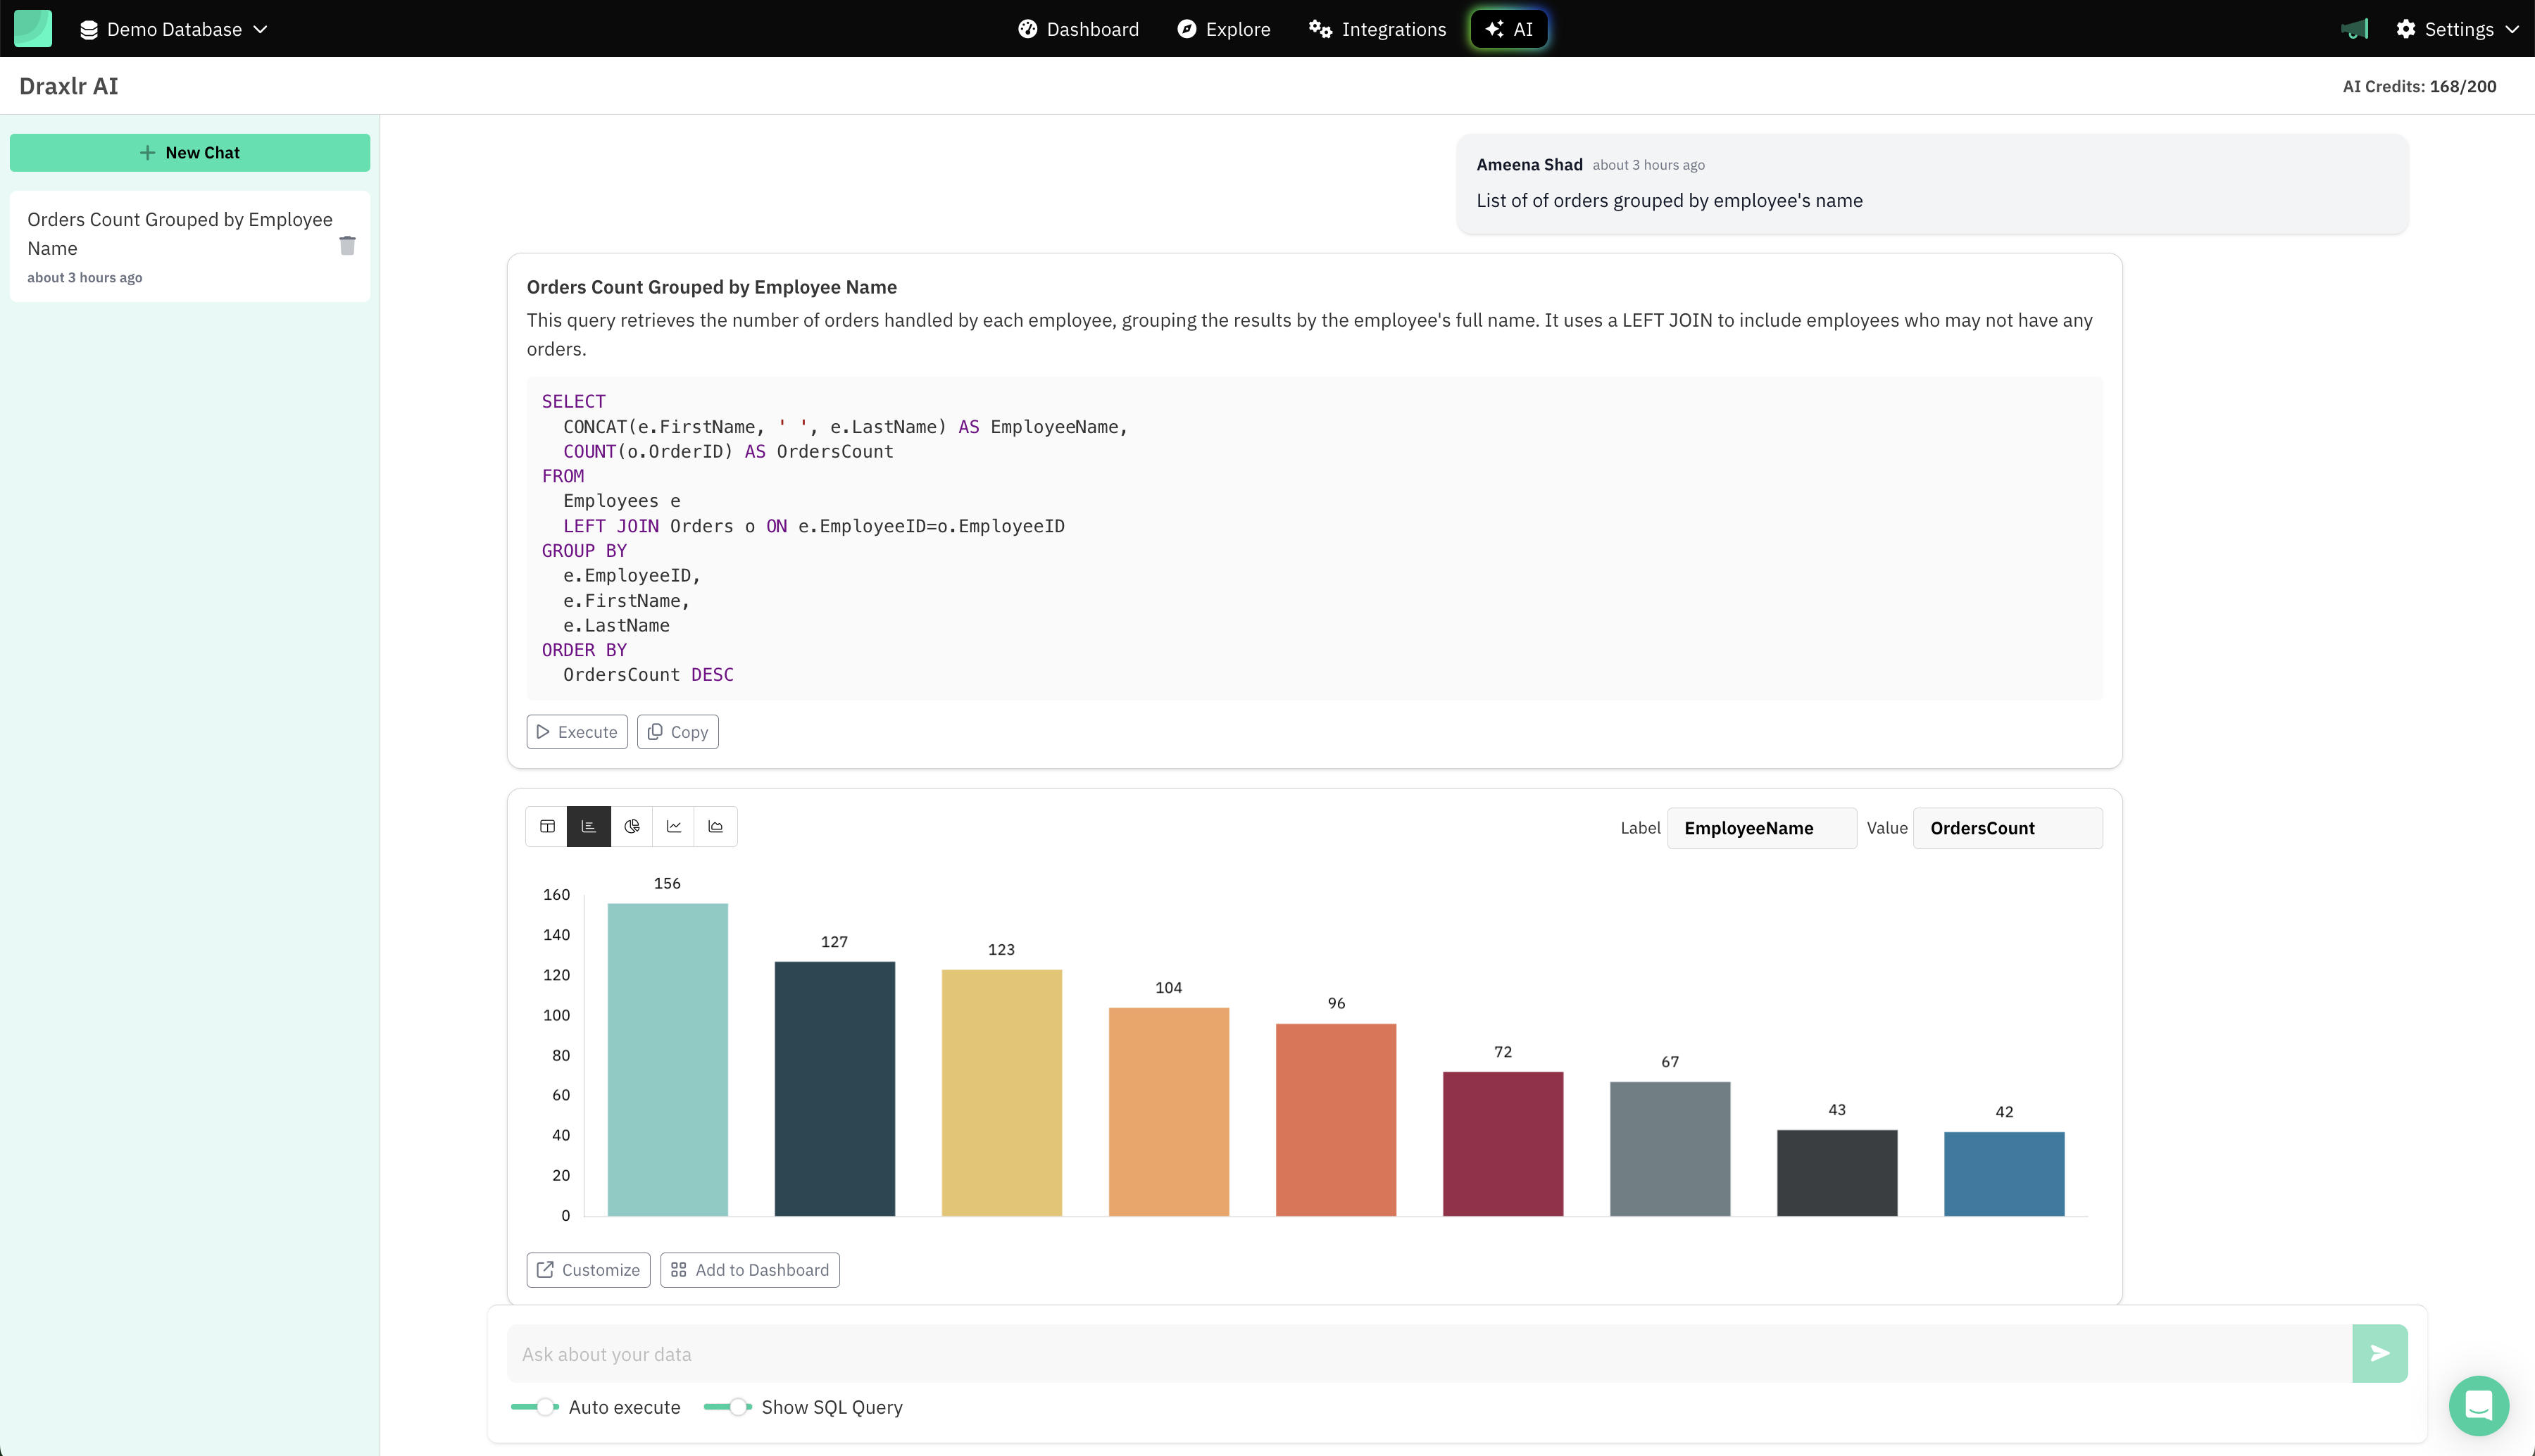
Using it feels like chatting with your database, just like you would with ChatGPT. You ask a question, the AI understands your intent, and gives you a ready-to-use SQL query along with a clear visual result.
You type "List of orders grouped by employee's name" and get an SQL query and visualization.
How does an AI SQL tool work under the hood?
An AI SQL tool is not magic. It combines three things to turn your question into an accurate query:
- Schema awareness: The tool reads your database schema, including table names, column names, data types, and relationships between tables. This gives the AI the vocabulary it needs to map your question to real data.
- A large language model (LLM): Your plain-English question is sent to an LLM along with the schema context. The model uses both to infer intent, pick the right tables, apply the right joins, and generate a syntactically valid SQL statement.
- Execution and visualization layer: The generated SQL is run against your database, and the result set is analyzed to suggest the best chart type, whether that is a bar chart, pie chart, time series, or table.
The quality of an AI SQL tool depends heavily on how well it grounds the LLM in your actual schema. Tools that only pass the question to a generic model without schema context tend to hallucinate column names and produce queries that fail.
For a deeper technical breakdown of every stage in this pipeline — tokenization, schema linking, prompt assembly, validation, and the self-repair loop — see Natural Language to SQL: How It Works Under the Hood.
Who Uses the AI SQL Tool?
The AI SQL Tool meets people where they are, making data instantly usable for different roles across the company.
- Founders: Track feature adoption, product usage, and growth trends without relying on an analyst.
- Product Managers: Get real-time answers about user behavior, funnel drop-offs, and feature engagement using plain English.
- Marketers: Analyze campaign performance, channel ROI, and regional impact without sifting through complex spreadsheets.
- Executives: Ask high-level questions about revenue, churn, or monthly active users and get visual answers you can act on.
If you ask questions and care about data-driven decisions, AI SQL Tool is built for you.
How an AI SQL Tool Benefits Your Team
When evaluating an AI SQL tool, it's essential to understand exactly how it improves your daily workflow and contributes to your team's productivity.
1. Simplicity and ease of use
A great AI SQL tool removes complexity completely. It lets anyone on your team, no matter their technical expertise, ask data questions naturally. Evaluate this carefully:
- Can your marketing manager easily get insights from your database without relying on a data analyst?
2. Accuracy and trust in data
Data decisions are only valuable if the underlying data is accurate. Verify:
- Does the tool consistently provide accurate, error-free queries, building confidence rather than doubt?
3. Actionable insights, not just raw queries
An effective AI SQL tool should do more than just write queries. It should deliver visual, actionable insights ready to integrate into your workflows. Confirm:
- Can you instantly create dashboards, schedule automated reports, or embed analytics directly into your business tools?
A typical before-and-after: what teams actually save
Consider a mid-size SaaS team with one data analyst and a steady stream of ad-hoc requests.
Before an AI SQL tool: A product manager pings the analyst asking for weekly signup breakdowns by plan. The analyst is mid-sprint on a retention model, so the request waits two days. When the query is finally written, the PM wants a small tweak — another half-day round trip. Multiply this across marketing, support, and leadership, and the analyst spends 10–15 hours a week on repeat one-off queries.
After adopting Draxlr: The same PM types "weekly signups by plan over the last 8 weeks" directly into Draxlr, gets the SQL, the chart, and pins it to a dashboard in under two minutes. The analyst gets those 10–15 hours back for the retention model. Decisions that used to wait days happen in the same meeting they are raised in.
The real return isn't just faster queries — it's the end of the queue between a business question and a business answer.
"Draxlr helps me turn raw SQL data into clear dashboards without needing a data team. It saves time by letting me build and share reports directly from my database, using either AI, SQL, or their Visual Query Builder."
— Verified G2 Reviewer ⭐ 4.9/5 on G2
How Draxlr Compares to Other AI SQL Tools
Choosing the right AI SQL tool depends on your team’s size, technical depth, and budget. Here is how the leading options stack up:
| Tool | Starting Price | AI SQL Generation | Dashboard Building | Best For |
|---|---|---|---|---|
| Draxlr | $25/month | Yes | Yes | Small to mid-size teams wanting fast, affordable insights |
| Looker (with Gemini) | ~$5,000/month (custom) | Yes | Yes | Enterprises already on Google Cloud needing governed BI |
| Metabase + Metabot AI | ~$200/month ($100 base + $100 AI add-on) | Yes | Yes | Technical teams comfortable with self-hosted BI |
| Tableau + Tableau Agent | $70+/user/month | Yes | Yes | Enterprise teams already in the Salesforce ecosystem |
| ThoughtSpot | ~$1,250/month | Yes | Yes | Large enterprises with high query volume and big budgets |
Why Draxlr stands out:
- Flat pricing, not per-seat. $25/month covers your whole team, unlike Tableau ($70/user) or ThoughtSpot (enterprise contracts).
- No add-on tax for AI. AI SQL generation is included, not a $100/month bolt-on like Metabot.
- Zero setup overhead. No self-hosting like Metabase, no Salesforce ecosystem lock-in like Tableau, and no sales call to see pricing like ThoughtSpot.
- Built for business users first. Looker and Tableau require a modeling layer (LookML) or a Salesforce-trained admin; Draxlr is designed so a marketer or founder can get a dashboard without ever seeing SQL or setup overhead.
If your team wants AI-powered insights without enterprise budgets or dedicated BI engineers, Draxlr is the most accessible entry point.
Draxlr pricing at a glance
| Plan | Price | Databases | Users | Best For |
|---|---|---|---|---|
| Starter | $25/month | 1 | Small team | Founders and solo operators getting started |
| Growth | $75/month | 2 | 10 users | Growing teams needing multi-DB access and collaboration |
| Scale | $125/month | 5 | 30 users | Mid-size companies with multiple teams and data sources |
All plans include AI SQL generation, dashboards, scheduled alerts, and embeds — no feature gating, no per-seat surprises.
How to build dashboards using Draxlr’s AI SQL tool
With Draxlr, you type your question in plain English. The tool generates the SQL, runs the query on your database, and shows the result as a visualization. The entire process takes minutes and requires no coding. Here’s how it works:
1. Connect your database
Begin by securely connecting your SQL database to Draxlr. It supports popular databases like PostgreSQL, MySQL, MSSQL, Databricks, and more. Instead of syncing or storing your data, Draxlr only reads the schema, which is the structure of your data, including table names, columns, and how they relate to each other.
Time to first dashboard: under 5 minutes. Most teams go from signup to their first AI-generated chart in a single coffee break — no DBA involvement, no schema modeling, no waiting on a sales demo. If you want to skip the database step entirely, Draxlr ships with demo data so you can try it immediately.
2. Ask a question in plain English
Once your database is connected, or if you choose to use Draxlr’s demo data, you can begin asking questions immediately.
For example, with the demo database, you can try
- "Show me total revenue by country for the last three months."
- "Give me all the products by category."
Draxlr AI understands your question in plain English and converts it into an SQL query that works with your actual schema. You do not need to know the structure of your tables or the exact column names.
3. Get SQL and visualizations that match your query result.
After you ask a question, Draxlr analyzes it and generates an SQL query that matches your database structure. The SQL is built with full awareness of your table names, column naming patterns, and how your data is connected.
This includes:
- Joins across related tables
- Filters for date ranges, categories, or custom conditions
- Grouping and aggregations based on the intent of your question
You can choose to view or hide the generated SQL. Along with the query, Draxlr also returns visual representations of the result. Whether the data fits a bar chart, pie chart, time series, or table, Draxlr suggests chart types that best match the output. There is no need to configure anything manually.
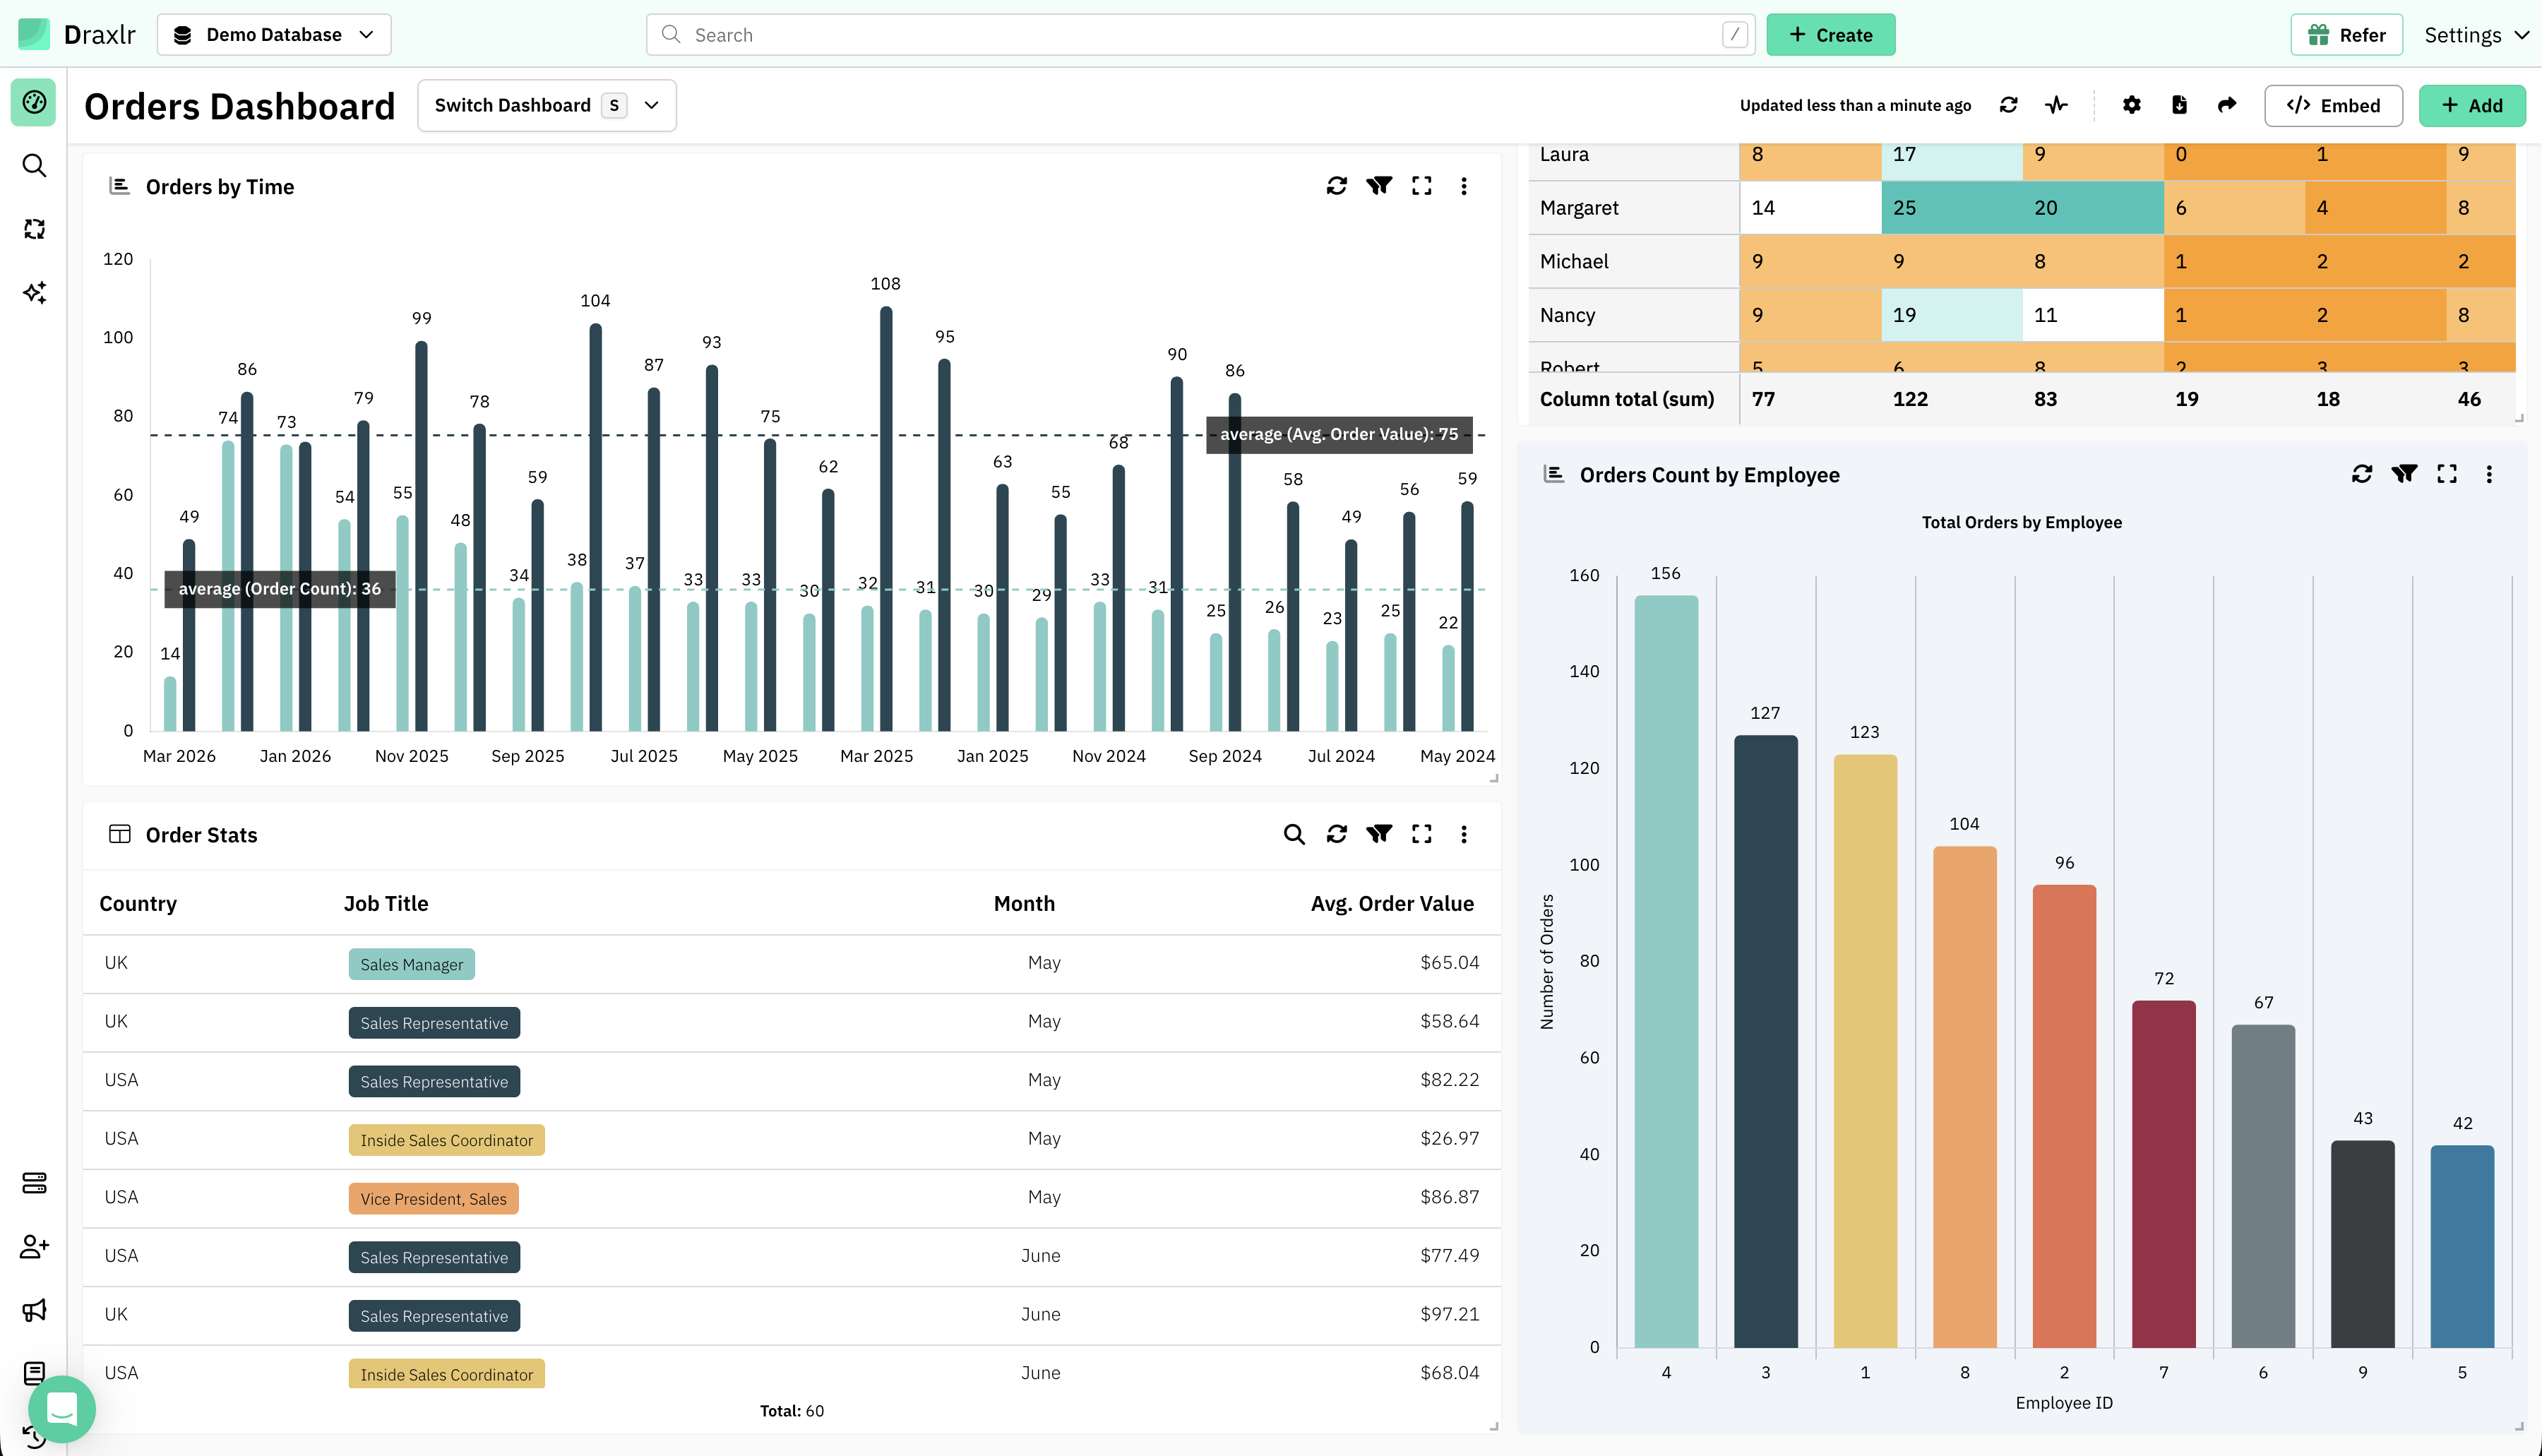
4. Build and Organize Dashboards
After a visualization is generated, users will primarily see two buttons below the result.
The first is Add to Dashboard, which adds the current visualization to a selected dashboard. Users can choose from existing dashboards, making it easy to organize and build views over time.
The second is Customize, which takes users to Draxlr’s raw query builder. This is where deeper changes can be made to the visualization, such as enabling or disabling grid lines, formatting number values, adding a trend line, and adjusting other more visual settings.
5. Share, Automate, and Embed
Once your dashboard is ready, Draxlr offers several ways to bring it into your team’s workflow:
- Slack and email digests. Schedule updates to be delivered via Slack or email at regular intervals or specific times, so your team stays informed without checking manually.
- Threshold-based alerts. Trigger a notification when a KPI crosses a limit — for example, when daily signups drop below 50 or refunds spike above a set percentage.
- Secure dashboard sharing. Share a live dashboard link with anyone by setting a PIN, giving external stakeholders access without requiring login.
- Embeddable dashboards. Embed dashboards into your internal tools, customer portals, or web apps so insights appear where your team and customers already work.
- CSV and Excel exports. Any chart or table can be exported for finance reviews, board packs, or further analysis in spreadsheets.
- Webhooks for custom workflows. Push query results or alerts to any endpoint, so you can wire Draxlr into internal tools, incident channels, or automation platforms like Zapier and n8n.
Security and privacy: what happens to your data?
Connecting a database to an AI tool raises valid concerns. Here is how Draxlr handles it:
- Schema only, no data sync: Draxlr reads only the structure of your database (table names, column names, and relationships). Your actual rows are never copied, stored, or used to train any model.
- Queries run on your database: When a query is generated, it executes directly against your database. Results are returned to your browser session and are not retained beyond what is needed to render the dashboard.
- Read-only connections supported: You can connect Draxlr using a read-only database user, so the tool cannot modify, delete, or insert data under any circumstances.
- Encrypted credentials: Database credentials are encrypted at rest, and all connections use SSL where supported by your database.
If you work with sensitive data, we recommend connecting through a read replica with a read-only user and restricting access to the specific schemas you want the AI to see.
Limitations: where AI SQL tools still struggle
AI SQL tools have come a long way, but they are not a full replacement for a human analyst in every situation. It helps to know where they fall short so you can use them effectively.
- Read-only by design. Draxlr is built for querying and analysis, not data entry or updates. If you need to insert or modify records, you will need a separate database client.
- Ambiguous questions: If your question can be interpreted in multiple ways ("top customers" by revenue? by order count? by recency?), the AI has to guess. The more specific your question, the more accurate the result.
- Complex multi-step analysis: Questions that require several chained calculations, window functions, or subtle business logic (like cohort retention or attribution) may need manual refinement in the query builder.
- Non-standard schema naming: If your tables and columns use cryptic names or abbreviations with no documentation, the AI has less context to work with. Adding table and column descriptions improves accuracy significantly.
- Business logic that lives outside the database: If "active user" is defined by a rule your team keeps in a Notion doc rather than in the data, the AI cannot know about it unless you spell it out in the question.
How Draxlr addresses these limitations
Draxlr is built with these real-world challenges in mind, and gives you two powerful ways to close the gap:
- App-wide and table-level context: You can provide Draxlr with custom context for your entire application, including business logic, domain definitions, and descriptions at both the table and field level. For example, you can tell Draxlr that "active user" means anyone who logged in within the last 30 days, or that the
orders.statuscolumn uses specific codes likePfor pending andFfor fulfilled. This context is passed to the AI along with your schema, so queries reflect how your business actually works, not just what the raw column names suggest. - Full control over SQL and visualizations: Every query Draxlr generates is fully editable. You can view the SQL, tweak joins or filters, and rerun it instantly. On the visualization side, the raw query builder lets you change chart types, adjust axes, format numbers, toggle grid lines, add trend lines, and fine-tune the look of every dashboard tile. The AI gives you a strong starting point, and you stay in control of the final result.
Together, these two features mean you are never stuck with an AI guess. You can teach Draxlr about your business once, and refine any individual query or chart whenever you need to.
Final Thoughts
Most teams don’t lack data, they lack a fast, reliable way to use it. Draxlr’s AI SQL tool removes the need to write queries, build charts manually, or depend on analysts for answers.
It’s not just a shortcut. It’s a shift in how teams interact with their databases, turning plain-English questions into live dashboards, instantly and accurately.
If your team is spending more time asking for data than acting on it, it’s time to try a better way.
Try Draxlr today
Connect a database or use our demo data — no credit card required. Build your first AI-generated dashboard in under 5 minutes. Flat $25/month when you’re ready to upgrade.
Connect your DatabaseFAQs
1. Is there an AI for SQL?
Yes. AI SQL tools let you ask questions in plain English and get valid SQL queries in return. Tools like Draxlr generate queries based on your database schema, so you don’t need to write SQL manually.
2. Can AI create dashboards?
Yes. AI tools like Draxlr can create dashboards by generating queries from plain English and organizing the results into charts. You can save these charts, arrange them into dashboards, and schedule reports—without writing SQL or configuring visuals manually.
3. What is the best AI SQL tool?
The best AI SQL tool depends on your team’s needs, but top tools help you write queries in plain English, understand your database schema, and generate visual dashboards instantly. Draxlr stands out by combining accurate SQL generation with schema awareness, chart suggestions, and live database connectivity—making it a strong choice for teams that want speed without sacrificing control.
4. Is it safe to connect my database to an AI SQL tool?
Yes, when the tool is built with the right safeguards. Draxlr only reads your schema (not your data), supports read-only database users, and encrypts credentials at rest. Your row-level data is never used to train any AI model. For sensitive workloads, connect through a read replica with a restricted user.
5. Which databases does Draxlr’s AI SQL tool work with?
Draxlr supports most popular SQL databases, including PostgreSQL, MySQL, MSSQL, MariaDB, Databricks, Amazon Redshift, and more. As long as your database speaks SQL and is reachable over a secure connection, Draxlr can connect to it and generate queries against its schema.
6. How accurate are AI-generated SQL queries?
Accuracy depends on two things: how specific your question is and how well the tool grounds the AI in your actual schema. Draxlr reads your real table and column names before generating a query, which significantly reduces hallucinations compared to generic LLM-based tools. For ambiguous or highly complex questions, you can always view the generated SQL and refine it in the query builder before saving it to a dashboard.
7. Do I need to know SQL to use an AI SQL tool?
No. The entire point of an AI SQL tool is to remove that requirement. You ask questions in plain English and get back charts and dashboards. That said, if you do know SQL, you can inspect and edit the generated queries for full control—making it useful for both non-technical users and analysts.
8. How is this different from just using ChatGPT with my database schema?
ChatGPT can write SQL if you paste in your schema, but it has three practical limits. First, it has no live connection to your database, so you have to copy queries out, run them elsewhere, and copy results back — every single time. Second, it does not produce dashboards, charts, scheduled alerts, or shareable links. Third, pasting schema into a general-purpose chatbot raises data-governance questions that a purpose-built tool handles with read-only connections, encrypted credentials, and schema-only access. Draxlr is built end-to-end for the query-to-dashboard loop, so the AI, the database, and the visualization layer all work together in one place.
About the author

Ameena is the founder of Draxlr, a modern business intelligence platform focused on making data analysis simpler and faster. She writes about embedded analytics, databases, SQL, dashboards, and building scalable data products for modern teams.

