Best YugabyteDB Reporting Tools
Looking for YugabyteDB reporting tools? Explore the best options for dashboards, analytics, and internal reporting on your YugabyteDB data.

YugabyteDB gives you the resilience of a distributed SQL database with the full familiarity of PostgreSQL — and that combination has made it a go-to choice for teams building mission-critical applications at scale. But as YugabyteDB clusters grow and power more of your business logic, the absence of a proper reporting layer starts to show. Running ad-hoc queries in a terminal, sharing CSV exports over Slack, or building one-off dashboards in spreadsheets doesn't scale alongside your database.
Engineering teams often underestimate how much work goes into building a proper internal analytics layer. Normalizing queries, managing permissions, creating visualizations, and keeping dashboards accurate as schemas evolve can easily consume sprint after sprint. What begins as a simple dashboard request quickly turns into a maintenance burden.
YugabyteDB reporting tools solve this problem by connecting directly to your cluster and giving your team — technical and nontechnical alike — a clean interface for exploring data, building dashboards, and sharing insights. In this guide, we break down the best options worth considering in 2026.
What are YugabyteDB reporting tools?
YugabyteDB reporting tools are applications that connect directly to your YugabyteDB cluster and allow teams to build dashboards, run queries, and generate visual reports without writing SQL for every question. Because YugabyteDB's YSQL API is fully PostgreSQL-compatible, most modern BI and reporting tools can connect to it using a standard Postgres driver — no custom connectors or ETL pipelines required.
These tools bridge the gap between your distributed SQL database and the people who need to understand what's inside it. Whether the goal is internal team reporting, customer-facing embedded analytics, or operational monitoring, a good YugabyteDB reporting tool eliminates the need to build analytics infrastructure from scratch.
How to choose a YugabyteDB reporting tool
The right YugabyteDB reporting tool depends on your goals, your team's technical capacity, and how you plan to use analytics day to day. A startup that needs internal visibility into key product metrics has very different requirements from a B2B SaaS company that wants to embed analytics directly inside its product.
Start by identifying your primary goal.
1. If your goal is internal reporting for your team
Look for tools with strong SQL support, an intuitive dashboard builder, and simple permission-based sharing. You want visibility into your YugabyteDB data without adding another complex system to maintain or requiring your engineering team to build a custom analytics layer.
2. If your goal is customer-facing analytics
Prioritize tools with secure embedding, white-label controls, and row-level filtering. Your customers should be able to see their own data inside your product — not a third-party dashboard bolted on with visible branding.
3. If your goal is replacing an existing analytics stack
Focus on tools with flexible permissions, reusable query definitions, scheduling, and scalable embedding. These capabilities give you a clean migration path and reduce the surface area of things you need to maintain going forward.
4. If your goal is minimal engineering involvement
Choose a tool that lets product managers, support teams, and operations staff explore YugabyteDB data on their own. Visual query builders and AI-assisted SQL reduce the number of ad-hoc requests that land in your engineering backlog.
Key features to look for in YugabyteDB reporting tools
Not every reporting tool is built the same, and the options that sound comprehensive in a feature list may still fall short in practice. Here are the core capabilities to evaluate when comparing YugabyteDB reporting tools.
1. Native PostgreSQL compatibility
Since YugabyteDB's YSQL API is PostgreSQL-compatible, your reporting tool should connect to it the same way it connects to Postgres — no custom drivers, no schema duplication, no ETL pipelines. Tools that require proprietary connectors or data movement will add unnecessary complexity to an already distributed setup.
2. Ease of dashboard building
Most teams using YugabyteDB don't have a dedicated data team. Reporting needs to be accessible to developers, product managers, and analysts without requiring each of them to write raw SQL. Look for:
- Visual query builders
- AI text-to-SQL
- Reusable chart components
- Dashboard filters and drill-through
- Simple sharing and permissions
3. Embeddability for customer-facing dashboards
If you plan to embed analytics inside your product, make sure the tool offers:
- Secure, stateless embed tokens
- Row-level filtering for multi-tenant applications
- White-label controls so dashboards feel native to your product
4. API access for automation
Teams running YugabyteDB often automate reporting workflows — scheduled exports, Slack alerts, or embedding logic tied to their auth layer. An API-first reporting tool gives you programmatic control and the flexibility to integrate analytics with the rest of your stack.
5. Data security and access control
Your YugabyteDB reporting tool must respect the same security expectations as your application. Look for:
- No data duplication outside your cluster
- User-scoped dashboards and data access
- Secure embedding with token-based authorization
- Role-based permission controls
- Self-hosting options for sensitive environments
6. Documentation, support, and reliability
Reporting is often deployed under pressure — late in a product cycle or when customers start asking for data. Good documentation, active communities, and responsive support teams make all the difference when you're stuck and need answers fast.
The best YugabyteDB reporting tools to consider in 2026
Here is a breakdown of the top YugabyteDB reporting tools worth exploring in 2026 and beyond.
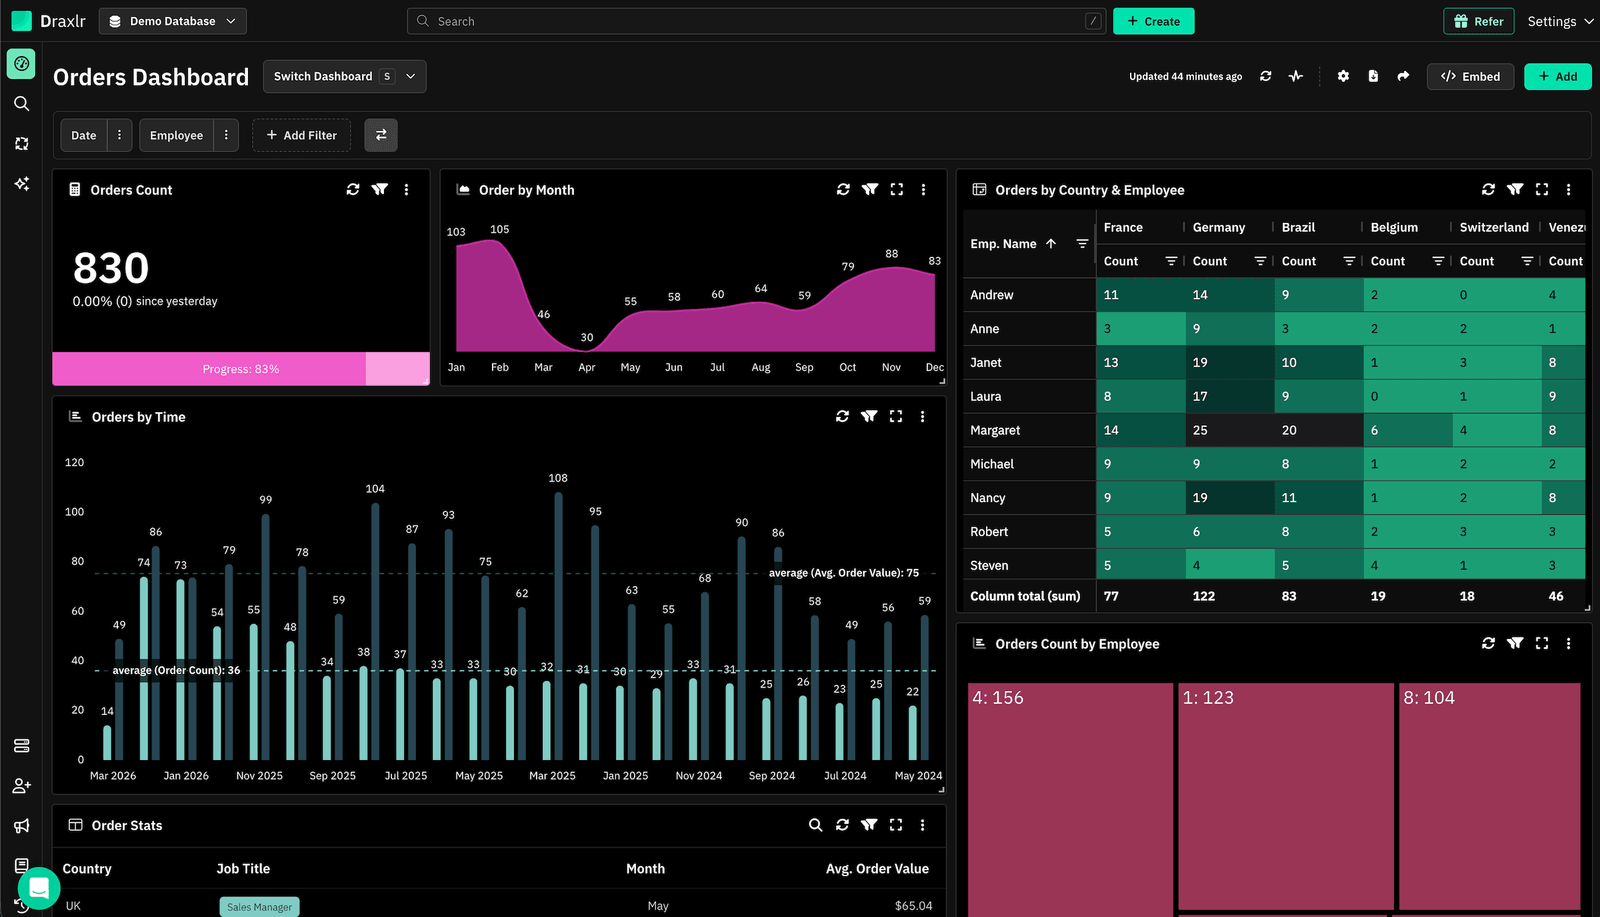
1. Draxlr: Best YugabyteDB reporting tool for dashboards, team insights, and embedded analytics
Best for
SaaS and product teams running YugabyteDB who want a fast, intuitive way to build dashboards, explore data, and deliver embedded analytics without introducing a heavyweight BI stack.
Connect your DatabaseDraxlr connects to YugabyteDB using its native PostgreSQL-compatible YSQL interface, giving teams a clean interface for creating reports, running SQL, and building dashboards without any setup overhead. It's designed for modern SaaS products where engineering resources are limited and the goal is to ship reporting fast — whether for internal visibility or customer-facing analytics.
For technical users, Draxlr offers full SQL control, virtual columns, filters, drill-through functionality, and database-aware autocomplete. For nontechnical teammates, the visual query builder and AI text-to-SQL make data exploration accessible without requiring anyone to touch the SQL editor. Since YugabyteDB is distributed across nodes, Draxlr's direct connection model means queries run against your actual live schema with no data replication or modeling layer required.
If your product includes customer analytics, Draxlr supports secure embedded dashboards with row-level filtering, white-label options, and React/Vue components that integrate naturally into your app. Teams can also automate reporting with scheduled emails, Slack alerts, and CSV/Excel exports.
Key features
- Connects directly to YugabyteDB via the PostgreSQL-compatible YSQL API — no ETL or data movement required
- Visual Query Builder, full SQL editor, and AI Chat for text-to-SQL
- Dashboard builder with filters, drill-through, and virtual columns
- Embedded dashboards with secure tokens, row-level filters, and white-label controls
- React and Vue SDKs for in-product analytics
- Export options (CSV, Excel, PDF) and scheduled reports
- Team-level permissions for safe access to production data
- Supports both internal reporting and customer-facing analytics from the same workspace
What users say about Draxlr
Draxlr offers a clean, modern interface and makes it incredibly easy to build dashboards — even for non-technical users. I especially like the visual quality and flexibility of the available graph types. It's intuitive, fast to set up, and has excellent usability from the start. The ability to securely share dashboards via link is a game-changer for our client reporting. — Review from a SaaS Founder on G2
Pricing
Draxlr offers multiple plans depending on team size, embedding needs, and data volume. Pricing starts at $75/month
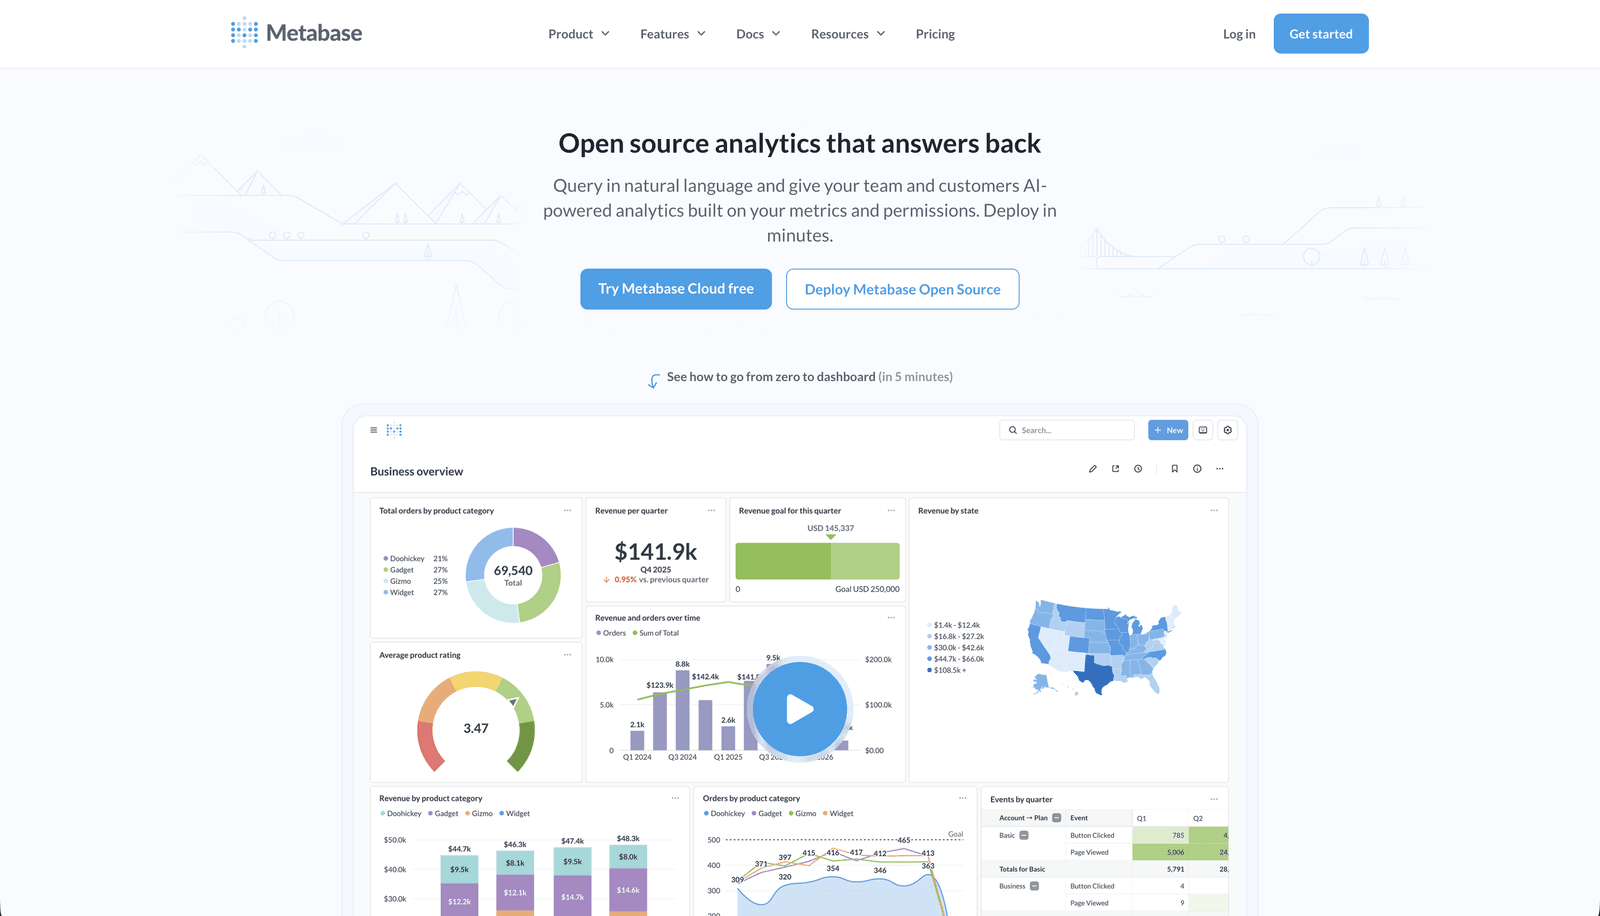
2. Metabase: Best for self-service analytics and non-technical teams
Best for
Teams that want an approachable, self-service analytics layer on top of YugabyteDB, particularly when non-developers need to explore data without writing SQL.
Metabase is one of the most widely adopted open-source BI tools available, and it has official documentation for YugabyteDB integration. Because YugabyteDB is PostgreSQL-compatible, Metabase connects to it using the standard Postgres driver — select PostgreSQL as your database type, enter your YugabyteDB endpoint and credentials, and Metabase treats the distributed cluster just like a standard Postgres instance.
Metabase's visual question builder lets non-technical users create reports by clicking through tables, filters, and aggregations without writing a single line of SQL. For more advanced users, native SQL queries are fully supported. It's a solid option when your primary goal is making YugabyteDB data accessible to the broader organization without a steep learning curve. However, its embedding capabilities are limited to paid tiers, and at scale the per-user billing model can become expensive.
Key features
- Connects to YugabyteDB via the standard PostgreSQL driver — officially documented
- Visual question builder for non-technical users
- Native SQL editor with parameterized queries
What users say about Metabase
Great user experience, great user management, easy to use and everybody learns quickly how to find the information they need.
Pricing
Open source (free to self-host). Cloud Starter plan starts at $100/month for up to 5 users. Pro plan starts at $575/month.
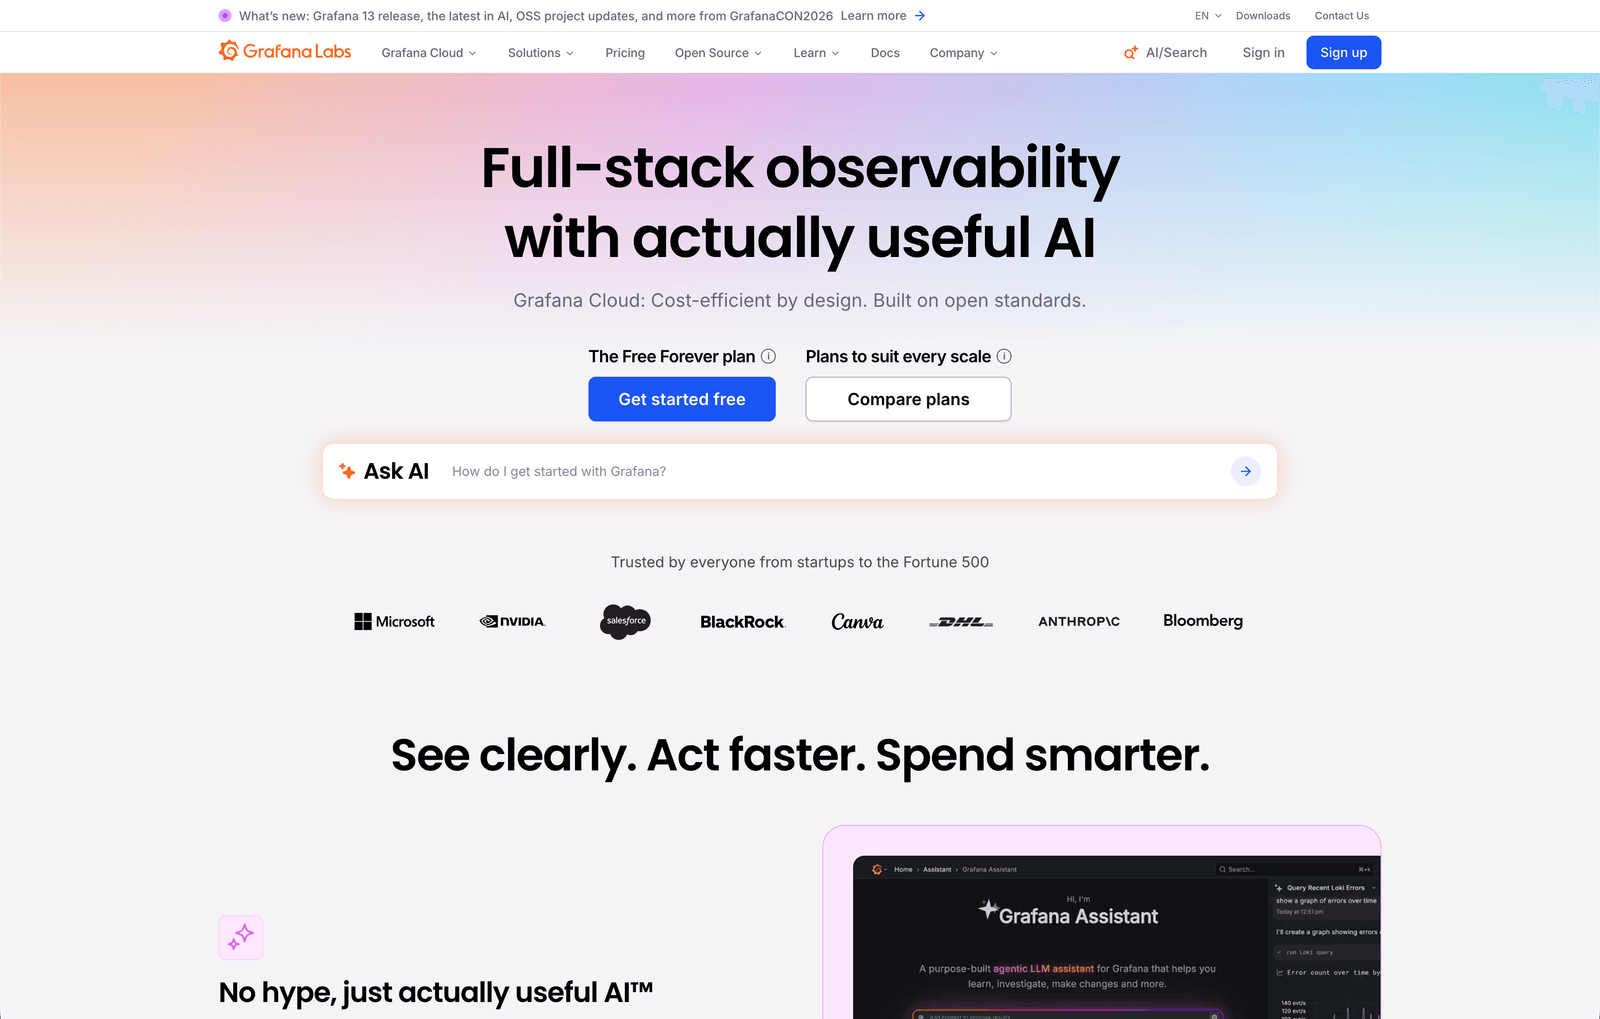
3. Grafana: Best for operational monitoring and time-series dashboards
Best for
Engineering and DevOps teams that need real-time operational dashboards, cluster health monitoring, and time-series visualization on top of YugabyteDB.
Grafana is one of the most popular open-source observability platforms, and it has a dedicated YugabyteDB datasource plugin available through Grafana Labs. This plugin allows teams to connect Grafana directly to YugabyteDB instances, visualize query performance, track cluster health, and build operational dashboards on top of live YSQL data. YugabyteDB also provides pre-built Grafana dashboard templates that break down metrics by API type (YSQL, YCQL) and method (Insert, Select, Update), making it fast to get an observability layer stood up.
Grafana excels at time-series data, infrastructure metrics, and Prometheus-compatible monitoring workflows. For teams running YugabyteDB in Kubernetes, it integrates naturally with the Prometheus Operator and standard Helm-based deployments. That said, Grafana is primarily an operational tool — it's not designed for business dashboards, customer-facing analytics, or self-service data exploration by non-technical users.
Key features
- Dedicated YugabyteDB datasource plugin with official support from Grafana Labs
- Pre-built YugabyteDB dashboard templates for cluster health and query performance
- Prometheus and Kubernetes integration for infrastructure monitoring
What users say about Grafana
Grafana has made it incredibly easy to visualize complex operational data. The plugin ecosystem is excellent and the time-series dashboards are unmatched for infrastructure teams.
Pricing
Free and open-source (self-hosted). Grafana Cloud Free tier available. Cloud Pro starts at $19/month base plus usage-based pricing.
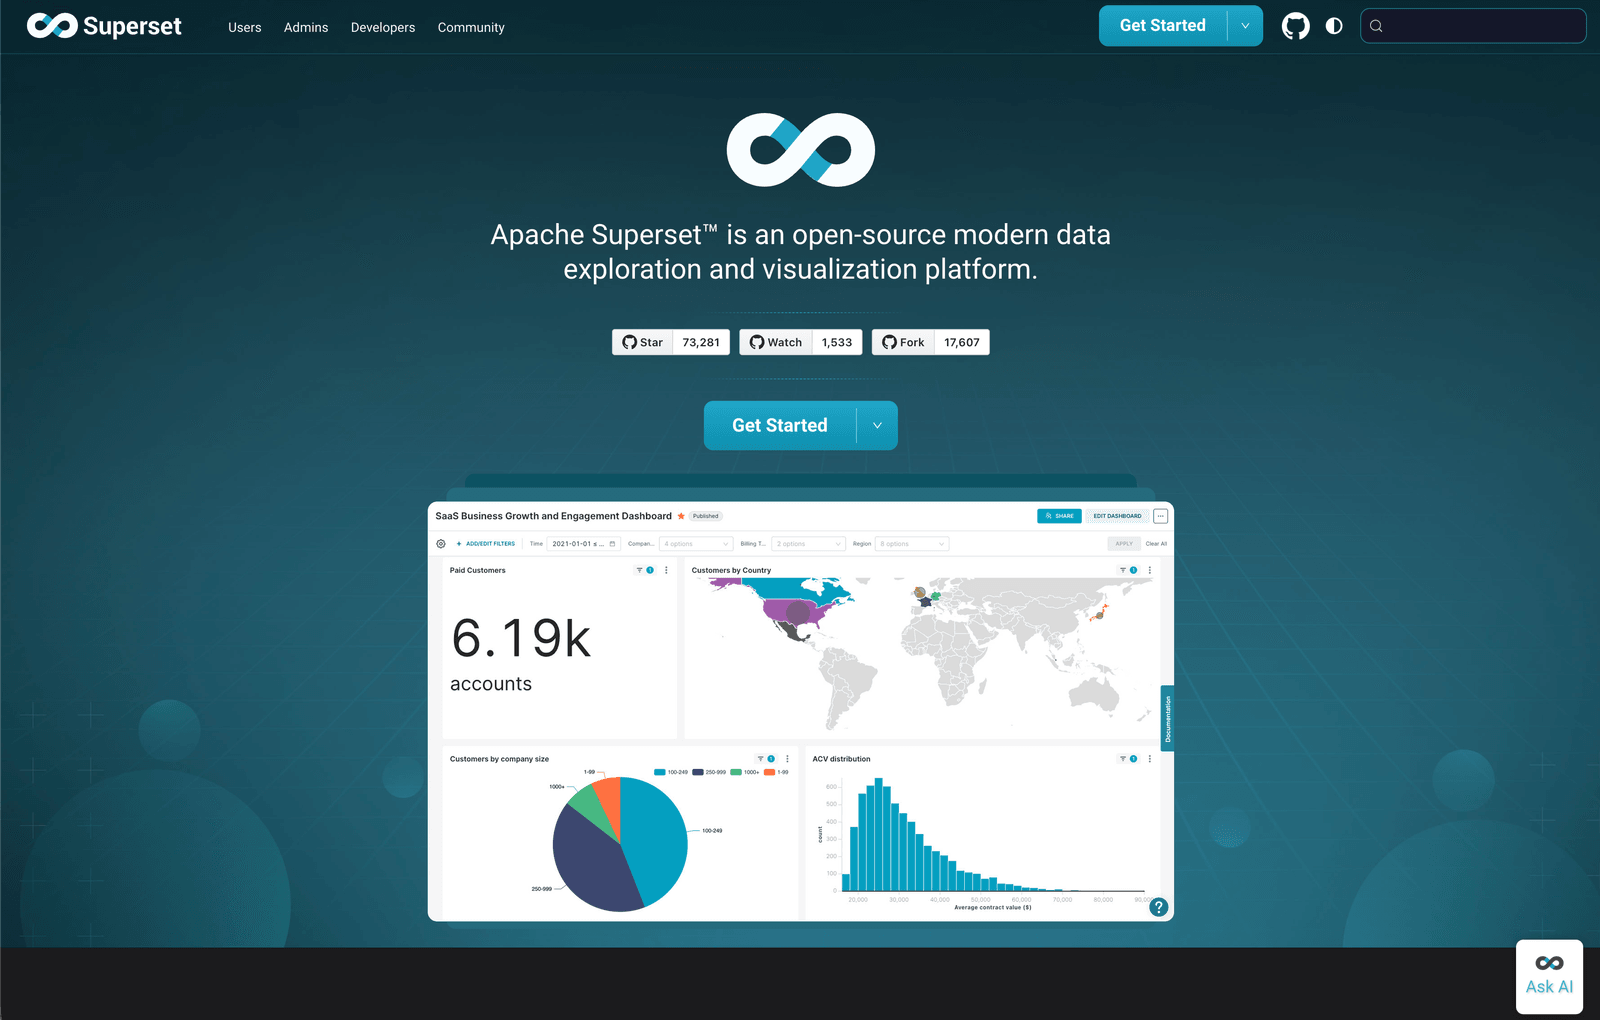
4. Apache Superset: Best open-source BI for teams with engineering capacity
Best for
Organizations that want a powerful open-source BI platform with full control over their analytics infrastructure and have engineering capacity to host and maintain it.
Apache Superset has official YugabyteDB support documented and detailed integration guides in the YugabyteDB documentation. Superset connects to YugabyteDB using the standard PostgreSQL driver (psycopg2, which ships with Superset), making the setup straightforward: select PostgreSQL from the database menu, enter your YugabyteDB endpoint, and the connection is established. YugabyteDB even supports being used as a Superset metadata store from version 2.19 onwards.
Superset offers a full SQL IDE, an interactive dashboard builder, and a broad library of chart types. It's a strong fit for data teams that want open-source flexibility, complete ownership over their analytics infrastructure, and don't mind the operational overhead of self-hosting. For early-stage teams or those without dedicated engineering support for tooling, the maintenance burden can outweigh the benefits.
Key features
- Official YugabyteDB support via PostgreSQL-compatible connection — documented by both projects
- SQL IDE and visual dashboard builder with rich chart library
- Fully open-source with active community and no licensing costs
What users say about Apache Superset
We can combine data from different systems for thorough analysis because the platform supports an extensive amount of data sources, including distributed databases like YugabyteDB via its Postgres-compatible interface.
Pricing
Free and open-source. Operational costs depend on hosting and maintenance.
5. Tableau: Best for advanced visualization in analyst-driven organizations
Best for
Enterprise teams with dedicated BI analysts who need sophisticated, custom visualizations and have existing Tableau infrastructure.
Tableau is one of the industry's most capable visualization platforms, and it connects to YugabyteDB using the standard PostgreSQL JDBC driver. Since YugabyteDB's YSQL API is fully PostgreSQL-compatible, teams can configure Tableau to point at their YugabyteDB endpoint (typically at port 5433) using a standard JDBC connection string and access the full power of Tableau's visualization engine against their distributed SQL cluster.
Tableau excels at complex, multi-layered visualizations, narrative dashboards, and deep analytical exploration. However, it requires meaningful setup, data modeling work via Tableau Prep, and ongoing analyst resources to get value from. For fast-moving product teams or smaller SaaS companies, Tableau's weight and cost often make it a poor fit. It's best suited for organizations that already operate within a BI-analyst workflow and have an existing Tableau deployment.
Key features
- Connects to YugabyteDB via the PostgreSQL JDBC driver — no custom connector required
- Advanced, publication-quality visualizations and chart types
- Tableau Prep for data modeling and preparation
What users say about Tableau
What I like best is Tableau's design philosophy — it emphasizes data exploration and visual storytelling over rigid reporting. For analyst-driven teams it remains one of the best tools available.
Pricing
Premium pricing tailored toward enterprise and team deployments. Contact sales for current pricing.
6. Power BI: Best for teams embedded in the Microsoft ecosystem
Best for
Organizations already using Microsoft tools like Azure, Teams, or Office 365 that want to add BI dashboards connected to YugabyteDB.
Power BI is Microsoft's flagship BI and reporting platform, and it connects to YugabyteDB through the PostgreSQL connector available in Power BI Desktop. Teams configure the connection by selecting the PostgreSQL connector, pointing it at the YugabyteDB endpoint, and using standard Postgres credentials — the distributed nature of the cluster is transparent at the connection layer. Power BI brings advanced data modeling with DAX, a large library of visualizations, and tight integration with Azure services and the broader Microsoft ecosystem.
It's a strong option when your organization is already standardized on Microsoft tools and wants a unified analytics layer. The Power BI Desktop tooling can be complex for smaller teams, and enterprise-grade sharing and governance features require Power BI Premium. For SaaS teams or companies without existing Microsoft infrastructure, the overhead of adopting Power BI alongside YugabyteDB is usually harder to justify than lighter-weight alternatives.
Key features
- Connects to YugabyteDB via the PostgreSQL connector in Power BI Desktop
- Advanced modeling with DAX and a large visualization library
- Tight integration with Azure, Microsoft 365, and Teams
What users say about Power BI
What I like most about Power BI is how it turns complex data into something easy to understand. The ability to create interactive dashboards and dynamic reports is a game changer for our organization.
Pricing
Power BI Desktop is free. Power BI Pro starts at $10/user/month. Power BI Premium Per User at $20/user/month. Premium Per Capacity pricing available for enterprise deployments.
Implementing your YugabyteDB reporting tool effectively
Choosing the right tool is only the first step. Getting real value from a YugabyteDB reporting layer requires a thoughtful implementation approach — one that respects the distributed nature of your database and the different ways your team will interact with data.
1. Onboard your team properly
A reporting tool that only developers know how to use defeats the purpose. Invest time in onboarding product managers, support staff, and analysts alongside your engineering team. A focused two-hour session that covers connecting to YugabyteDB, creating a basic dashboard, and sharing it correctly prevents weeks of misconfigurations and bottlenecks later.
2. Start with a pilot
Rather than rolling out dashboards to the entire organization at once, start with a small internal group. This lets you validate your metric definitions, confirm that queries perform well against your YugabyteDB cluster, and refine the dashboard layout before it becomes the source of truth for a wider audience. Distributed databases like YugabyteDB can surface subtle query performance differences depending on your topology, so piloting before full rollout is especially valuable.
3. Collect feedback continuously
Reporting is not a one-time build. Once dashboards are live, actively gather feedback from the people using them. Which metrics are being ignored? Which charts aren't loading fast enough? As your product evolves and your YugabyteDB schema changes, your reporting layer needs to stay in sync. Treating feedback as a continuous loop — not a one-time configuration — keeps your dashboards accurate and useful.
4. Monitor performance and usage
Track which dashboards are actually being opened, which queries run most frequently, and whether any reports are routinely ignored. On YugabyteDB, queries that run efficiently on a single-node Postgres might behave differently across distributed nodes — understanding which queries are slow helps you optimize both your reporting layer and your database schema over time.
Conclusion
YugabyteDB is built for demanding, distributed workloads — and the reporting layer you choose should be able to keep up. Whether your team needs internal visibility into product metrics, operational monitoring across nodes, or customer-facing embedded analytics, there's a tool in this list that fits your requirements.
If you want a reporting layer that works naturally with YugabyteDB's PostgreSQL-compatible interface without ETL pipelines, infrastructure overhead, or modeling complexity, Draxlr connects directly to your cluster and helps you ship dashboards quickly. Whether you're building internal reports for your team or embedded analytics for your customers, Draxlr is designed to work alongside your YugabyteDB setup without adding unnecessary complexity to your stack.
FAQs
1. What is a YugabyteDB reporting tool?
A YugabyteDB reporting tool connects directly to your YugabyteDB cluster and lets you build dashboards, charts, and reports without writing SQL for every request. Because YugabyteDB is PostgreSQL-compatible, most tools connect using a standard Postgres driver — no custom connectors or data pipelines required.
2. Can I connect standard PostgreSQL BI tools to YugabyteDB?
Yes. YugabyteDB's YSQL API is fully PostgreSQL-compatible, which means any reporting tool that supports a standard Postgres connection — including Metabase, Apache Superset, Grafana, Tableau, and Power BI — can connect to YugabyteDB using the same driver and credentials format.
3. Does YugabyteDB have built-in reporting or dashboards?
YugabyteDB includes a cluster management UI and Prometheus-compatible metrics endpoints, but these are focused on operational monitoring rather than business reporting. For product analytics, internal dashboards, or customer-facing data exploration, you'll need a dedicated reporting tool.
4. Is it safe to connect a reporting tool directly to YugabyteDB?
Yes, as long as the reporting tool respects PostgreSQL permissions, uses encrypted connections, and supports user-level access controls. Avoid tools that require exporting or duplicating your data outside the cluster. YugabyteDB's Postgres-compatible role system gives you precise control over what each reporting tool user can access.
5. Can non-technical team members use YugabyteDB reporting tools?
Yes. Tools like Draxlr and Metabase include visual query builders, saved reports, dashboard filters, and easy sharing so non-technical users can explore YugabyteDB data without writing SQL. The key is choosing a tool that balances power for technical users with accessibility for the rest of your team.
6. Do I need a data warehouse for reporting on YugabyteDB?
Not typically. YugabyteDB is a distributed SQL database capable of handling analytical queries directly. Most reporting tools connect to it without requiring a separate warehouse layer. Unless you're running extremely complex OLAP queries across massive datasets, a direct connection is faster to set up, easier to maintain, and sufficient for most reporting use cases.
About the author

Vivek is a coder and the founder of Draxlr who cares deeply about building good products. He works at the intersection of AI, SQL, dashboards, and embedded analytics, with a strong focus on making complex data workflows feel simple, useful, and fast for real teams.
If you have questions about anything in this guide, or want to compare options for your specific stack, you can email Vivek at vivek@draxlr.com, try Draxlr free, or reach out directly through the Draxlr team.

