Best Amazon Redshift Reporting Tools
Looking for Amazon Redshift reporting tools? Explore the best options for dashboards, analytics, and internal reporting on your Redshift data warehouse.

Amazon Redshift is one of the most widely adopted cloud data warehouses in use today, and for good reason. It handles petabyte-scale analytical workloads, integrates seamlessly with the AWS ecosystem, and gives data teams a powerful SQL interface for complex queries. But raw warehouse access is not the same as actionable reporting.
As Redshift deployments mature, the SQL console starts showing its limits. Analysts spend time answering repetitive questions, product teams want to see live data without learning SQL, and executives need dashboards that update without manual exports. What starts as a powerful data asset quickly becomes a bottleneck if teams don't have the right reporting layer on top of it.
Redshift reporting tools bridge the gap between your warehouse and the people who need to understand what's inside it. They give teams a clean, governed layer for building dashboards, running saved queries, sharing reports, and — when needed — embedding analytics directly into products. In this article, we break down the best Redshift reporting tools worth evaluating in 2026.
What are Amazon Redshift reporting tools?
Amazon Redshift reporting tools are analytics and dashboard platforms that connect directly to your Redshift cluster or serverless endpoint and let you build reports, charts, and dashboards without writing raw SQL for every question. They sit between your data warehouse and your users, giving teams structured access to Redshift data through visual interfaces, saved queries, and governed dashboards.
Unlike general BI tools that require you to first move data into a proprietary store, the best Redshift reporting tools query your warehouse directly. Metrics stay fresh, your existing column-level and row-level permissions apply, and there's no secondary sync to manage. Whether your goal is internal team reporting, executive visibility, or customer-facing embedded analytics, these tools let you put Redshift data to work without writing a new application from scratch.
How to choose an Amazon Redshift reporting tool
Choosing the right Redshift reporting tool depends on how your team is structured, what kind of reporting you need, and how much technical overhead you're willing to manage. The options range from lightweight tools that non-technical users can operate independently to deeply configurable platforms designed for analyst-heavy workflows.
Start by identifying your primary goal.
1. If your goal is internal reporting for your team
Pick a tool with strong SQL support, an intuitive dashboard builder, and simple sharing controls. You want analysts and product managers to be able to answer questions without involving engineering every time.
2. If your goal is customer-facing analytics
Look for embedding, white-label controls, and row-level filtering. Your customers should see analytics that feel like a natural part of your product, not an embedded third-party tool.
3. If your goal is replacing an existing analytics stack
Prioritize tools with flexible permissions, reusable query definitions, scheduling, and scalable embedding. These features ensure your reporting layer grows with your Redshift investment rather than becoming another silo.
4. If your goal is minimal engineering involvement
Choose a tool that empowers product, operations, and support teams to explore Redshift data on their own. Visual query builders, natural language interfaces, and AI-assisted SQL reduce the number of ad-hoc data requests landing on your engineering team.
Key features to look for in Redshift reporting tools
Not all reporting tools handle a data warehouse like Redshift equally. Some are optimized for transactional databases, others for smaller datasets. Choosing a tool built for warehouse-scale workloads makes a meaningful difference in both performance and developer experience.
Here are the core features to evaluate when comparing Redshift reporting tools.
1. Native Redshift compatibility
Your reporting tool should connect to Redshift directly — via JDBC or ODBC, using your cluster credentials or IAM role — without requiring a middleware sync or proprietary connector. Native support means:
- Queries execute against your live warehouse
- No secondary data store to maintain
- Column-level and row-level permissions are honored
- Redshift-specific SQL extensions work as expected
Tools that require you to replicate or reshape data before building reports will slow you down and introduce data freshness problems.
2. Ease of dashboard building
Redshift sits at the center of many organizations' data infrastructure, but most of the people who need access to that data aren't comfortable writing SQL. Look for features like:
- Visual query building without SQL
- AI-assisted text-to-SQL
- Reusable chart templates
- Filters and drilldown controls
- Shareable dashboard links
- Scheduled reports and alerts
The right tool should reduce the analytics bottleneck on your engineering team, not create a new one.
3. Embeddability
If your product includes analytics for end users, your Redshift reporting tool needs to support secure embedding. Key capabilities include:
- Token-based embed authentication
- Row-level filtering per customer or tenant
- White-label styling to match your product's look
- React or Vue SDKs for clean in-product integration
Dashboards embedded from a Redshift-backed reporting tool should feel native inside your application, not bolted on.
4. API access for automation
Redshift-backed reporting should integrate with the rest of your stack. An API-first tool lets you:
- Trigger report generation programmatically
- Automate scheduled exports
- Build custom alerting pipelines
- Embed authentication flows into your app's auth layer
This is especially important for SaaS teams who want to automate reporting as part of their broader product.
5. Data security and access control
Redshift typically stores your most sensitive business data — revenue, customer activity, operational metrics. Your reporting layer needs to match those expectations:
- No copying or caching data outside your Redshift cluster (where avoidable)
- User-scoped and role-scoped dashboard access
- Row-level security for multi-tenant reporting
- Secure embed tokens that expire appropriately
6. Documentation, support, and performance
A warehouse query tool needs to handle complex joins, wide result sets, and high-concurrency access. Before choosing, evaluate whether the tool can handle your query volume and what happens when something breaks. Good documentation, active support channels, and proven reliability under load matter as much as the feature list.
The best Amazon Redshift reporting tools to consider in 2026
Here's a breakdown of the top Redshift reporting tools worth evaluating in 2026.
1. Draxlr: Best Redshift reporting tool for dashboards, team insights, and embedded analytics
Best for
SaaS teams and data-forward companies using Amazon Redshift who want a fast, practical way to build dashboards, explore warehouse data, and offer embedded analytics without managing a heavy BI stack.
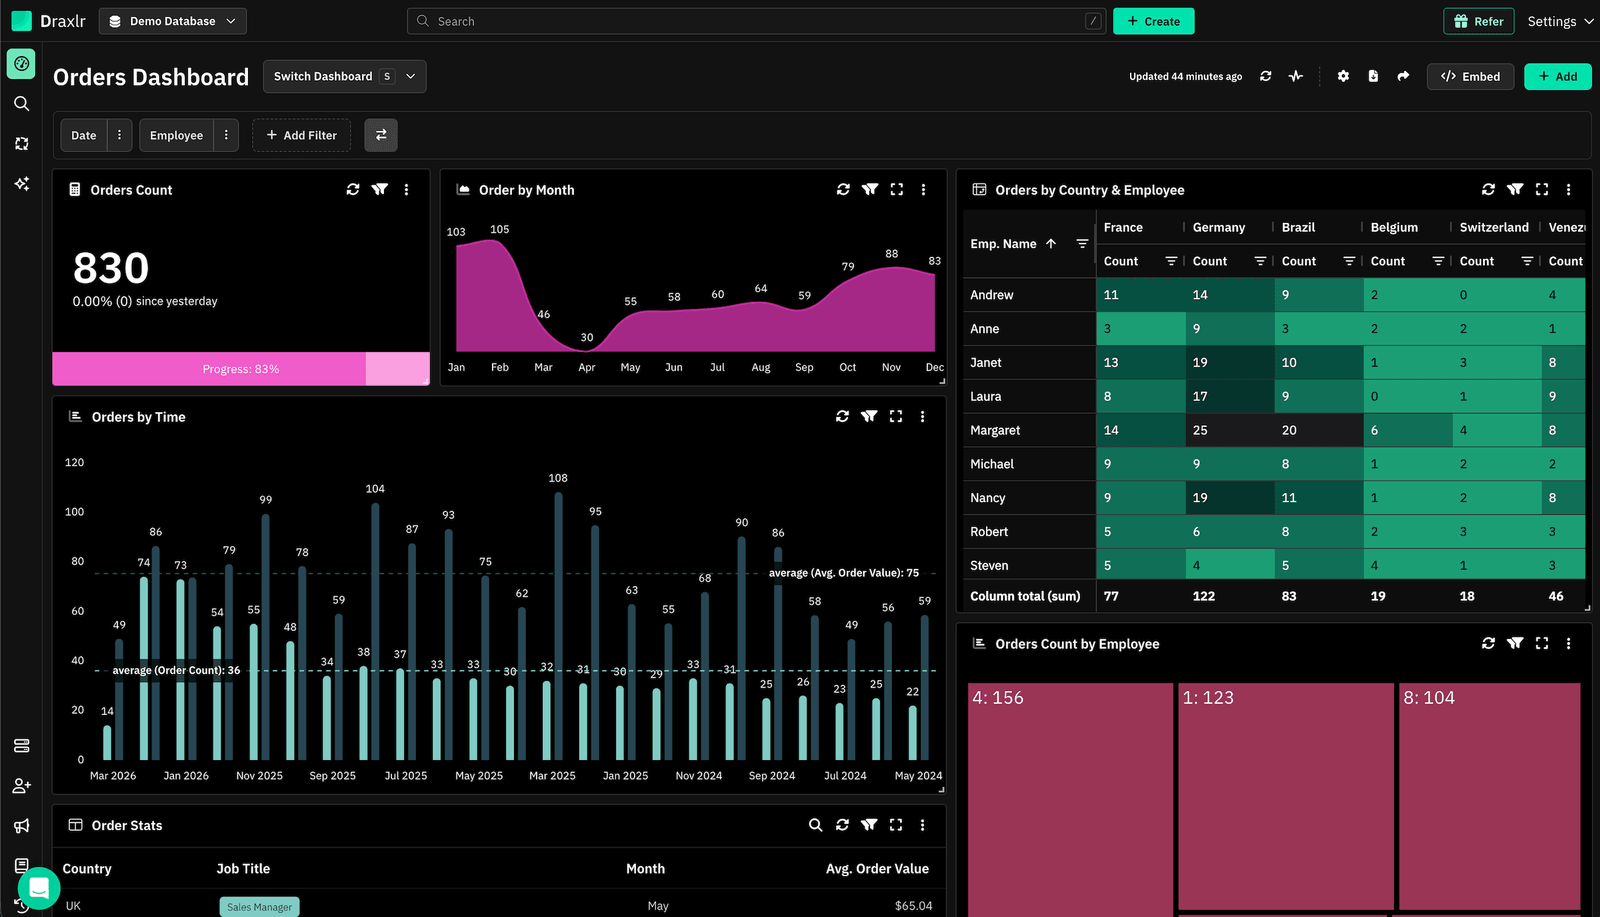
Connect your DatabaseDraxlr connects directly to your Amazon Redshift cluster and gives your team a clean interface for creating reports, running SQL, and building dashboards without setup overhead. It's designed for modern SaaS and data teams that want to ship reporting fast — whether the goal is internal visibility into warehouse data or customer-facing analytics embedded inside their product.
For technical users, Draxlr offers full SQL control, virtual columns, filters, drill-through features, and warehouse-aware autocomplete. For nontechnical teammates, the visual query builder and AI text-to-SQL make Redshift data exploration accessible without needing to write a single query.
If your product includes customer analytics, Draxlr supports secure embedded dashboards with row-level filtering, white-label options, and React/Vue components that integrate naturally into your application. Teams can also automate reporting with scheduled emails, Slack alerts, and CSV/Excel exports — without building a custom pipeline.
Draxlr runs directly on your existing Redshift infrastructure. No ETL pipelines, no modeling layers, and no extra warehouses to manage.
Key features
- Connects directly to Amazon Redshift with no ETL or data prep required
- Visual Query Builder, full SQL editor, and AI Chat for text-to-SQL
- Dashboard builder with filters, drill-through, and virtual columns
- Embedded dashboards with secure tokens, row-level filters, and white-label controls
- React and Vue SDKs for easy in-product analytics
- Export options (CSV, Excel, PDF) and scheduled reports
- Team-level permissions for safe, governed access to warehouse data
- Supports both internal reporting and customer-facing analytics from the same workspace
What users say about Draxlr
Draxlr offers a clean, modern interface and makes it incredibly easy to build dashboards — even for non-technical users. I especially like the visual quality and flexibility of the available graph types. It's intuitive, fast to set up, and has excellent usability from the start. The ability to securely share dashboards via link is a game-changer for our client reporting. — Review from a SaaS Founder on G2
Pricing
Draxlr offers multiple plans depending on team size, embedding needs, and data volume. Pricing starts at $75/month
2. Amazon QuickSight: Best for teams already inside the AWS ecosystem
Best for
Organizations that want AWS-native reporting directly on top of Redshift with minimal configuration and native IAM integration.
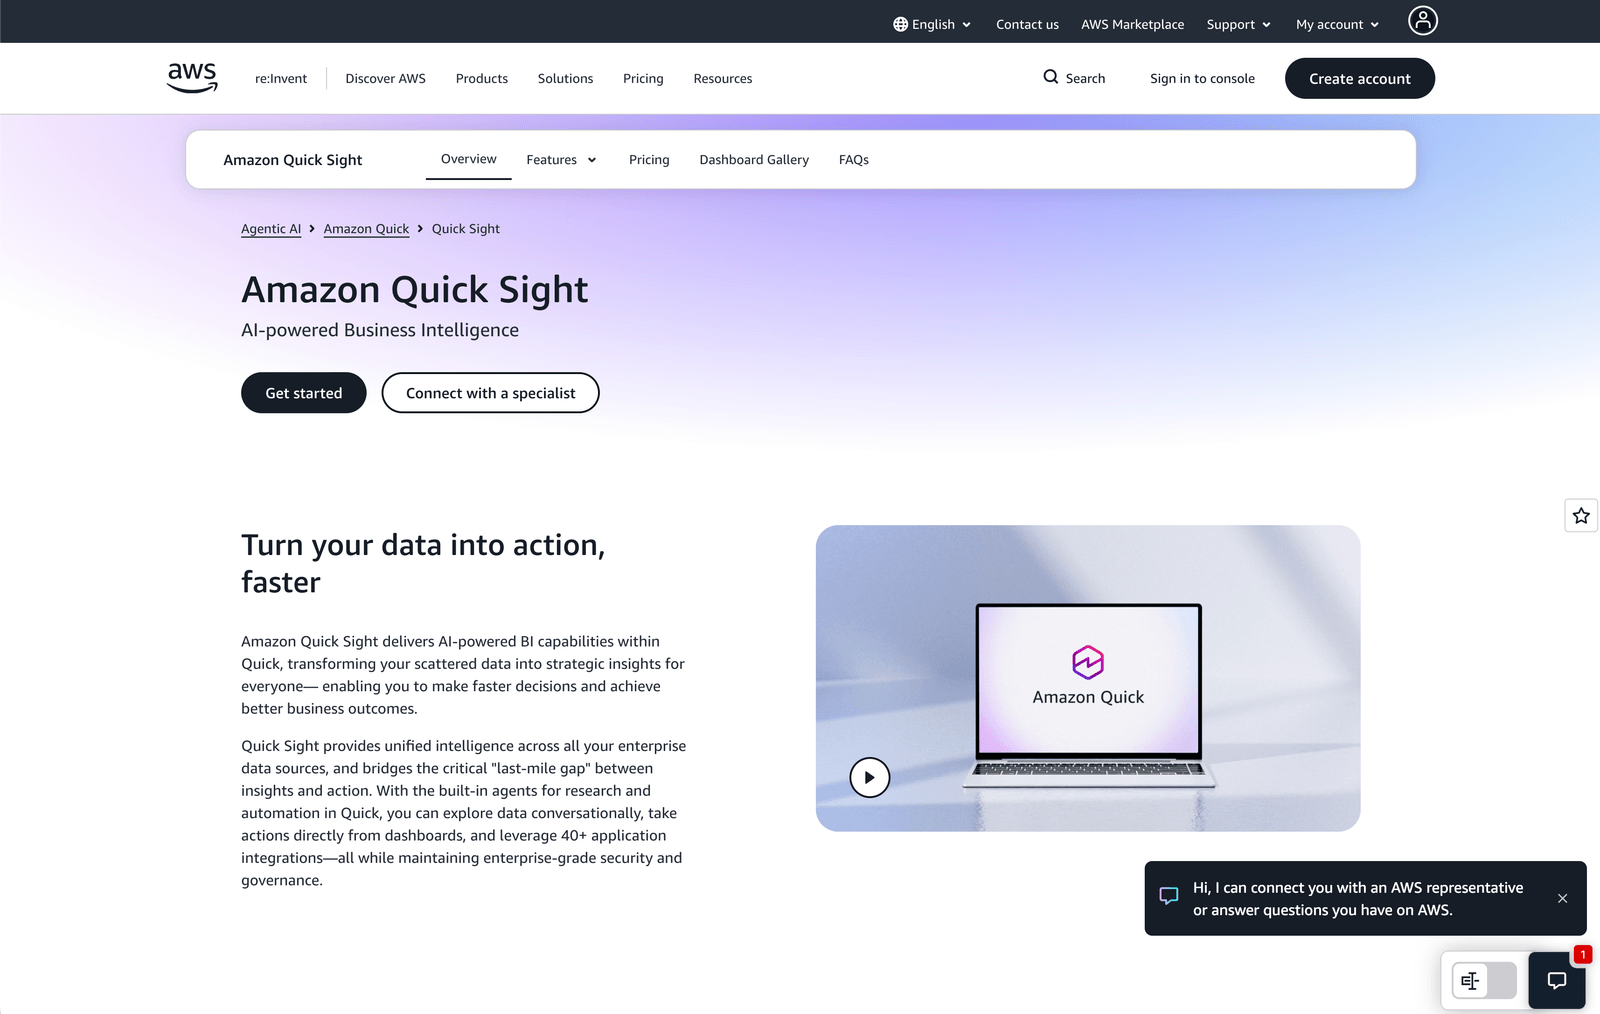
Amazon QuickSight is AWS's built-in business intelligence service and the most natural pairing with Amazon Redshift. Because both live inside your AWS account, connecting QuickSight to your Redshift cluster takes minutes, and permissions can be managed through IAM roles rather than separate credential management.
QuickSight includes SPICE — an in-memory computation engine — for fast dashboard loading, as well as QuickSight Q for natural language queries. It scales automatically to thousands of readers and supports row-level security for multi-tenant scenarios. For teams who are already managing infrastructure in AWS and don't want to introduce an external BI vendor, QuickSight keeps everything consolidated inside a single cloud account.
That said, QuickSight's visualization library is more limited than Tableau or Power BI, and its embedding model requires more setup work than purpose-built embedded analytics tools.
Key features
- Native AWS integration — connects to Redshift via IAM in minutes
- SPICE in-memory engine for fast, cached queries at scale
- QuickSight Q for natural language data exploration
- Row-level security for multi-tenant or role-based access
- Automatic scaling for thousands of readers without infrastructure management
What users say about Amazon QuickSight
QuickSight's integration with the AWS ecosystem is seamless. Connecting to S3, Redshift, or Athena happens in minutes without complex configuration or workarounds. — G2 reviewer
Pricing
QuickSight uses per-session pricing starting at approximately $0.30 per session for the Standard edition and $0.50 per session for Enterprise. Author seats run around $18/month. Pricing scales with usage and is generally lower for high-reader, low-author deployments.
3. Metabase: Best open-source Redshift reporting tool for teams that want flexibility
Best for
Engineering-forward teams and startups that want a capable, self-hostable reporting tool with a low barrier to entry for business users.
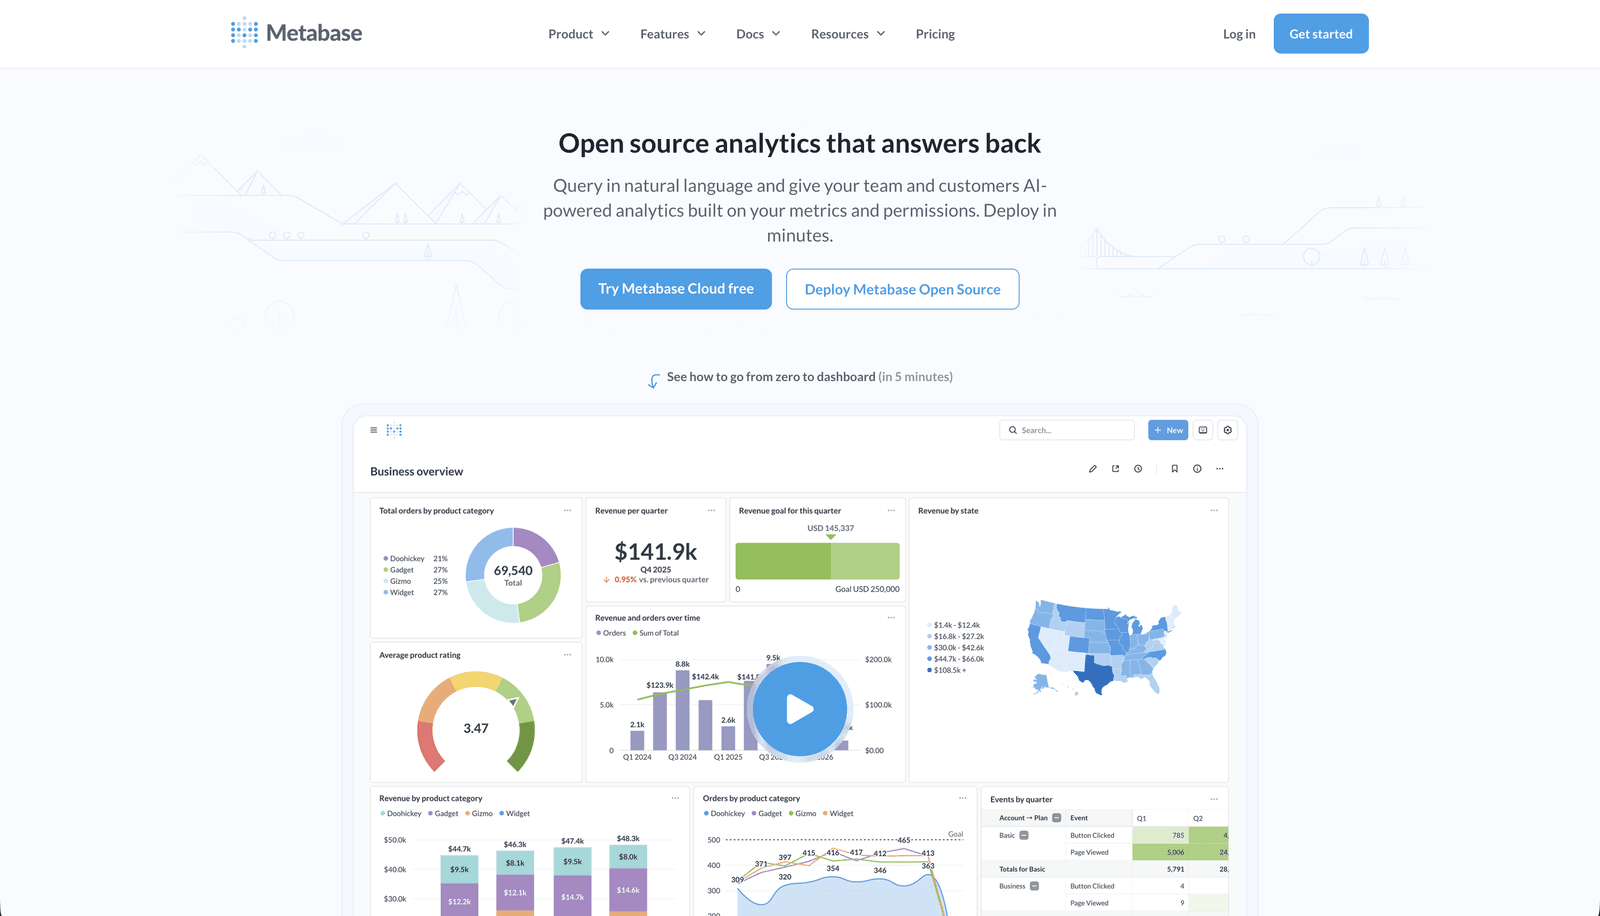
Metabase connects directly to Amazon Redshift and lets both technical and non-technical users explore warehouse data through a visual query interface or a full SQL editor. Setup is fast — you can have Redshift connected and your first dashboard built in under 15 minutes. Metabase's question builder is one of the best-designed visual interfaces for ad-hoc exploration without SQL.
Metabase also supports database permissions impersonation specifically for Redshift, meaning it can honor the access controls already defined in your Redshift instance rather than layering a separate permissions model on top. Teams that want an open-source BI foundation with solid Redshift support tend to start here before deciding whether to upgrade to paid plans or self-host indefinitely.
Embedding is supported on paid plans. The open-source edition is fully functional for internal dashboards and exploratory analytics.
Key features
- Direct Redshift connection via JDBC with 5-minute setup
- Visual question builder for no-code Redshift querying
- Database permission impersonation for Redshift-native access control
- Drill-through, filters, and breakout functionality out of the box
- Open-source edition free to self-host; paid plans add SSO and advanced embedding
What users say about Metabase
I love the Question feature of Metabase, which allows for the creation of no-code SQL queries that can be easily and intuitively answered even by non-technical users. It makes it a breeze to create entire dashboards in a short amount of time. — G2 reviewer
Pricing
Metabase's open-source edition is free. Starter plans begin at approximately $1,080/year plus $65/year per user. Pro plans start around $6,210/year plus $130/year per user. Enterprise pricing is custom.
4. Tableau: Best for analyst teams that need deep visualization on Redshift
Best for
Organizations with dedicated BI analysts who need sophisticated, custom visualizations and are willing to invest in a full-featured enterprise platform.
Tableau has a long-standing native connector for Amazon Redshift and is one of the most established tools in the enterprise BI landscape. It supports live queries directly against your Redshift cluster or extract-based workflows where data is cached for performance. Tableau's drag-and-drop interface makes it accessible for analysts, while its underlying VizQL engine handles highly complex visualization logic that simpler tools can't match.
Tableau works well for organizations that have existing Tableau Server or Tableau Cloud deployments and want to add Redshift as a data source. For greenfield implementations without dedicated BI resources, the learning curve and licensing cost can be significant. But for analyst-heavy teams with complex visualization needs, Tableau remains one of the most capable Redshift reporting tools available.
Key features
- Native Redshift connector with live query and extract modes
- Sophisticated drag-and-drop visualization builder with hundreds of chart types
- Tableau Prep for data shaping before it reaches dashboards
- Enterprise governance, version control, and workspace-level sharing
- Tableau AI for automated analytics and natural language exploration
What users say about Tableau
Its native connector for databases like AWS Redshift is being used for data visualization and streamline data analysis. Tableau really brings multiple data sources together and makes it easy to share real-time dashboards across teams. — G2 reviewer
Pricing
Tableau pricing varies by deployment. Tableau Cloud plans start at approximately $70/user/month for Viewer and $115/user/month for Creator. Enterprise and site-wide licensing is available through custom quotes.
5. Holistics: Best for data teams that want governed, model-driven Redshift reporting
Best for
Data engineering teams and analytics teams that want a SQL-first, semantic-layer approach to reporting on Redshift with self-service access for business users.
Holistics connects to Amazon Redshift and offers a structured, model-driven approach to reporting that sits well above raw SQL. Rather than building charts directly on tables, Holistics lets data teams define metrics and dimensions in code using AQL (Analytics Query Language), version-control those definitions in Git, and expose them through a drag-and-drop interface for business users. The result is a governed analytics layer where metric definitions are centralized and consistent across every dashboard.
For teams that are already using Redshift alongside dbt, Holistics integrates naturally on top of your dbt models. It also supports dashboard-as-code workflows, automated scheduling, and email delivery — without requiring analysts to rebuild reports manually each time someone asks a question.
Holistics does not store or copy your Redshift data, keeping your security posture intact. Support is consistently highlighted as one of the platform's standout qualities.
Key features
- Direct Redshift connection with a SQL-based semantic modeling layer (AQL)
- Git-version-controlled metrics and dimension definitions
- Drag-and-drop dashboard interface for business users built on top of modeled data
- Scheduled report delivery via email with no manual intervention
- Compatible with dbt model workflows and Redshift-specific SQL features
What users say about Holistics
After evaluating over 40 BI tools, we chose Holistics for its robust semantic modeling layer, which enabled us to create a centralized source of truth for our users. The benefits have been transformative. — Capterra reviewer
Pricing
Holistics offers usage-based pricing that scales with your team. Specific tiers are available on their pricing page. A free trial is available.
6. Looker Studio: Best free Redshift reporting tool for lightweight use cases
Best for
Small teams, early-stage companies, or individual analysts who need a free, accessible way to build reports on Redshift data without licensing overhead.
Looker Studio (formerly Google Data Studio) offers a free, browser-based reporting tool that connects to Amazon Redshift through its native connector. For teams that need basic dashboards, shareable reports, and simple chart-building on top of Redshift data without a budget for dedicated BI tools, Looker Studio is often the easiest starting point.
The tool is particularly well-suited for marketing, operations, or product teams that want to slice warehouse data and share reports without involving engineering. Because it's free and browser-based, there's no installation or licensing process to navigate. The trade-offs are real, however: Looker Studio's row limit per query caps at 150,000 rows, queries can time out on complex joins, and the embedding options are limited compared to purpose-built analytics tools. For straightforward reporting needs without budget constraints, it remains a practical starting point.
Key features
- Free native connector to Amazon Redshift
- Browser-based report builder with drag-and-drop chart creation
- Easy report sharing via Google account-based permissions
- Integration with other Google Workspace data sources
- Scheduled email delivery of reports to stakeholders
What users say about Looker Studio
Looker Studio is the easiest way to get started with visual reporting on warehouse data. The free tier is genuinely useful for non-technical teams who just need to share some charts without setting up an entire BI stack. — G2 reviewer
Pricing
Looker Studio is free. Looker Studio Pro, which adds team workspaces and SLA-backed support, is available at $9/user/month.
Implementing your Redshift reporting tool effectively
Choosing the right Redshift reporting tool is only the first step. A tool can give you dashboards and SQL access, but it won't deliver value unless your team knows how to use it and your implementation is set up for long-term success.
Here's how to get the most out of whichever Redshift reporting tool you choose.
1. Onboarding your team
Invest in proper onboarding before rolling dashboards out broadly. Analysts, product managers, and operations teams should understand how to navigate the tool, create saved queries, and share dashboards. A focused onboarding session prevents ad-hoc misconfigurations and reduces the number of duplicate reports that accumulate over time.
2. Start with a pilot
Rather than deploying to your whole organization at once, start with a focused pilot group. A controlled rollout lets you validate metric definitions, confirm that Redshift query performance holds up, and identify which dashboards actually get used versus which ones go stale. It also gives you time to refine permissions and access controls before wider deployment.
3. Collect feedback continuously
Reporting layers need to evolve alongside your product and your data. After launch, actively collect feedback from the people using dashboards daily. Questions they can't answer in the current interface, metrics that are missing, and visualizations that don't tell the right story should all feed back into your reporting roadmap.
4. Monitor performance and usage
Track dashboard load times, query execution patterns, and active report usage. Redshift is a powerful warehouse, but poorly optimized queries — full table scans, missing sort keys, cartesian joins — will create slow dashboards that teams stop trusting. Understanding which reports are used versus ignored helps you focus optimization effort where it matters most.
Conclusion
The Redshift reporting tool you choose becomes the lens through which your team and your customers understand what's happening in your business. It needs to surface the right data at the right time, load reliably, and give users enough control to answer their own questions without routing everything through a data analyst.
If you want a reporting layer that connects to Redshift without extra infrastructure, pipelines, or modeling layers, Draxlr helps you ship dashboards quickly while keeping your stack simple. Whether you need internal visibility for your team, customer-facing embedded analytics, or scheduled reports delivered to stakeholders, Draxlr works directly with your Redshift cluster — no new infrastructure required.
If you'd like to explore a Redshift-native approach to dashboards and reporting, you can try Draxlr and see how it fits your workflow.
FAQs
1. What is an Amazon Redshift reporting tool?
An Amazon Redshift reporting tool connects directly to your Redshift cluster and lets you build dashboards, charts, and reports without writing SQL for every request. These tools help teams explore live warehouse data safely and share insights without requiring everyone to have direct SQL access to production.
2. Can I build customer-facing dashboards on top of Redshift data?
Yes. Several reporting tools support embedding dashboards inside your product using data sourced from Redshift. Look for options like secure embed tokens, row-level filtering for multi-tenant applications, and styling controls so the dashboards match your product's UI. Draxlr, for example, supports all three.
3. Does Amazon Redshift have built-in reporting?
Amazon Redshift includes a query editor and integrates natively with Amazon QuickSight, but it doesn't include a general-purpose reporting or dashboard layer. For teams that need shared dashboards, visual query building, or embedded analytics, a dedicated reporting tool is required.
4. Is it safe to connect a reporting tool directly to Amazon Redshift?
Yes, as long as the tool uses secure connections, respects your Redshift IAM or credential-based access controls, and supports row-level security where needed. Tools that don't copy or cache your data outside the cluster are generally the safest option. Always use read-only credentials for reporting workloads.
5. Can non-technical team members use Redshift reporting tools?
Yes. Tools like Draxlr, Metabase, and Holistics all offer visual query builders, saved dashboards, and sharing features that allow product managers, support teams, and operations staff to work with Redshift data without writing SQL.
6. Do I need to move my Redshift data somewhere else to build dashboards?
No. The best Redshift reporting tools query your cluster directly, so there's no need to export or replicate data into a separate store. Direct connections are faster to set up, keep your data fresher, and avoid the complexity of managing a secondary data pipeline.
About the author

Vivek is a coder and the founder of Draxlr who cares deeply about building good products. He works at the intersection of AI, SQL, dashboards, and embedded analytics, with a strong focus on making complex data workflows feel simple, useful, and fast for real teams.
If you have questions about anything in this guide, or want to compare options for your specific stack, you can email Vivek at vivek@draxlr.com, try Draxlr free, or reach out directly through the Draxlr team.