Best PlanetScale Reporting Tools
Looking for PlanetScale reporting tools? Explore the best options for dashboards, analytics, and internal reporting on your PlanetScale data.
PlanetScale gives you a serverless MySQL-compatible database that scales without limits, but the moment your product starts generating real data, the built-in tooling stops being enough. Teams end up writing one-off queries, copy-pasting results into spreadsheets, or spending engineering time on custom reporting that should be much simpler.
As products grow, the gap between your database and your team's understanding of what's happening inside it widens. Product managers need conversion metrics, support teams need order history, founders need MRR trends — and without dedicated PlanetScale reporting tools, all of those requests end up routed through an engineer with database access.
The right reporting tool connects directly to your PlanetScale database, gives your team safe, controlled access to the data they need, and lets you build dashboards without writing ad-hoc SQL for every question. In this article, we break down the most reliable PlanetScale reporting tools to consider in 2026.
What are PlanetScale reporting tools?
PlanetScale reporting tools connect to your PlanetScale database and provide dashboards, charts, and shared reports without requiring direct database access for every query. Because PlanetScale is built on a MySQL-compatible foundation (powered by Vitess), most tools that support MySQL can connect to PlanetScale using standard credentials and SSL.
These tools sit on top of your existing schema and let teams explore data, track key metrics, and share insights without introducing ETL pipelines or duplicated datasets. For SaaS teams who chose PlanetScale for its speed and scalability, reporting tools extend that investment by making the data inside it visible and actionable across the whole organization.
How to choose a PlanetScale reporting tool
Choosing the right PlanetScale reporting tool depends on what you're trying to accomplish. A startup tracking product KPIs internally has very different needs from a company embedding analytics into a customer-facing product.
Start by identifying your primary goal.
1. If your goal is internal reporting for your team
Pick a tool with solid SQL support, a visual dashboard builder, and easy sharing. Your team should be able to answer common questions — signups, churn, revenue, usage — without filing engineering requests.
2. If your goal is customer-facing analytics
Look for embedding support, row-level data filtering for multi-tenant setups, and white-label options. Dashboards should feel native to your product, not like a third-party iframe dropped on top.
3. If your goal is replacing an existing analytics stack
Prioritize tools with flexible permissions, scheduled reports, reusable query logic, and scalable embedding. These features let you consolidate your analytics layer rather than adding to it.
4. If your goal is minimal engineering involvement
Choose a tool that empowers product, ops, or support teams to explore data independently. Visual query builders, filters, and AI text-to-SQL reduce the number of requests that land in engineering queues.
Key features to look for in PlanetScale reporting tools
A lot of tools claim to support MySQL and therefore PlanetScale, but their actual compatibility and usability varies. Here are the core features to evaluate when comparing PlanetScale reporting tools.
1. Native MySQL and PlanetScale compatibility
PlanetScale is built on Vitess and has some differences from standard MySQL — particularly around foreign key constraints and certain DDL operations. Your reporting tool should connect over a standard MySQL connection with SSL support, and ideally have been tested against a live PlanetScale schema. Tools that connect cleanly without requiring data modeling or schema workarounds are the strongest fit.
2. Ease of dashboard building
Most PlanetScale-backed teams are product-focused and moving fast. Reporting needs to be accessible to the whole team, not just whoever has database credentials. Look for:
- Visual query building
- AI text-to-SQL
- Reusable charts and saved queries
- Filters and drill-through navigation
- Simple dashboard sharing
3. Embeddability (if you need customer-facing dashboards)
If you're building a SaaS product on PlanetScale and want to embed analytics for your customers, you'll need secure embed tokens, row-level filtering per tenant, and white-label styling. Embedded dashboards should look like part of your product, not a separate tool.
4. API access for automation
Teams building on PlanetScale often need to automate workflows: scheduled reports, Slack alerts when a metric crosses a threshold, or programmatic embedding for customer dashboards. An API-first tool gives you:
- Programmatic dashboard and query management
- Scheduled report delivery
- Easier integration with your existing auth and alerting systems
5. Data security and access control
Your PlanetScale database holds production data. Your reporting tool needs to respect that. Look for:
- Read-only connection options
- User-level permission controls
- Secure embed tokens for customer-facing dashboards
- No data copying or sync requirements
- Self-hosted options for teams with strict data residency requirements
6. Documentation, support, and reliability
Reporting is typically built under deadline pressure. Good documentation, active support channels, and a stable UI will save your team hours of frustration when things need to move fast.
The best PlanetScale reporting tools to consider in 2026
Here's a breakdown of the top PlanetScale reporting tools worth exploring in 2026 and beyond.
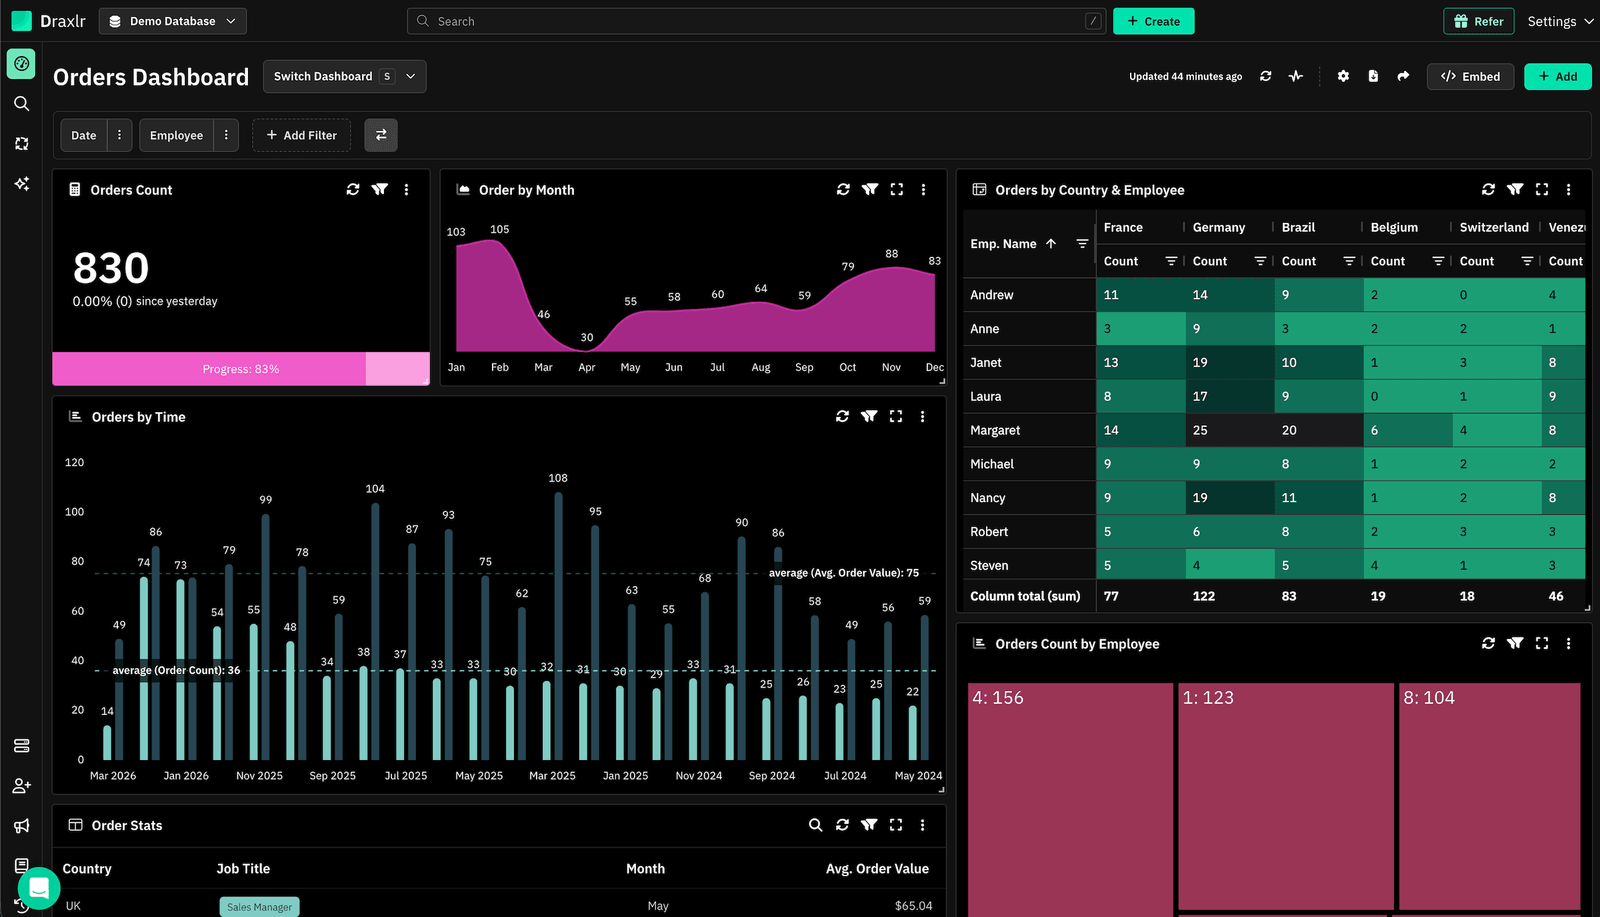
1. Draxlr: Best PlanetScale reporting tool for dashboards, team insights, and embedded analytics
Best for
SaaS teams running on PlanetScale who want a fast, straightforward way to build dashboards, explore data, and deliver embedded analytics without adding a complicated BI layer.
Connect your DatabaseDraxlr connects directly to your PlanetScale database and gives teams a clean interface for creating reports, running SQL, and building dashboards without setup overhead. It was built specifically for modern SaaS products, making it one of the first reporting tools with full support for PlanetScale's serverless MySQL architecture.
For technical users, Draxlr provides full SQL control, virtual columns, filters, drill-through features, and database-aware autocomplete. For nontechnical teammates, the visual query builder and AI text-to-SQL make data exploration accessible without needing to touch the editor. You can build dashboards and set up Slack alerts on your PlanetScale data without writing a single line of code.
If your product includes customer analytics, Draxlr supports secure embedded dashboards with row-level filtering, white-label controls, and React/Vue components that integrate naturally into your app. Teams can also automate reporting with scheduled emails, Slack alerts, and CSV/Excel exports — all without any ETL or pipeline work.
Key features
- Connects directly to PlanetScale with SSL — no ETL or data sync required
- Visual Query Builder, full SQL editor, and AI Chat for text-to-SQL
- Dashboard builder with filters, drill-through, and virtual columns
- Embedded dashboards with secure tokens, row-level filters, and white-label controls
- React and Vue SDKs for in-product analytics
- Scheduled reports, Slack alerts, and CSV/Excel/PDF exports
- Team-level permissions for safe access to production data
- Supports both internal reporting and customer-facing analytics from one workspace
What users say about Draxlr
Draxlr offers a clean, modern interface and makes it incredibly easy to build dashboards — even for non-technical users. I especially like the visual quality and flexibility of the available graph types. It's intuitive, fast to set up, and has excellent usability from the start. The ability to securely share dashboards via link is a game-changer for our client reporting. — Review from a SaaS Founder on G2
Pricing
Draxlr offers multiple plans depending on team size, embedding needs, and data volume. Pricing starts at $75/month.
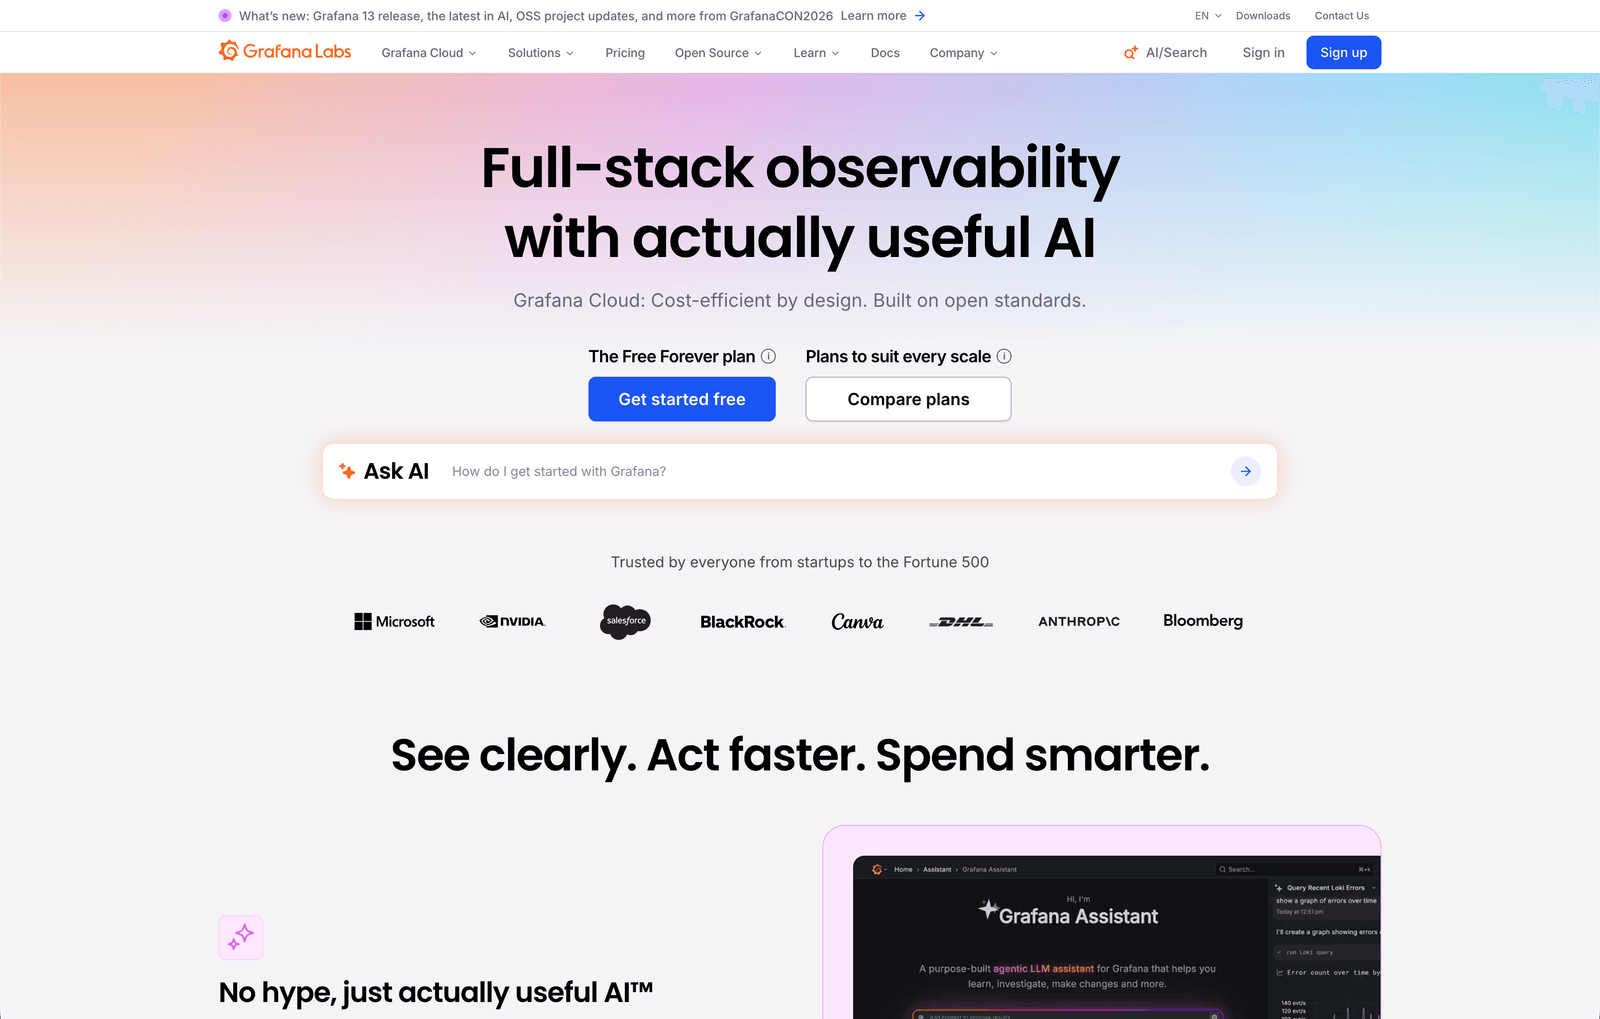
2. Grafana: Best for operational and time-series dashboards on PlanetScale
Best for
Engineering and ops teams that want real-time observability dashboards and metric tracking directly from their PlanetScale MySQL data.
Grafana connects to PlanetScale through its native MySQL data source, making it one of the most technically capable options for teams that need time-series visualizations, alerting, and operational monitoring alongside their product data. Grafana is open-source with a hosted cloud option, and connecting it to PlanetScale requires configuring an SSL certificate — something that's well-documented and straightforward for engineering teams.
Grafana excels at real-time metric panels, threshold-based alerts, and multi-source dashboards where you might combine PlanetScale data with infrastructure metrics. However, it's more engineering-oriented than BI-focused — nontechnical users typically need preconfigured dashboards to work with rather than building their own.
Key features
- Native MySQL data source with SSL support for PlanetScale connections
- Rich library of panels, chart types, and visualization options
- Alerting engine with notifications via Slack, email, PagerDuty, and more
What users say about Grafana
What I like most about Grafana is the flexibility and clarity it offers for visualizing metrics. In our projects, we handle a lot of monitoring data, and Grafana makes it easy to turn raw data into meaningful, easy-to-read dashboards. The UI is clean, and we can customize panels to fit our exact requirements.
Pricing
Grafana OSS is free and self-hosted. Grafana Cloud offers a free tier, with paid plans starting at $19/month plus usage-based fees for larger data volumes.
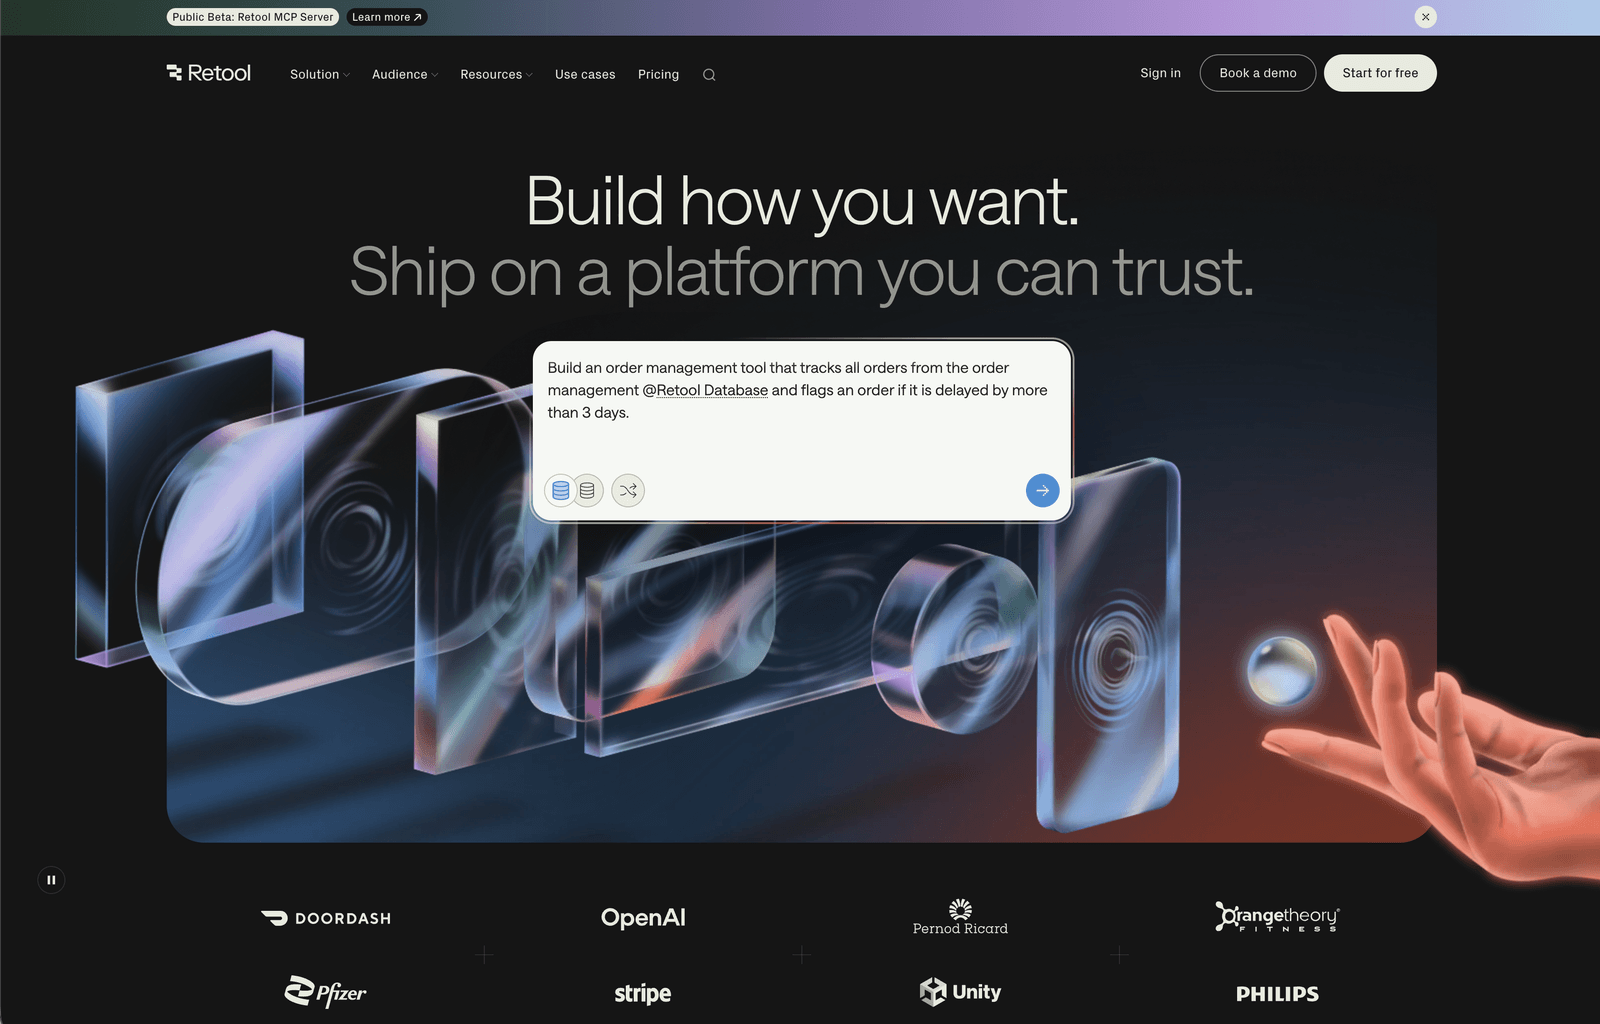
3. Retool: Best for internal tools and admin panels on PlanetScale
Best for
Product and engineering teams that need to build internal dashboards, admin panels, and operational tools directly on top of their PlanetScale data.
Retool connects to PlanetScale via a standard MySQL connection and is purpose-built for internal tool development. It provides a drag-and-drop UI builder on top of your database, letting teams create admin panels, approval workflows, order management dashboards, and other internal tools without starting from scratch. Retool has published detailed documentation on building admin panels specifically with PlanetScale, confirming its compatibility with PlanetScale's MySQL architecture.
The tradeoff is that Retool is builder-focused rather than analyst-focused. It's ideal when you need a custom internal interface on your PlanetScale data, but if your goal is BI-style dashboards with charts, aggregations, and self-serve exploration, a dedicated reporting tool will serve you better.
Key features
- Direct MySQL connection to PlanetScale with UI components for tables, forms, and charts
- Drag-and-drop interface builder with support for custom JavaScript logic
- 70+ native data source integrations alongside PlanetScale MySQL
What users say about Retool
The UI is intuitive, connecting to APIs or databases is fast, and I've used it to automate tasks, build dashboards, and link systems together that didn't talk to each other before. It significantly reduces the time required to build internal dashboards and admin panels.
Pricing
Retool offers a Free plan for up to 5 users. The Team plan starts at $10/user/month, with the Business plan at $50/builder/month.
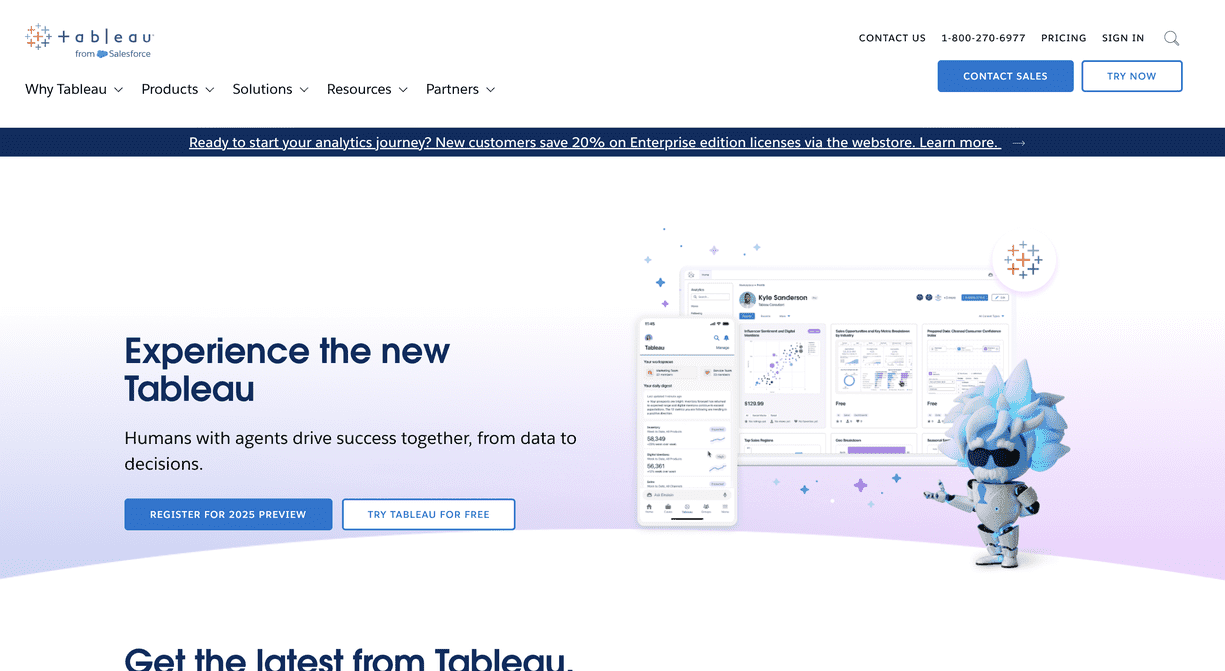
4. Tableau: Best for enterprise-scale visualization on PlanetScale
Best for
Enterprise teams with dedicated BI analysts who need sophisticated visualizations and deep analytical exploration.
Tableau connects to PlanetScale via its MySQL connector, giving enterprise analytics teams access to Tableau's industry-leading visualization and exploration capabilities. With PlanetScale's MySQL-compatible interface, teams can build complex dashboards, run multi-dimensional analyses, and publish reports across large organizations using Tableau's well-established governance features.
Tableau is one of the most powerful visualization tools available, but it's also one of the heaviest. It requires dedicated BI resources to set up, model, and maintain — making it a stronger fit for enterprise teams than for fast-moving SaaS products looking to ship dashboards quickly.
Key features
- MySQL connector compatible with PlanetScale's serverless architecture
- Advanced visualization capabilities with drag-and-drop dashboard builder
- Enterprise governance, workspace management, and publishing controls
What users say about Tableau
What I like best is Tableau's design philosophy — it emphasizes data exploration and visual storytelling over rigid reporting. The depth of visualization options is unmatched.
Pricing
Tableau Cloud pricing starts at $15/user/month for Viewers, $42/user/month for Explorers, and $75/user/month for Creators, billed annually.
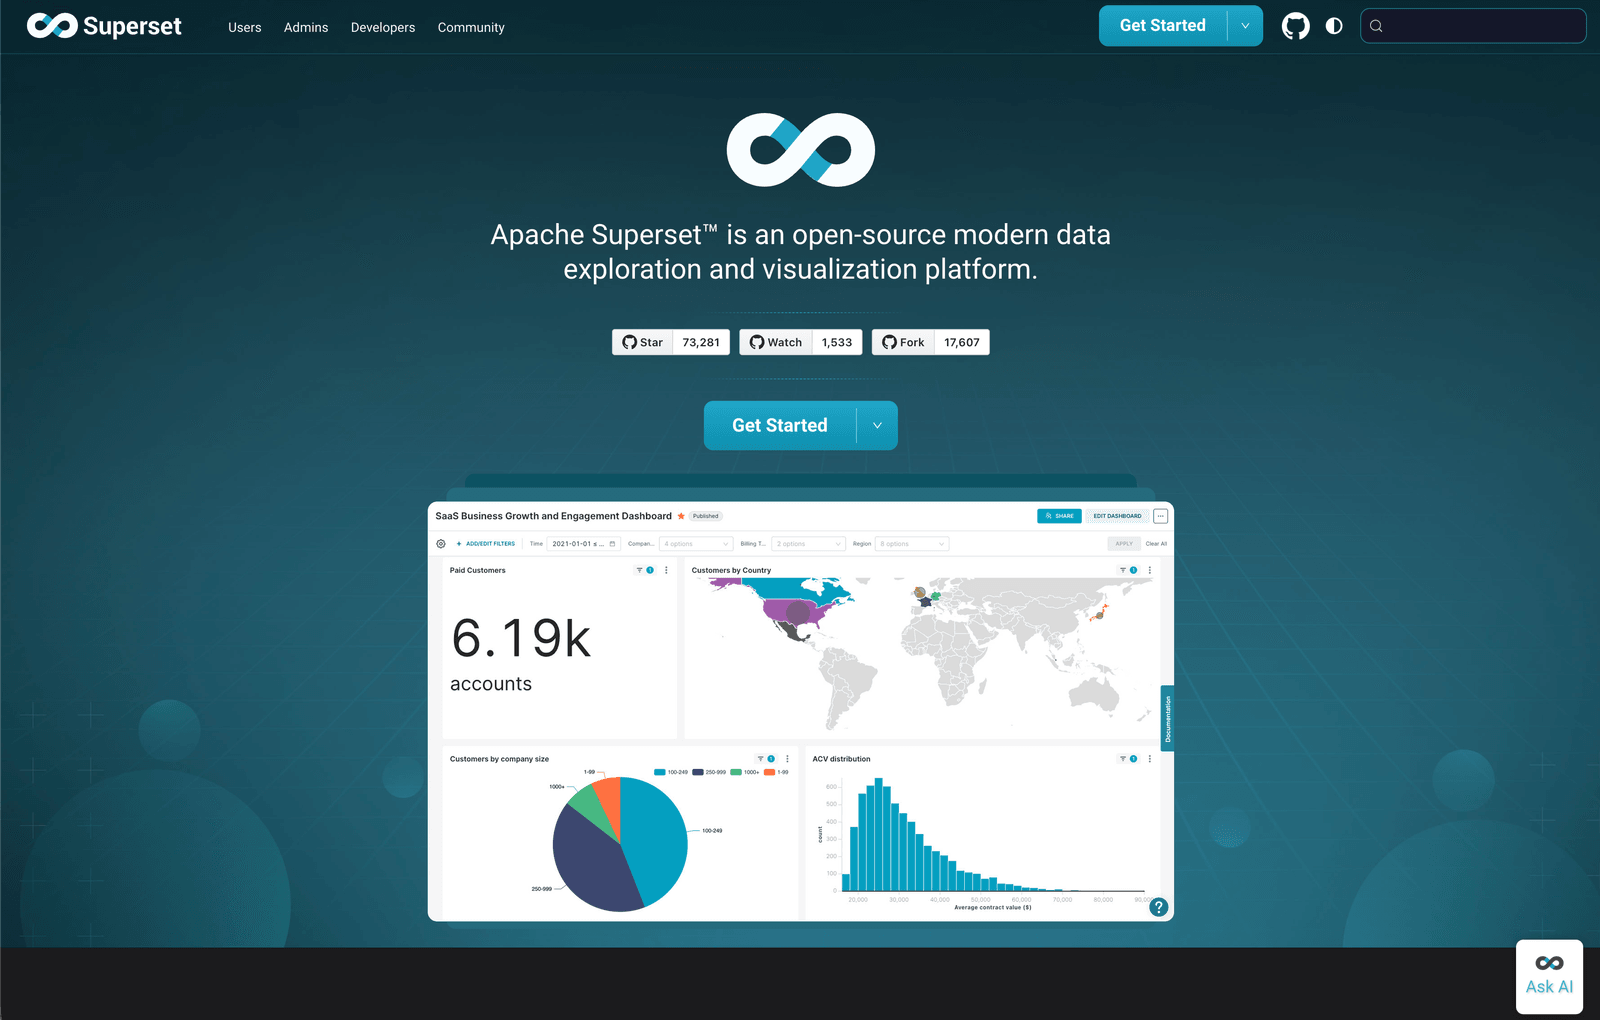
5. Apache Superset: Best open-source BI option for PlanetScale
Best for
Teams that want an open-source BI platform, have in-house engineering capacity, and want full control over their reporting infrastructure.
Apache Superset is a powerful open-source analytics platform that connects to PlanetScale via its SQLAlchemy MySQL connector. It supports SQL-based exploration, an interactive dashboard builder, and a wide range of visualizations — all without licensing costs. If your team is comfortable with self-hosting and maintenance, Superset gives you a capable reporting layer on top of your PlanetScale data with no vendor dependency.
The main investment with Superset is operational: deploying, securing, and maintaining the platform requires ongoing engineering attention. Teams that want a managed, low-maintenance reporting layer will find Superset heavier than necessary, but those who want maximum control over their analytics infrastructure will appreciate the flexibility.
Key features
- SQLAlchemy MySQL connector for PlanetScale compatibility
- SQL IDE and visual dashboard builder with broad chart library
- Fully open-source with self-hosted deployment
What users say about Apache Superset
We can combine data from different systems for thorough analysis because the platform supports an extensive range of data sources, including MySQL-compatible databases. For teams with engineering resources to manage it, the flexibility is hard to match.
Pricing
Free and open-source. Operational costs depend on hosting and ongoing maintenance resources.
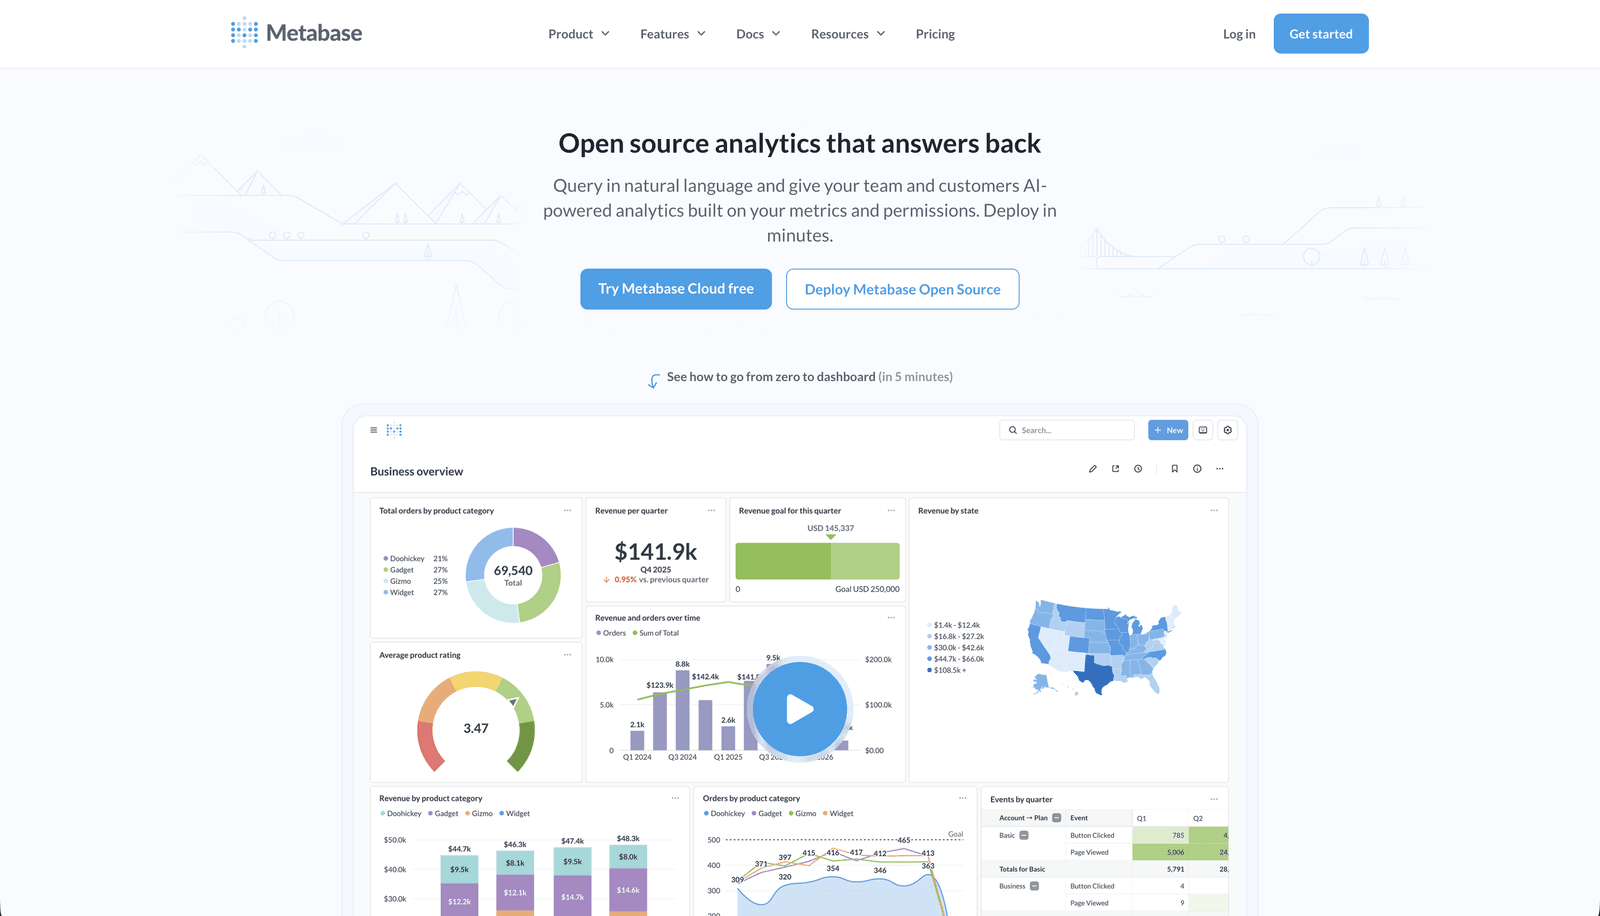
6. Metabase: Best for self-service analytics on PlanetScale
Best for
Teams that want nontechnical users to explore PlanetScale data independently, without writing SQL.
Metabase is one of the most widely used self-service BI tools, and it connects to PlanetScale via the MySQL driver. Its standout feature is the question builder — a guided, click-based interface that lets nontechnical users filter, group, and summarize data without touching SQL. For teams with mixed technical backgrounds, Metabase makes data exploration genuinely accessible to product managers, support leads, and operations teams.
Note that Metabase's compatibility with PlanetScale can require some configuration — specifically around the query planner settings. Teams should verify their connection carefully during setup. For production use, Metabase Cloud or a well-maintained self-hosted instance both work, with Metabase's active community providing guidance for common PlanetScale-specific configurations.
Key features
- Guided question builder for nontechnical users with no SQL required
- MySQL driver for PlanetScale connection with SSL support
- Shareable dashboards, scheduled email reports, and embedded analytics
What users say about Metabase
Metabase is great at turning data access into something that doesn't require a data analyst for every question. Our ops and support teams can answer their own questions now, which has reduced the backlog on our data team significantly.
Pricing
Metabase Open Source is free and self-hosted. Metabase Cloud starts at $500/month for up to 5 users, with pricing scaling by user count.
Implementing your PlanetScale reporting tool effectively
Choosing the right PlanetScale reporting tool is only half the job. Even the best tool won't deliver value without a thoughtful rollout. Here's how to get the most out of whichever option you choose.
1. Onboarding your team
Start with a proper onboarding session for anyone who will use the tool — developers, product managers, support leads, and operations teams. A short focused session upfront prevents the confusion and workarounds that emerge when people stumble through a new tool on their own. Establish clear expectations for who can access which dashboards and how new reports get created.
2. Start with a pilot
Rather than rolling dashboards out to everyone at once, start with a small group and a focused set of metrics. A pilot validates your data model, confirms that your key metrics are calculated consistently, and gives you a chance to catch any schema-specific quirks in your PlanetScale setup before they reach a wider audience.
3. Collect feedback continuously
Reporting is not static. As your product evolves, your data model changes, and your team's questions change with it. Build a lightweight feedback loop — a shared doc, a Slack channel, a recurring review — where users can flag outdated dashboards, missing metrics, or charts that don't reflect how the business actually works. Dashboards that nobody trusts are worse than no dashboards at all.
4. Monitor performance and usage
Track which dashboards get opened most frequently, which queries are slowest, and which reports get ignored. If a dashboard isn't used, it may need to be improved or removed. If a query is slow on PlanetScale, optimizing the underlying SQL or adding a read replica may be the right fix. Knowing how your team interacts with reporting helps you measure ROI and prioritize improvements over time.
Conclusion
The PlanetScale reporting tool you choose shapes how your whole team understands the business. It determines whether your product manager can answer their own questions, whether your support team has visibility into order history, and whether your customers trust the analytics you've built inside your product.
If you want a reporting layer that works naturally with PlanetScale — without data pipelines, warehouses, or heavy setup — tools like Draxlr let you ship dashboards quickly while keeping your stack simple. Whether you need internal visibility, customer-facing embedded analytics, or Slack alerts when key metrics change, the right tool should help you move fast without sacrificing clarity or data security.
If you'd like to explore a PlanetScale-native approach to dashboards and reporting, you can try Draxlr and see how it fits your workflow.
FAQs
1. What is a PlanetScale reporting tool?
A PlanetScale reporting tool connects directly to your PlanetScale database and lets you build dashboards, charts, and shared reports without writing ad-hoc SQL for every question. These tools give your team controlled access to live data without requiring direct database credentials or engineering involvement for every request.
2. Can I connect standard BI tools to PlanetScale?
Yes. PlanetScale is MySQL-compatible, so most BI tools that support MySQL can connect using standard credentials and an SSL certificate. Some tools may require minor configuration around PlanetScale's Vitess-specific query behavior, but the connection itself works with any standard MySQL driver.
3. Does PlanetScale have built-in reporting?
PlanetScale includes built-in Insights for query performance monitoring and database observability, but it's not designed for business dashboards or team-level reporting. For product metrics, customer analytics, or internal reporting, a dedicated reporting tool is the right choice.
4. Is it safe to connect a reporting tool directly to PlanetScale?
Yes. Best practice is to use a read-only password (PlanetScale lets you create branch-specific passwords with read-only access) and connect over SSL. Most modern reporting tools support both. This ensures your reporting layer can never accidentally modify production data.
5. Can non-technical team members use PlanetScale reporting tools?
Yes — with the right tool. Options like Draxlr and Metabase offer visual query builders, saved dashboards, and sharing features that make data exploration accessible to product managers, support teams, and operations leads without requiring SQL knowledge.
6. Do I need a data warehouse to report on PlanetScale data?
No. PlanetScale is a production-grade MySQL-compatible database, and most reporting tools connect directly to it. Unless you have very large analytical workloads or need to join across multiple databases, a direct connection is faster to set up and easier to maintain than introducing a warehouse.
About the author

Vivek is a coder and the founder of Draxlr who cares deeply about building good products. He works at the intersection of AI, SQL, dashboards, and embedded analytics, with a strong focus on making complex data workflows feel simple, useful, and fast for real teams.
If you have questions about anything in this guide, or want to compare options for your specific stack, you can email Vivek at vivek@draxlr.com, try Draxlr free, or reach out directly through the Draxlr team.