Build dashboards and set up Slack alerts on the PlanetScale database.
Draxlr is the first BI tool with full support for PlanetScale databases. Filter, sort, summarise, and visualise your MySQL database on PlanetScale.
PlanetScale is no doubt one of the most revolutionary database platforms. It provides one of the best developer experiences when it comes to deploying and managing MySQL databases. And it does so without compromising on performance, user experience, or feature set. The database branches and deploy requests in PlanetScale provide a safe way to make schema changes in your MySQL database. The web interface is intuitive, and if you need more control over your databases, you also have a robust CLI that gives you more control over how you are managing your database. All of this comes with the ability to scale your database to handle millions of reads and writes.
What makes this possible is the underlying technology, which is Vitess. Vitess is the engine that makes it possible to scale to this enormous scale. But it comes with some compromises, like not having foreign-key constraints. This brings some problems when you try to use your PlanetScale MySQL database with some of the BI tools. At the moment, no major BI tools (Metabase, Redash, Tableau, and PowerBI) properly support PlanetScale, except Draxlr.
We are thrilled to announce that Draxlr now fully supports PlanetScale databases. You can query and visualise your PlanetScale MySQL data on Draxlr to build dashboards, setup Slack, and email alerts. Let’s see it in action.
Connect your database
Head out to https://app.draxlr.com/ and register yourself; once the registration is done, you’ll be asked to choose a setup type. If you have your database credentials and know how your data is structured, you can click on the Manual option, and if you think you’ll need assistance setting up your database, you can click on the Assisted option and schedule a call with us. If you choose the manual setup option, you will be taken to the Add Database page.
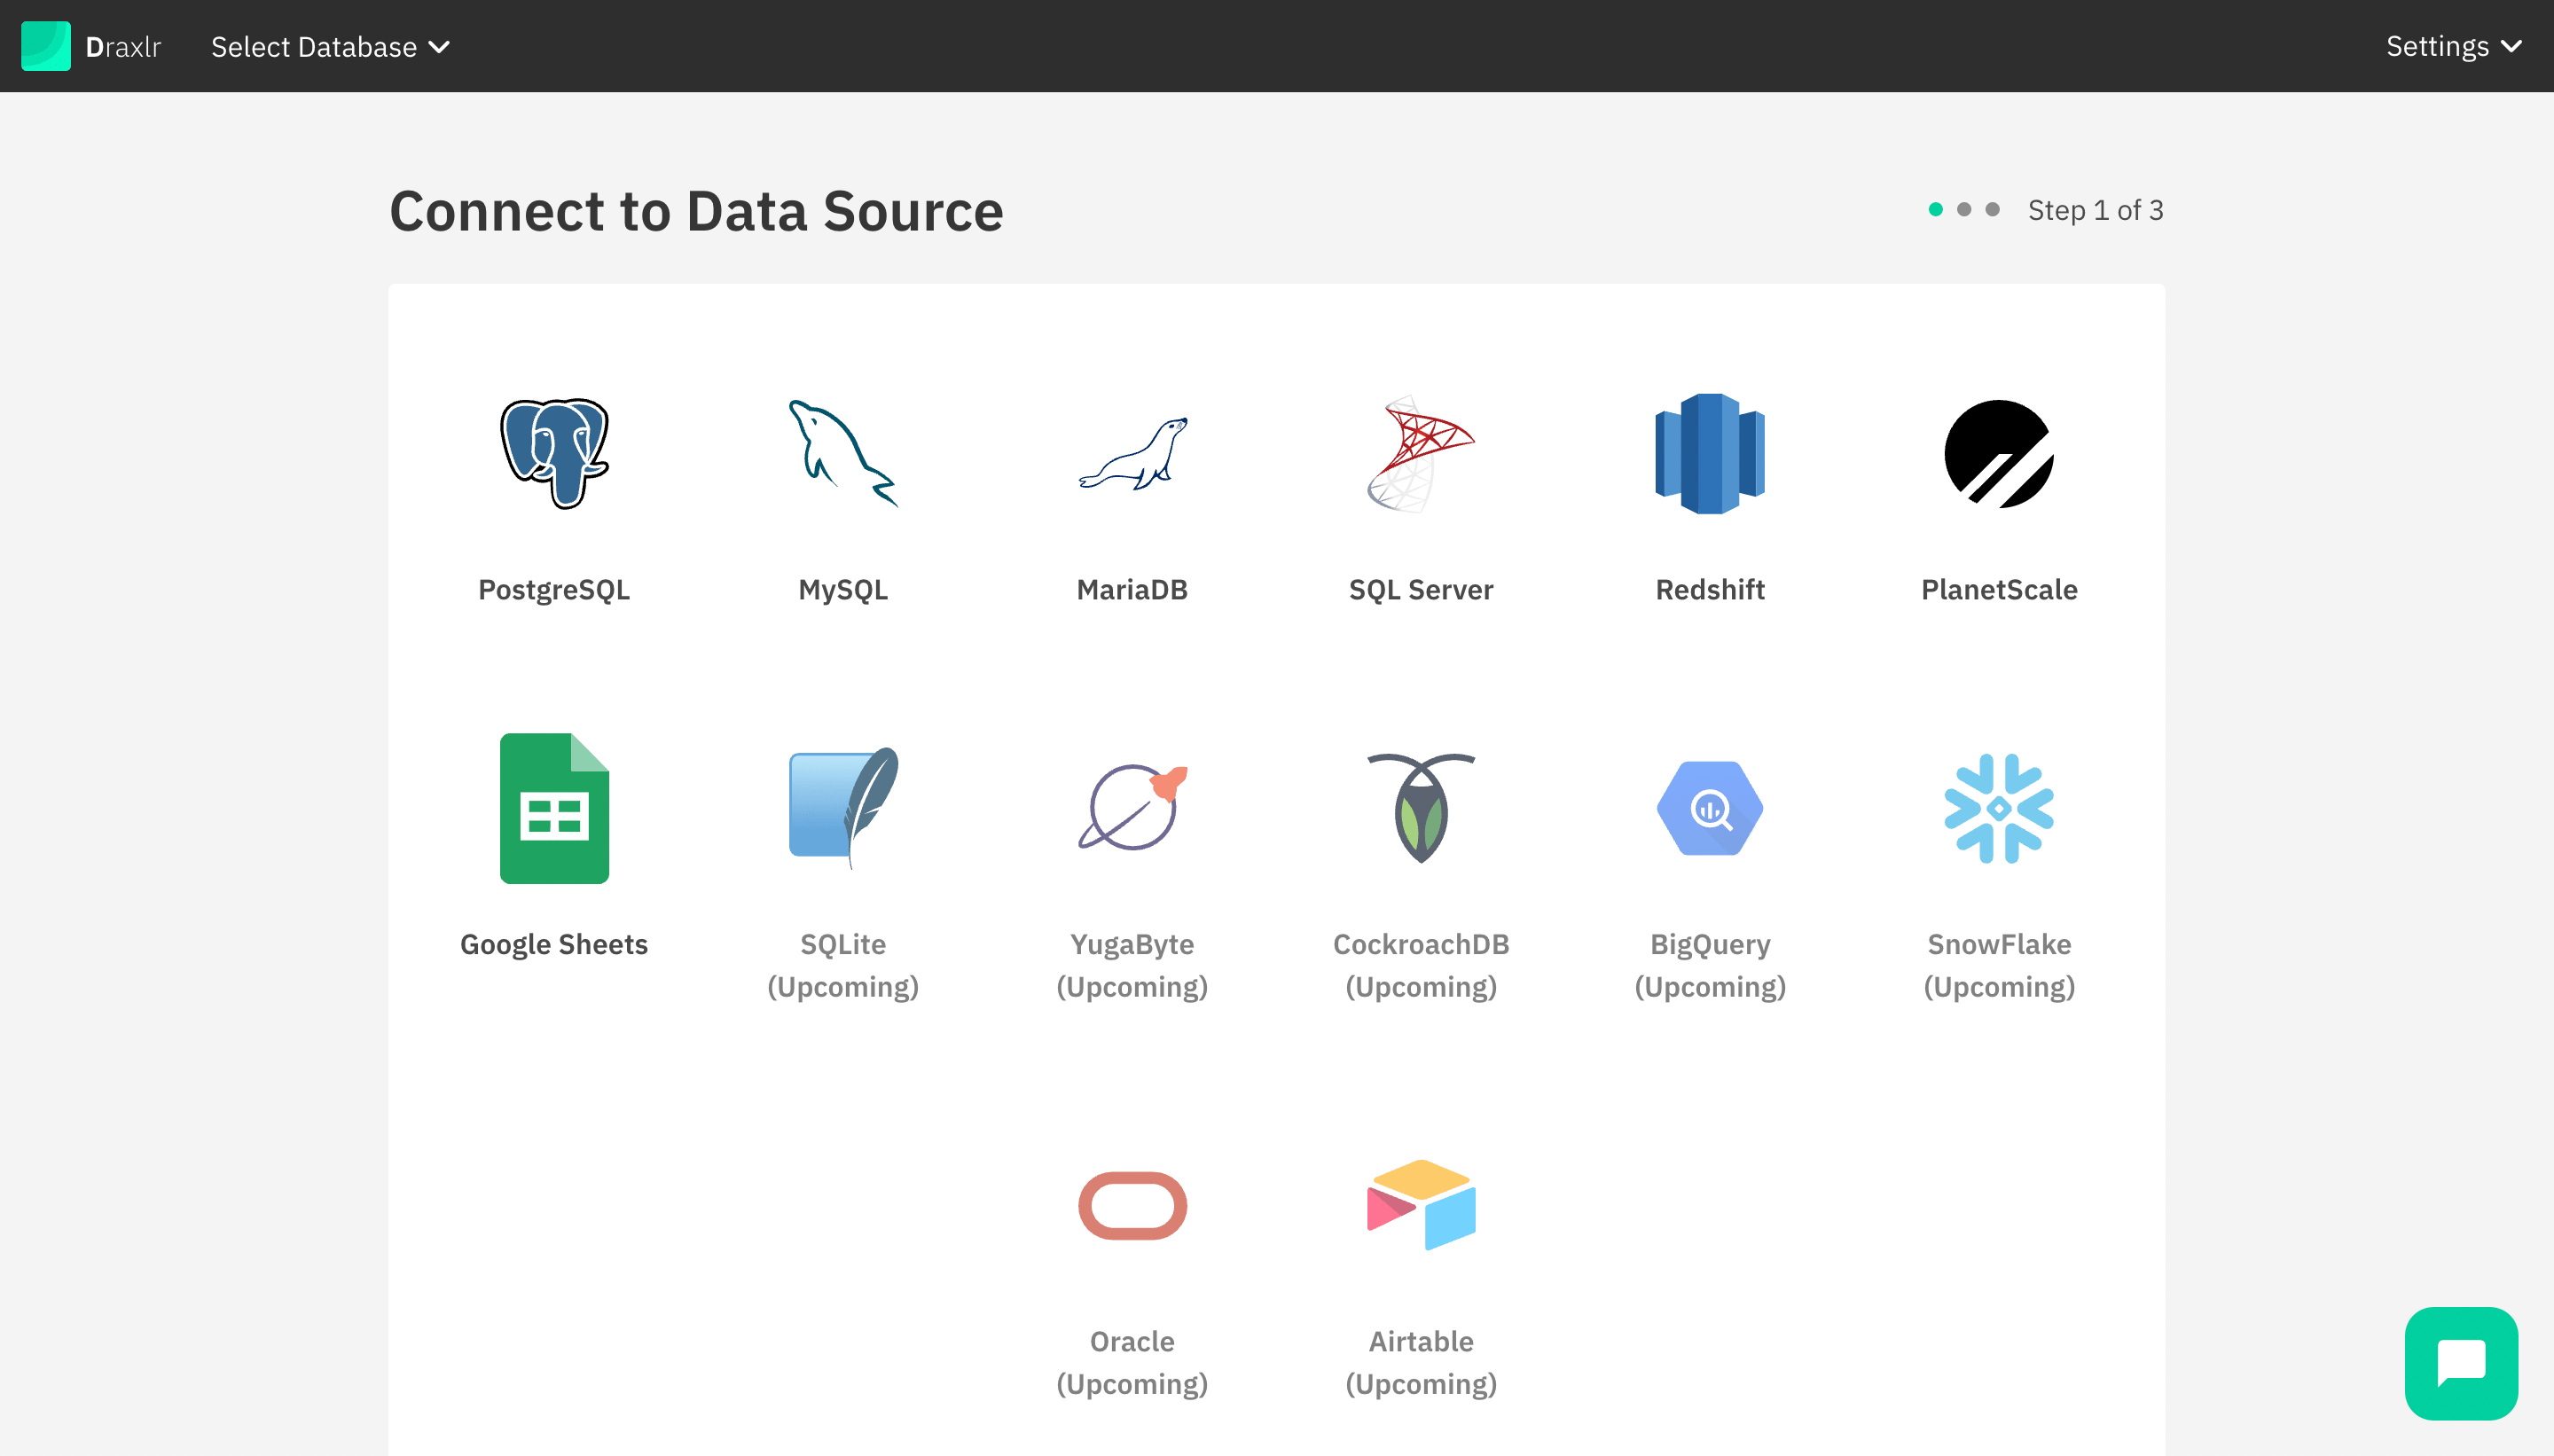
On the page above, select the PlanetScale option, then enter your database credentials.
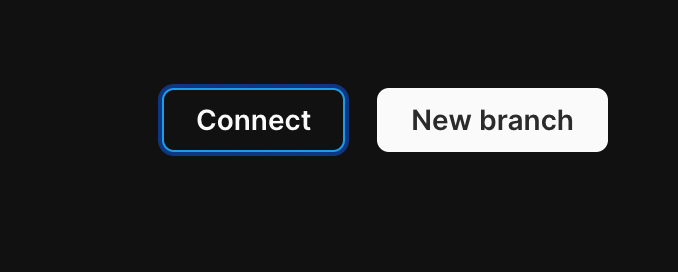
To get credentials for your Planetscale database, go to your Planetscale dashboard and select the database you want to connect to Draxlr. Then hit the connect button on the top right; it’ll open a popup with your database credentials. Then select General in the Connect with dropdown. Then you’ll have the credentials for your database. Except for the password, which you will have to generate each time you open this popup.
Just fill it in on the Draxlr app and hit the Test Connection button. If the connection is successful, the database will be automatically connected to Draxlr.
In a few seconds, you should see the tables page with a list of all the tables in your database. Click on any of the tables or hit the Explore button on the top right, which will take you right to the Explore Section of the Draxlr.
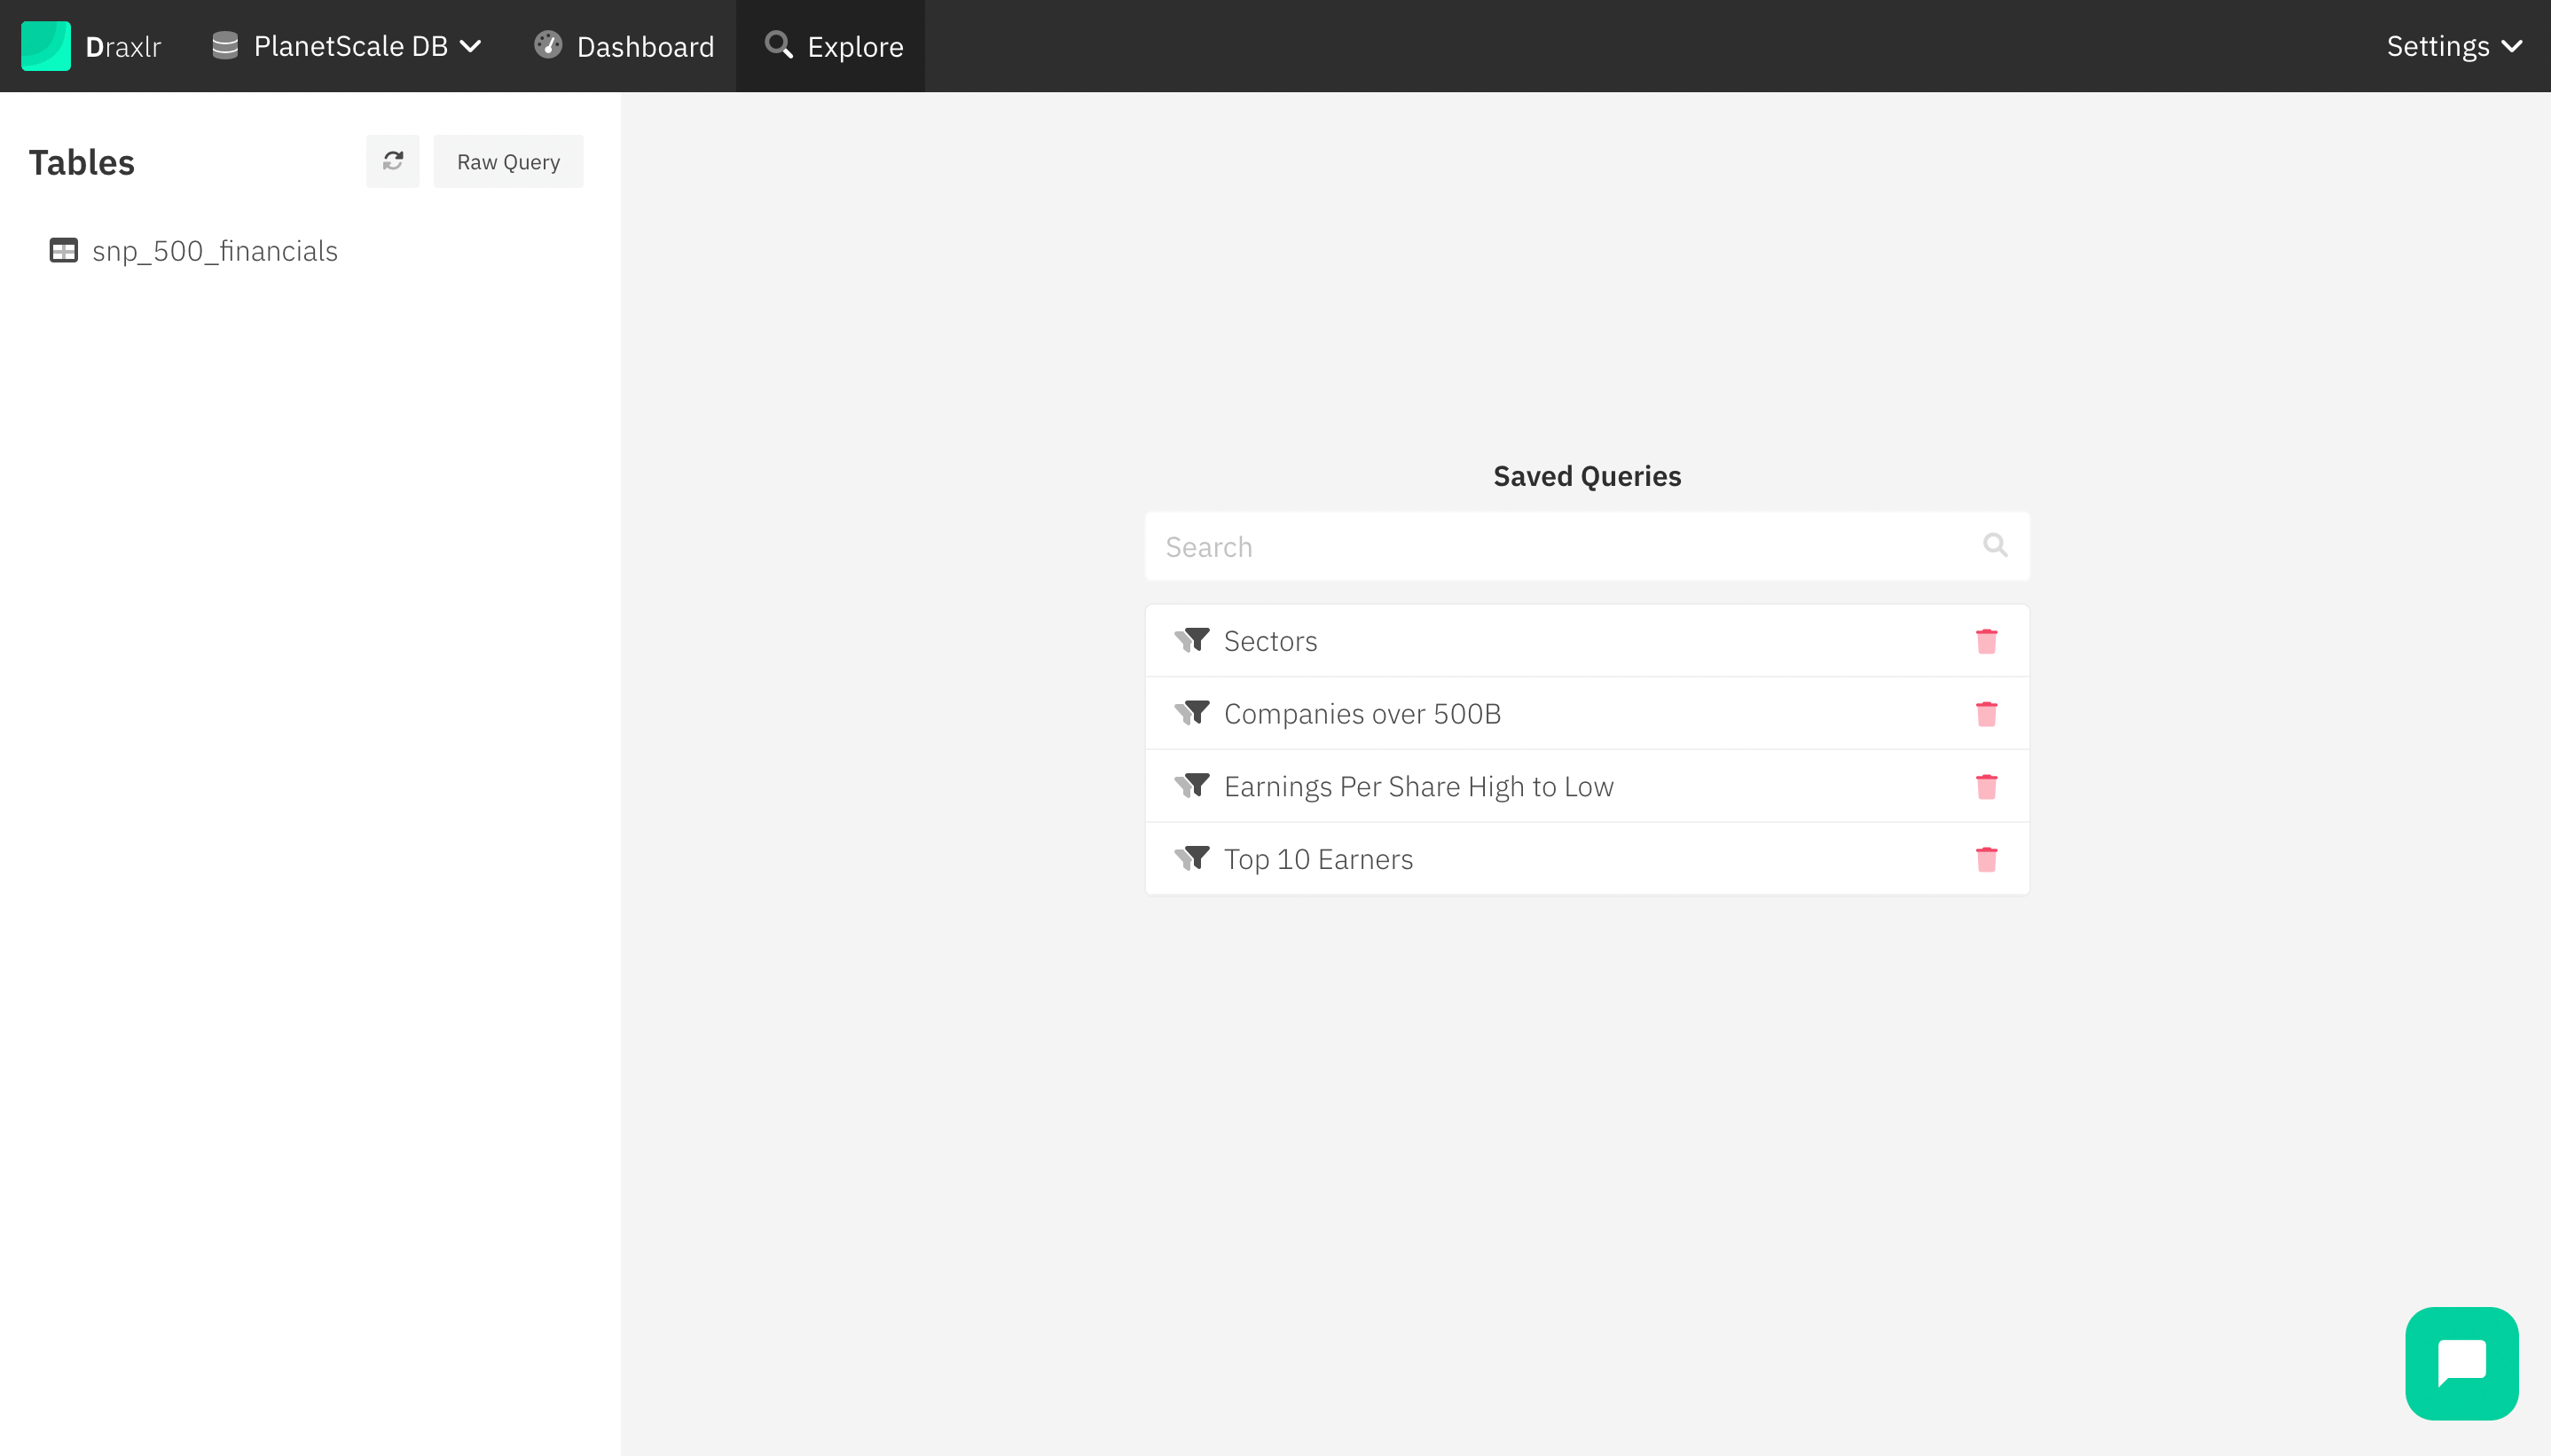
Explore Data
Explore is one of the two major sections of Draxlr (Dashboard being another one). In Explore, you can query your database to find the answers you are looking for and save them as saved queries. Currently, there are two ways to get those answers. Either you can dive into raw SQL queries or you can use our intuitive Query Builder, which lets you quickly find answers without writing a single line of code. Even if you can write raw SQL queries, the elegance of the query builder makes the process simpler and easier.
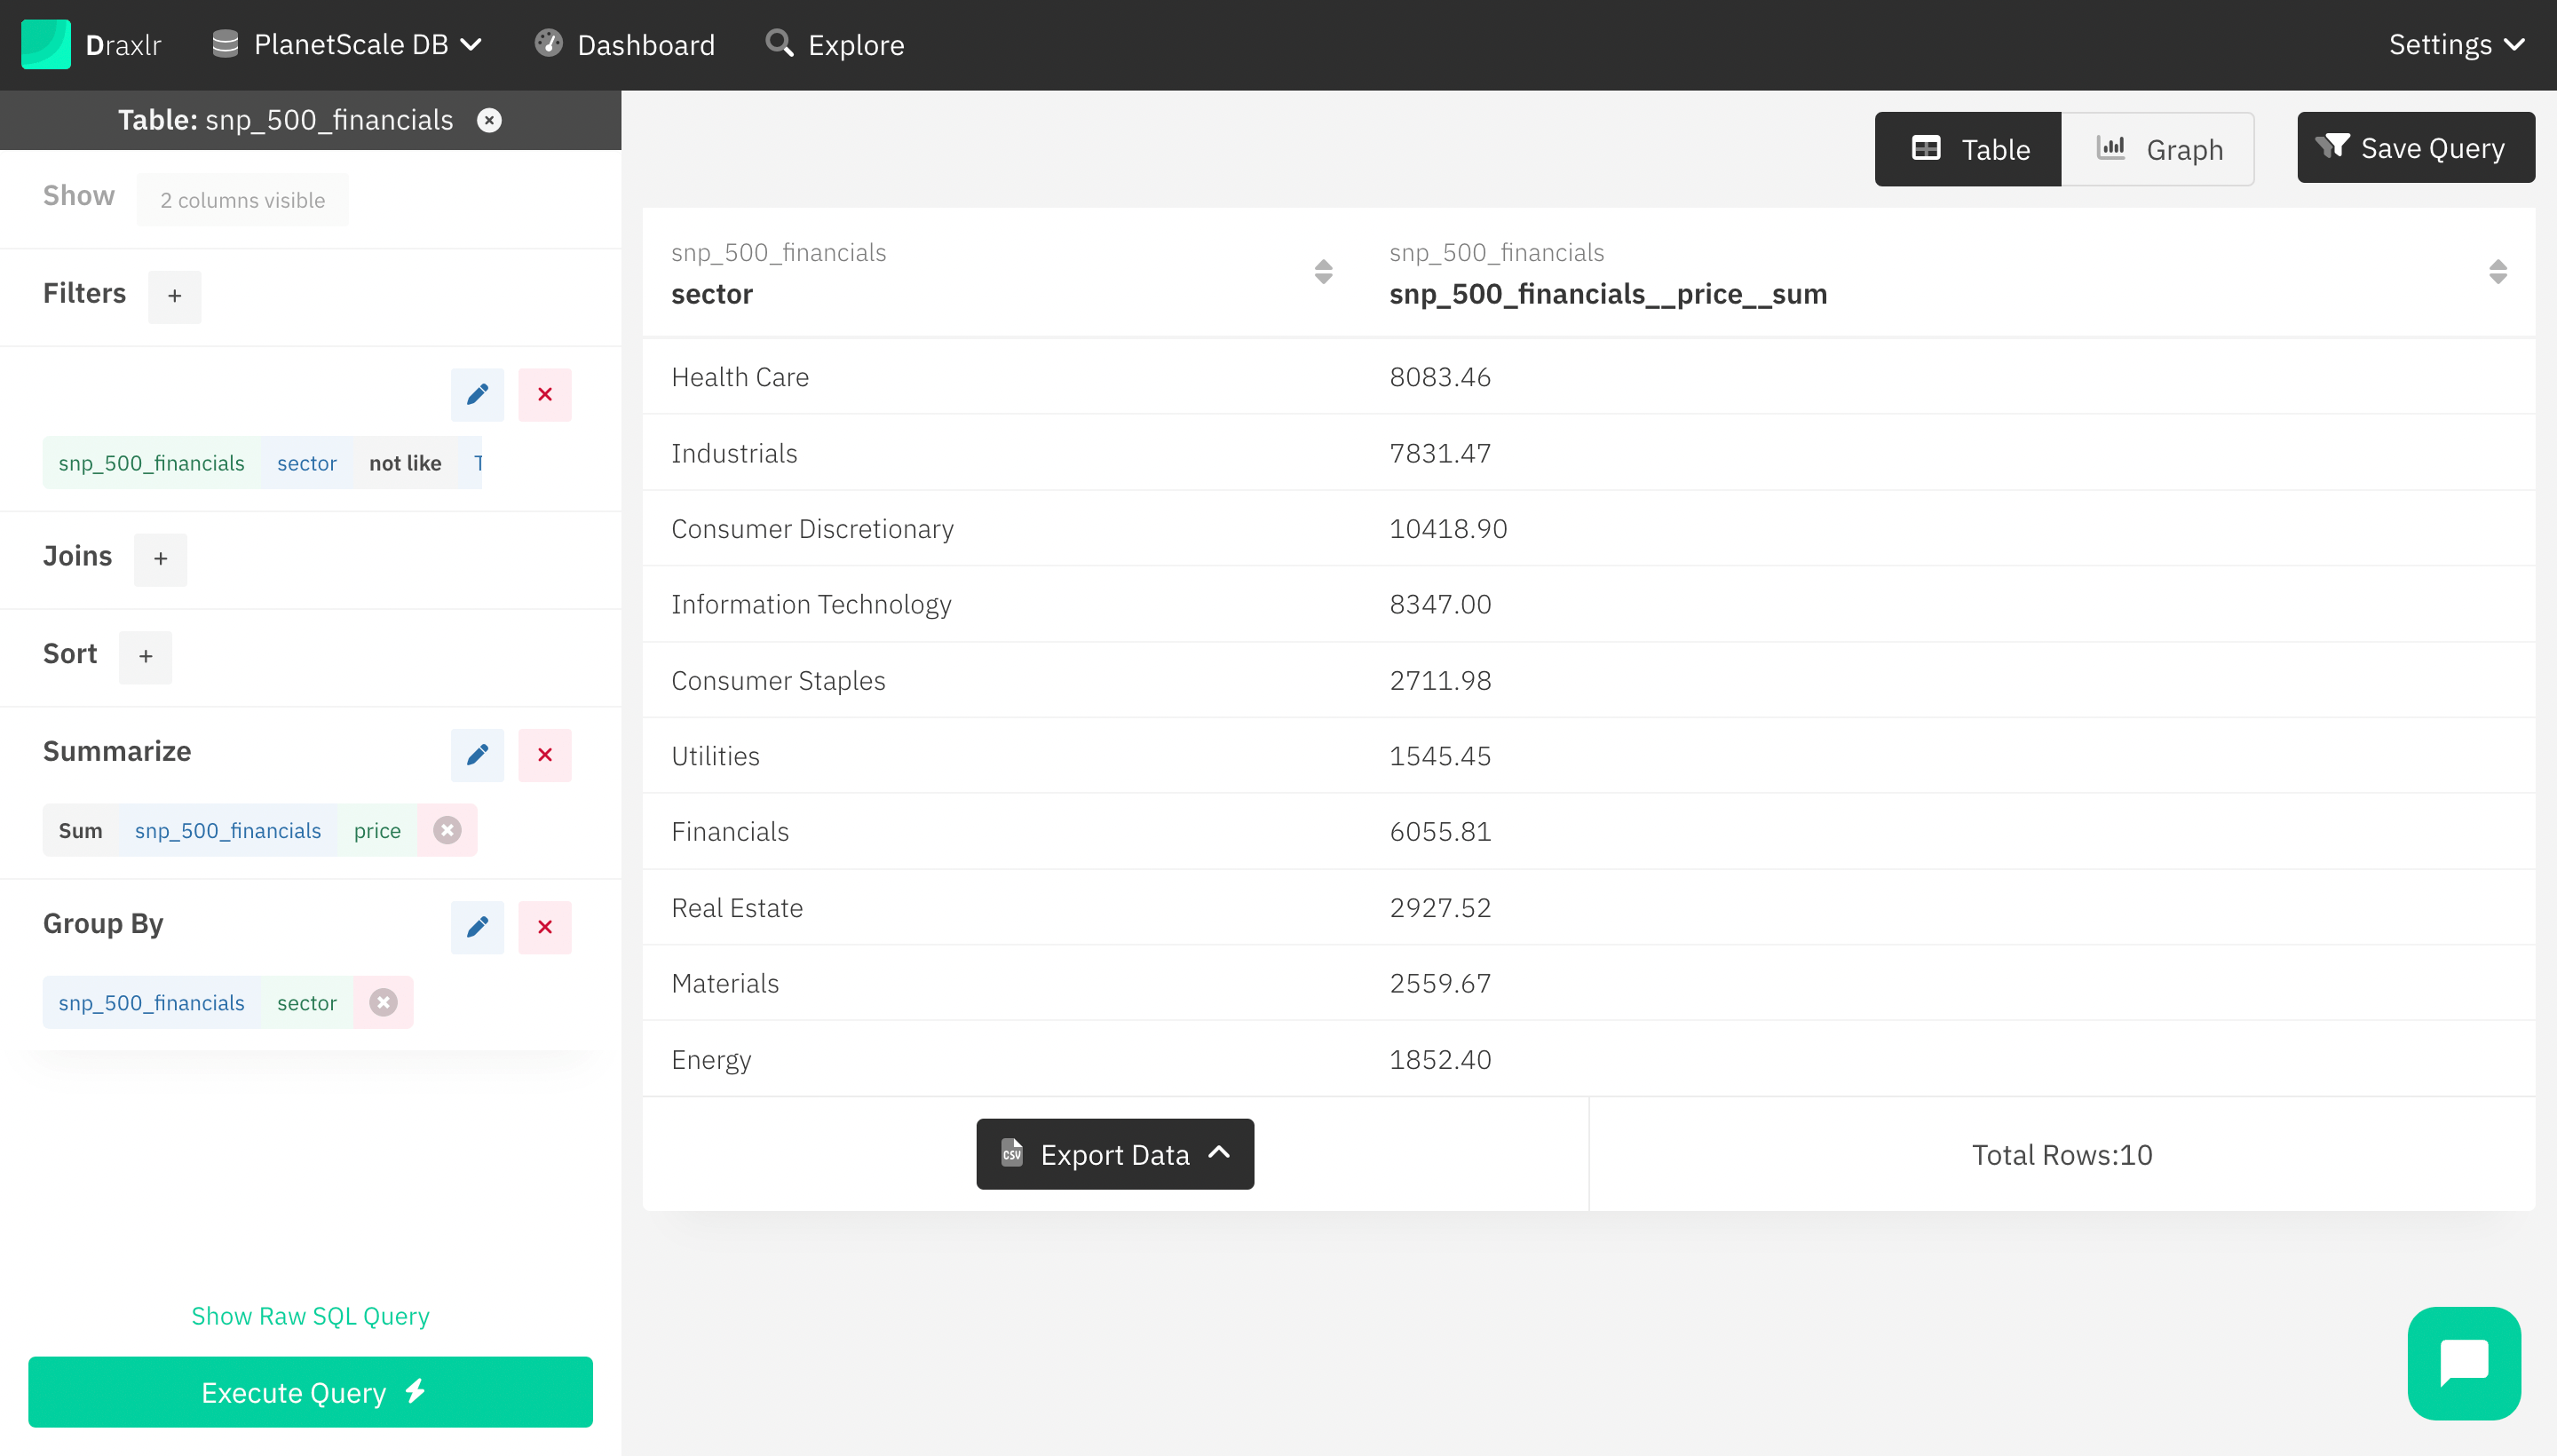
Query Builder
Draxlr provides a UI to filter, sort, and summarise your data. As you can see below, the query builder has multiple operations, and you can choose them to get the answer you need from your database. You can apply a complex filter and order data by a field or multiple fields. You can even summarise your data and group the results based on some metric. Once you have your answers, you can save them as a query. Which you can use later to build dashboards and set up alerts.
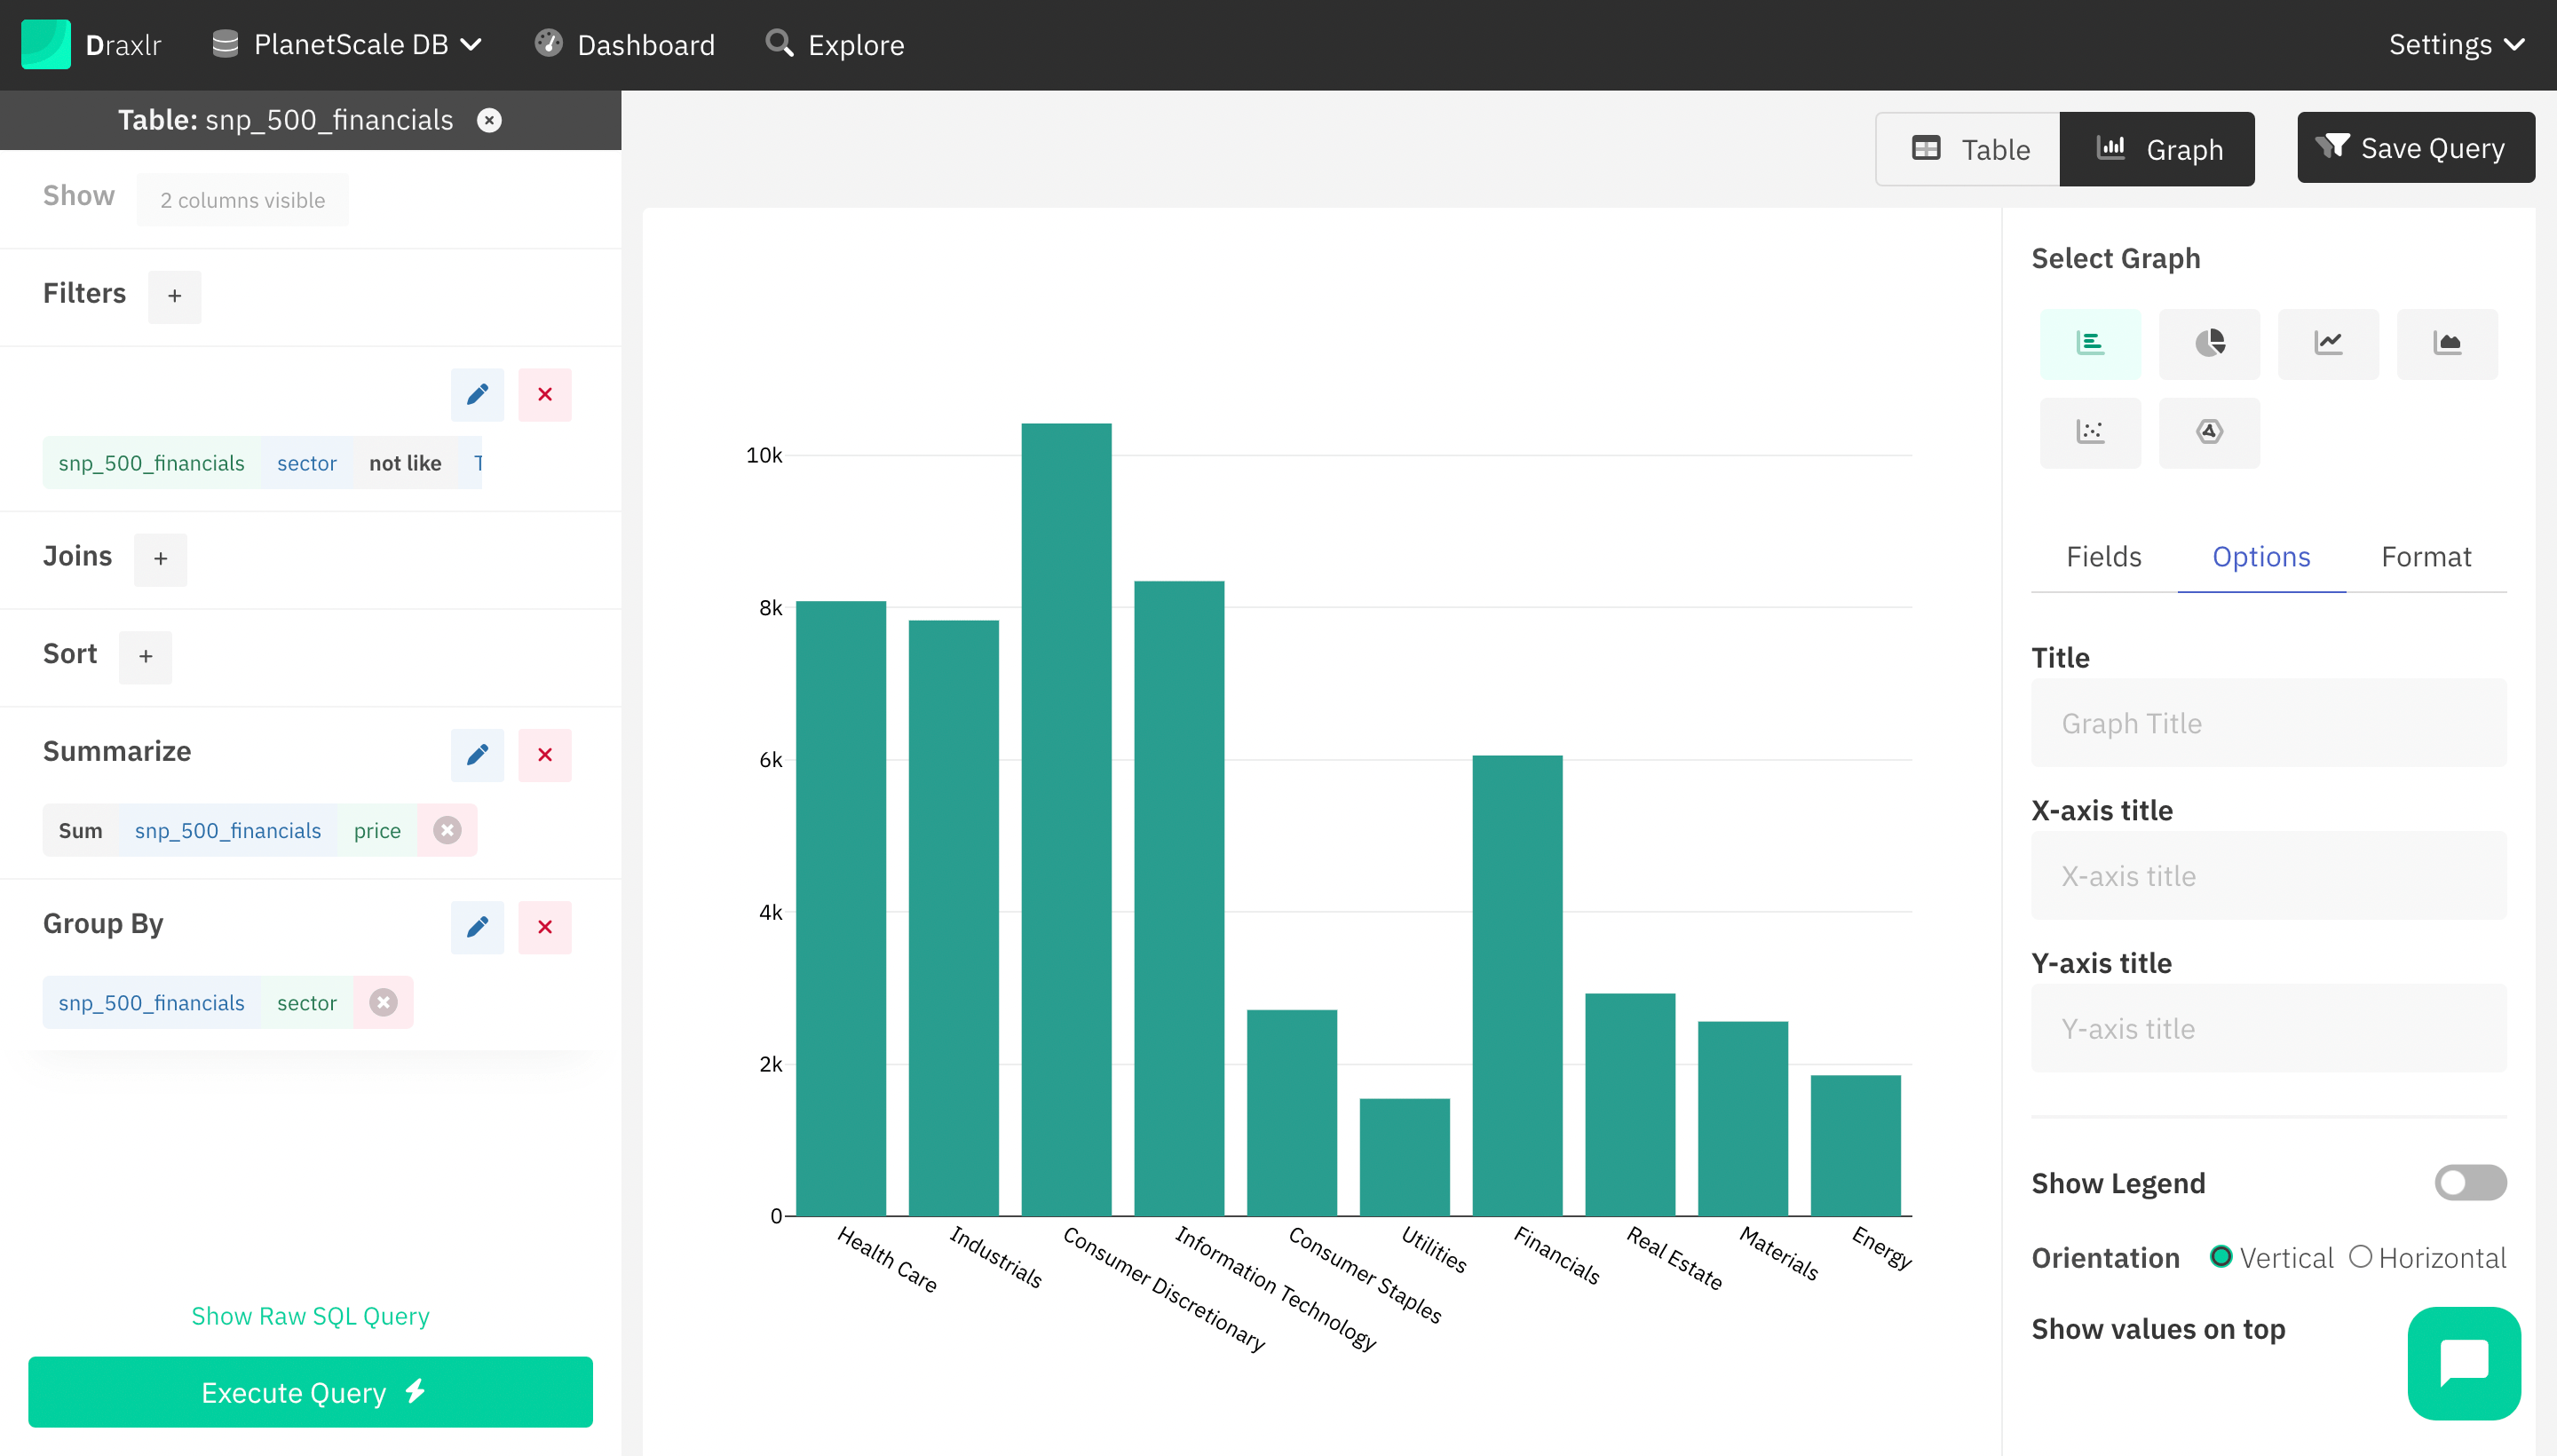
Graphs and charts
Once you have applied your filters and summarizations, you can visualise your data in graphs and charts. Draxlr has powerful options to build charts. You can select from a set of supported graph options. You can select fields for each axis (multiple for the y-axis). You can add labels and titles and update orientation. In the case of grouped results, you can group the results in different ways. Not just that, you can also choose to format your results in the graph in a certain way (precision, currency, etc.). Once you have built your graphs, you can save or update them in your query, which you can use later to build the dashboard.
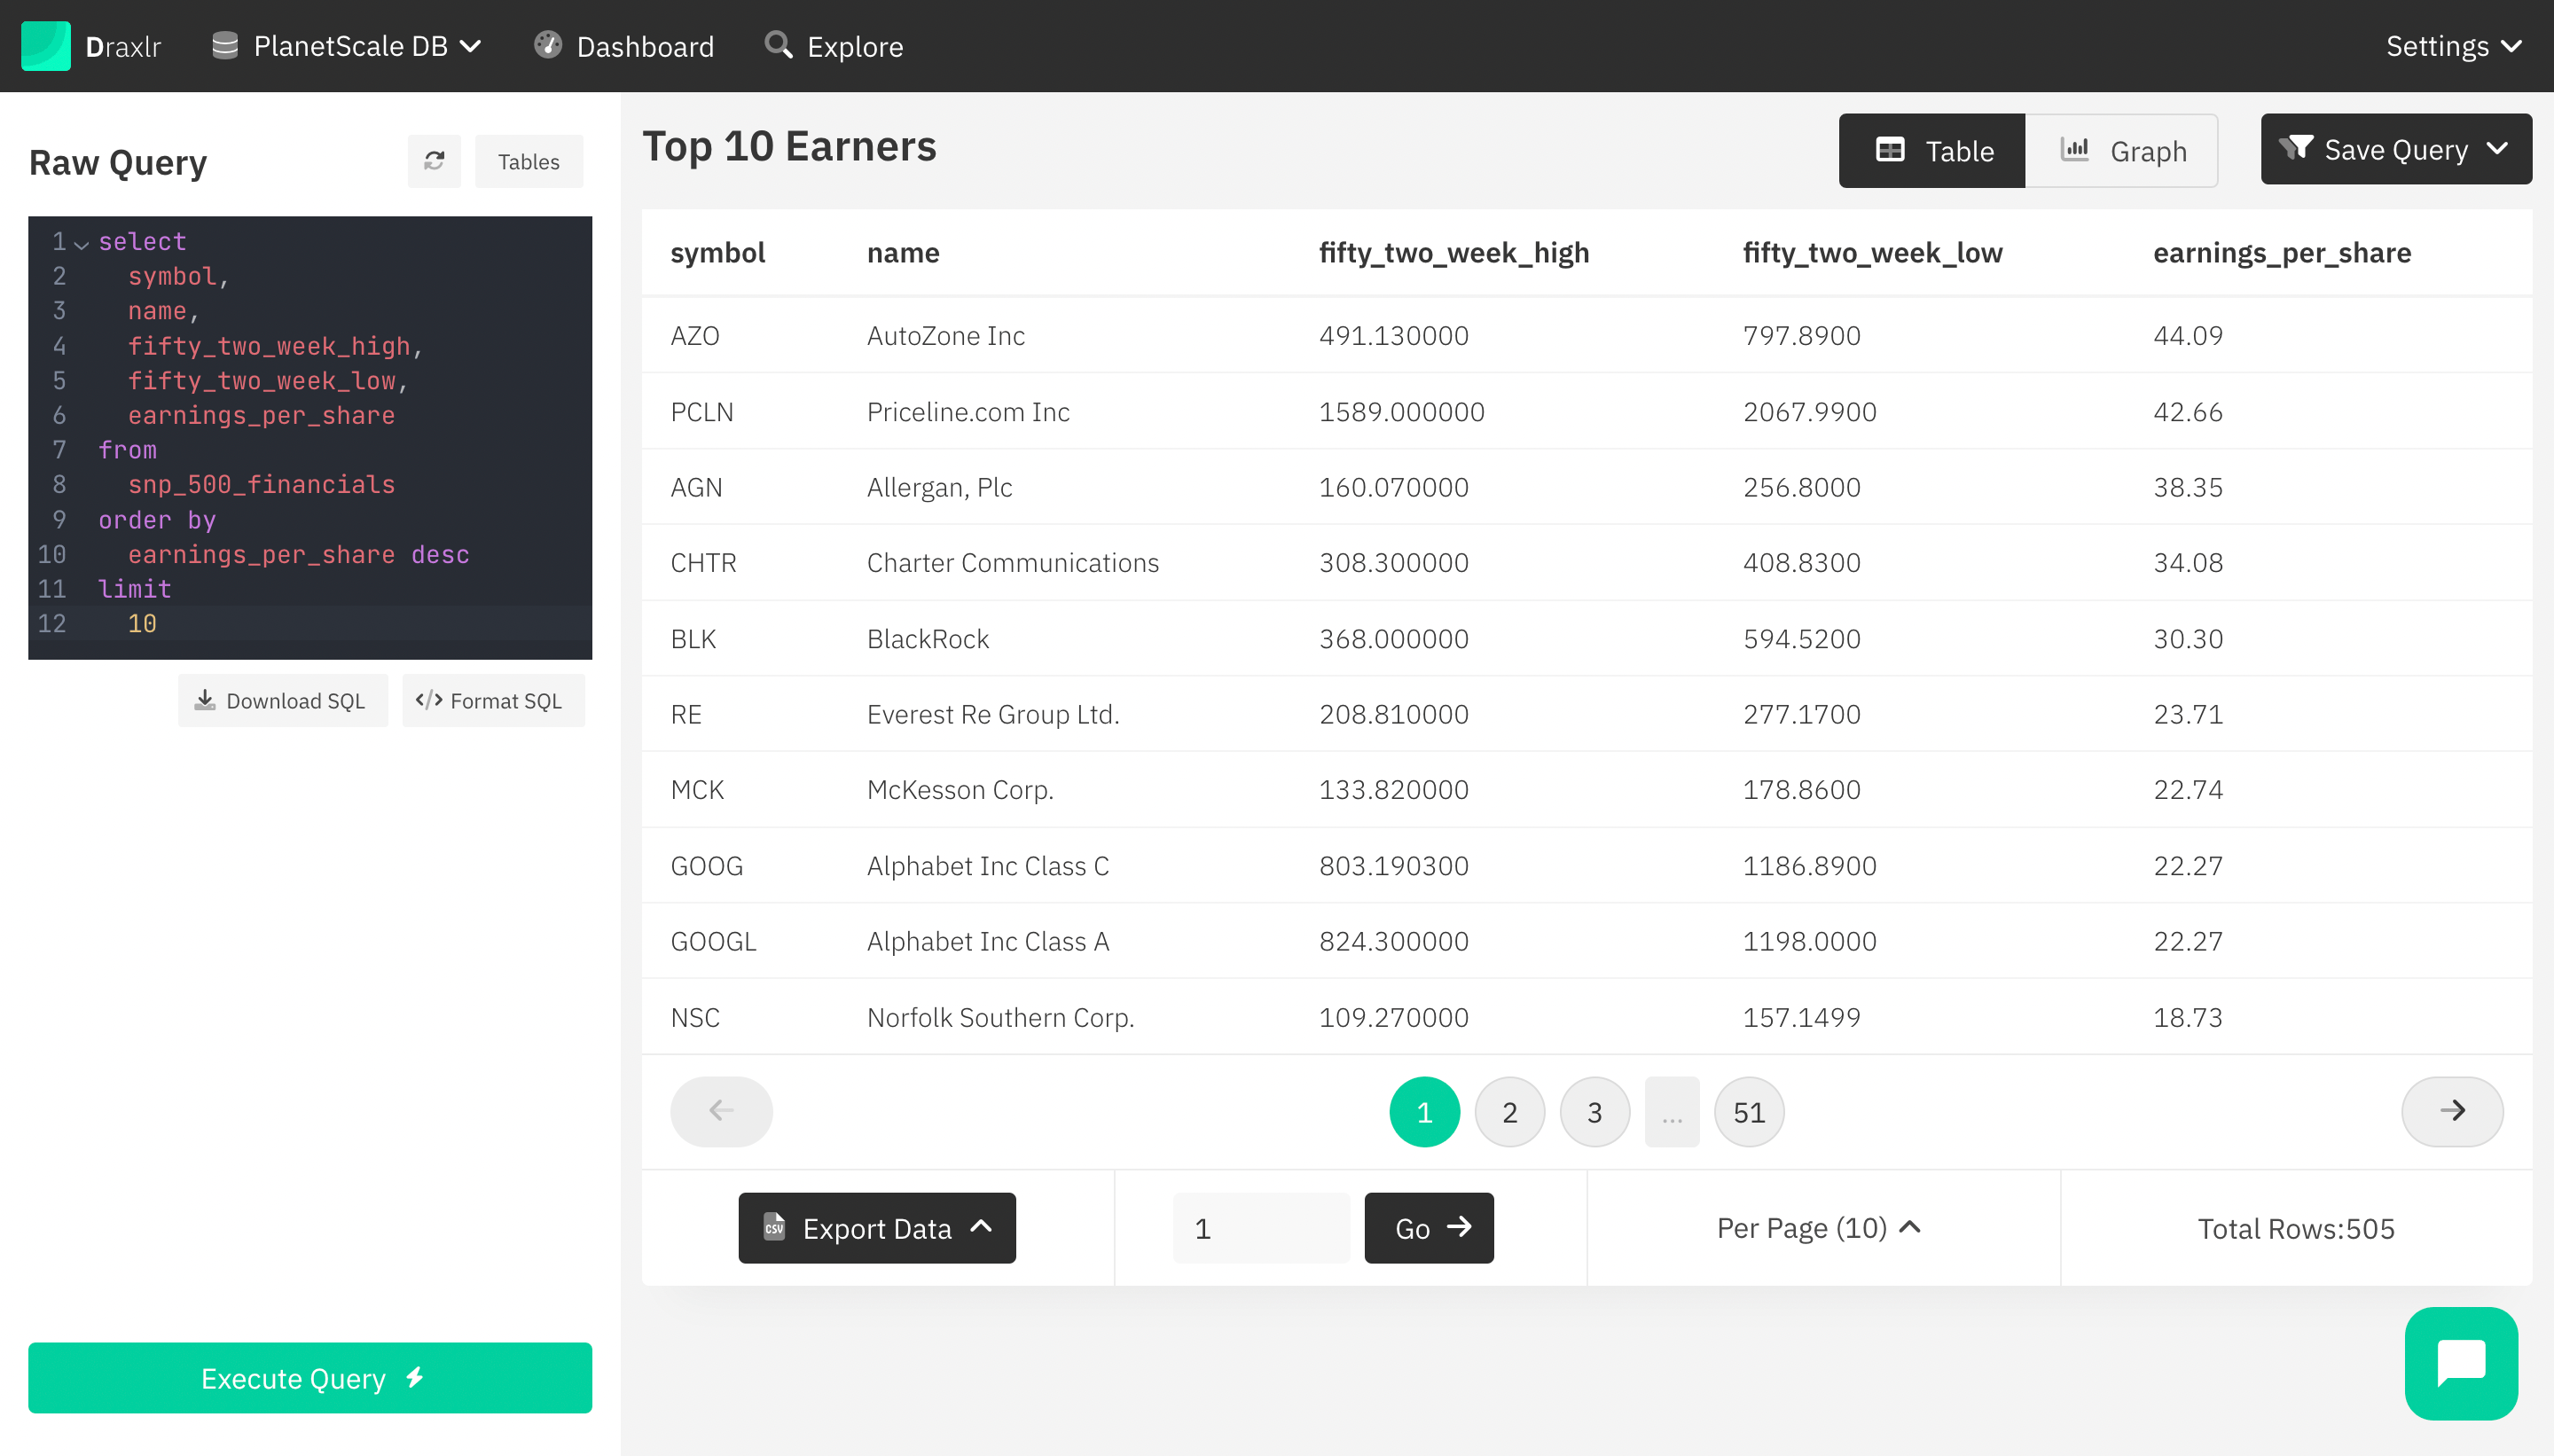
Raw Query
Although the query builder provides quite a lot of options to get the answers you are looking for, there are times when you just want the raw power of SQL queries. To write SQL queries, you can switch to raw query mode in Draxlr. If you are already in the query builder, you can hit the button above Execute that says Show Raw SQL Query. That will take you to the raw query mode with the code editor. You will get the SQL for the query that you have built using the Query Builder. You can update the query and see the results on the right side. If you want to start from scratch, you can deselect the table you are on, then hit the Raw SQL button above the table list. The code editor fully supports SQL; it can provide code highlights, formatting, downloading, and even automatic completion. You can save the queries that you have created using the Raw Query editor as well to use later for the dashboard and slack/email alerts.
Dashboards
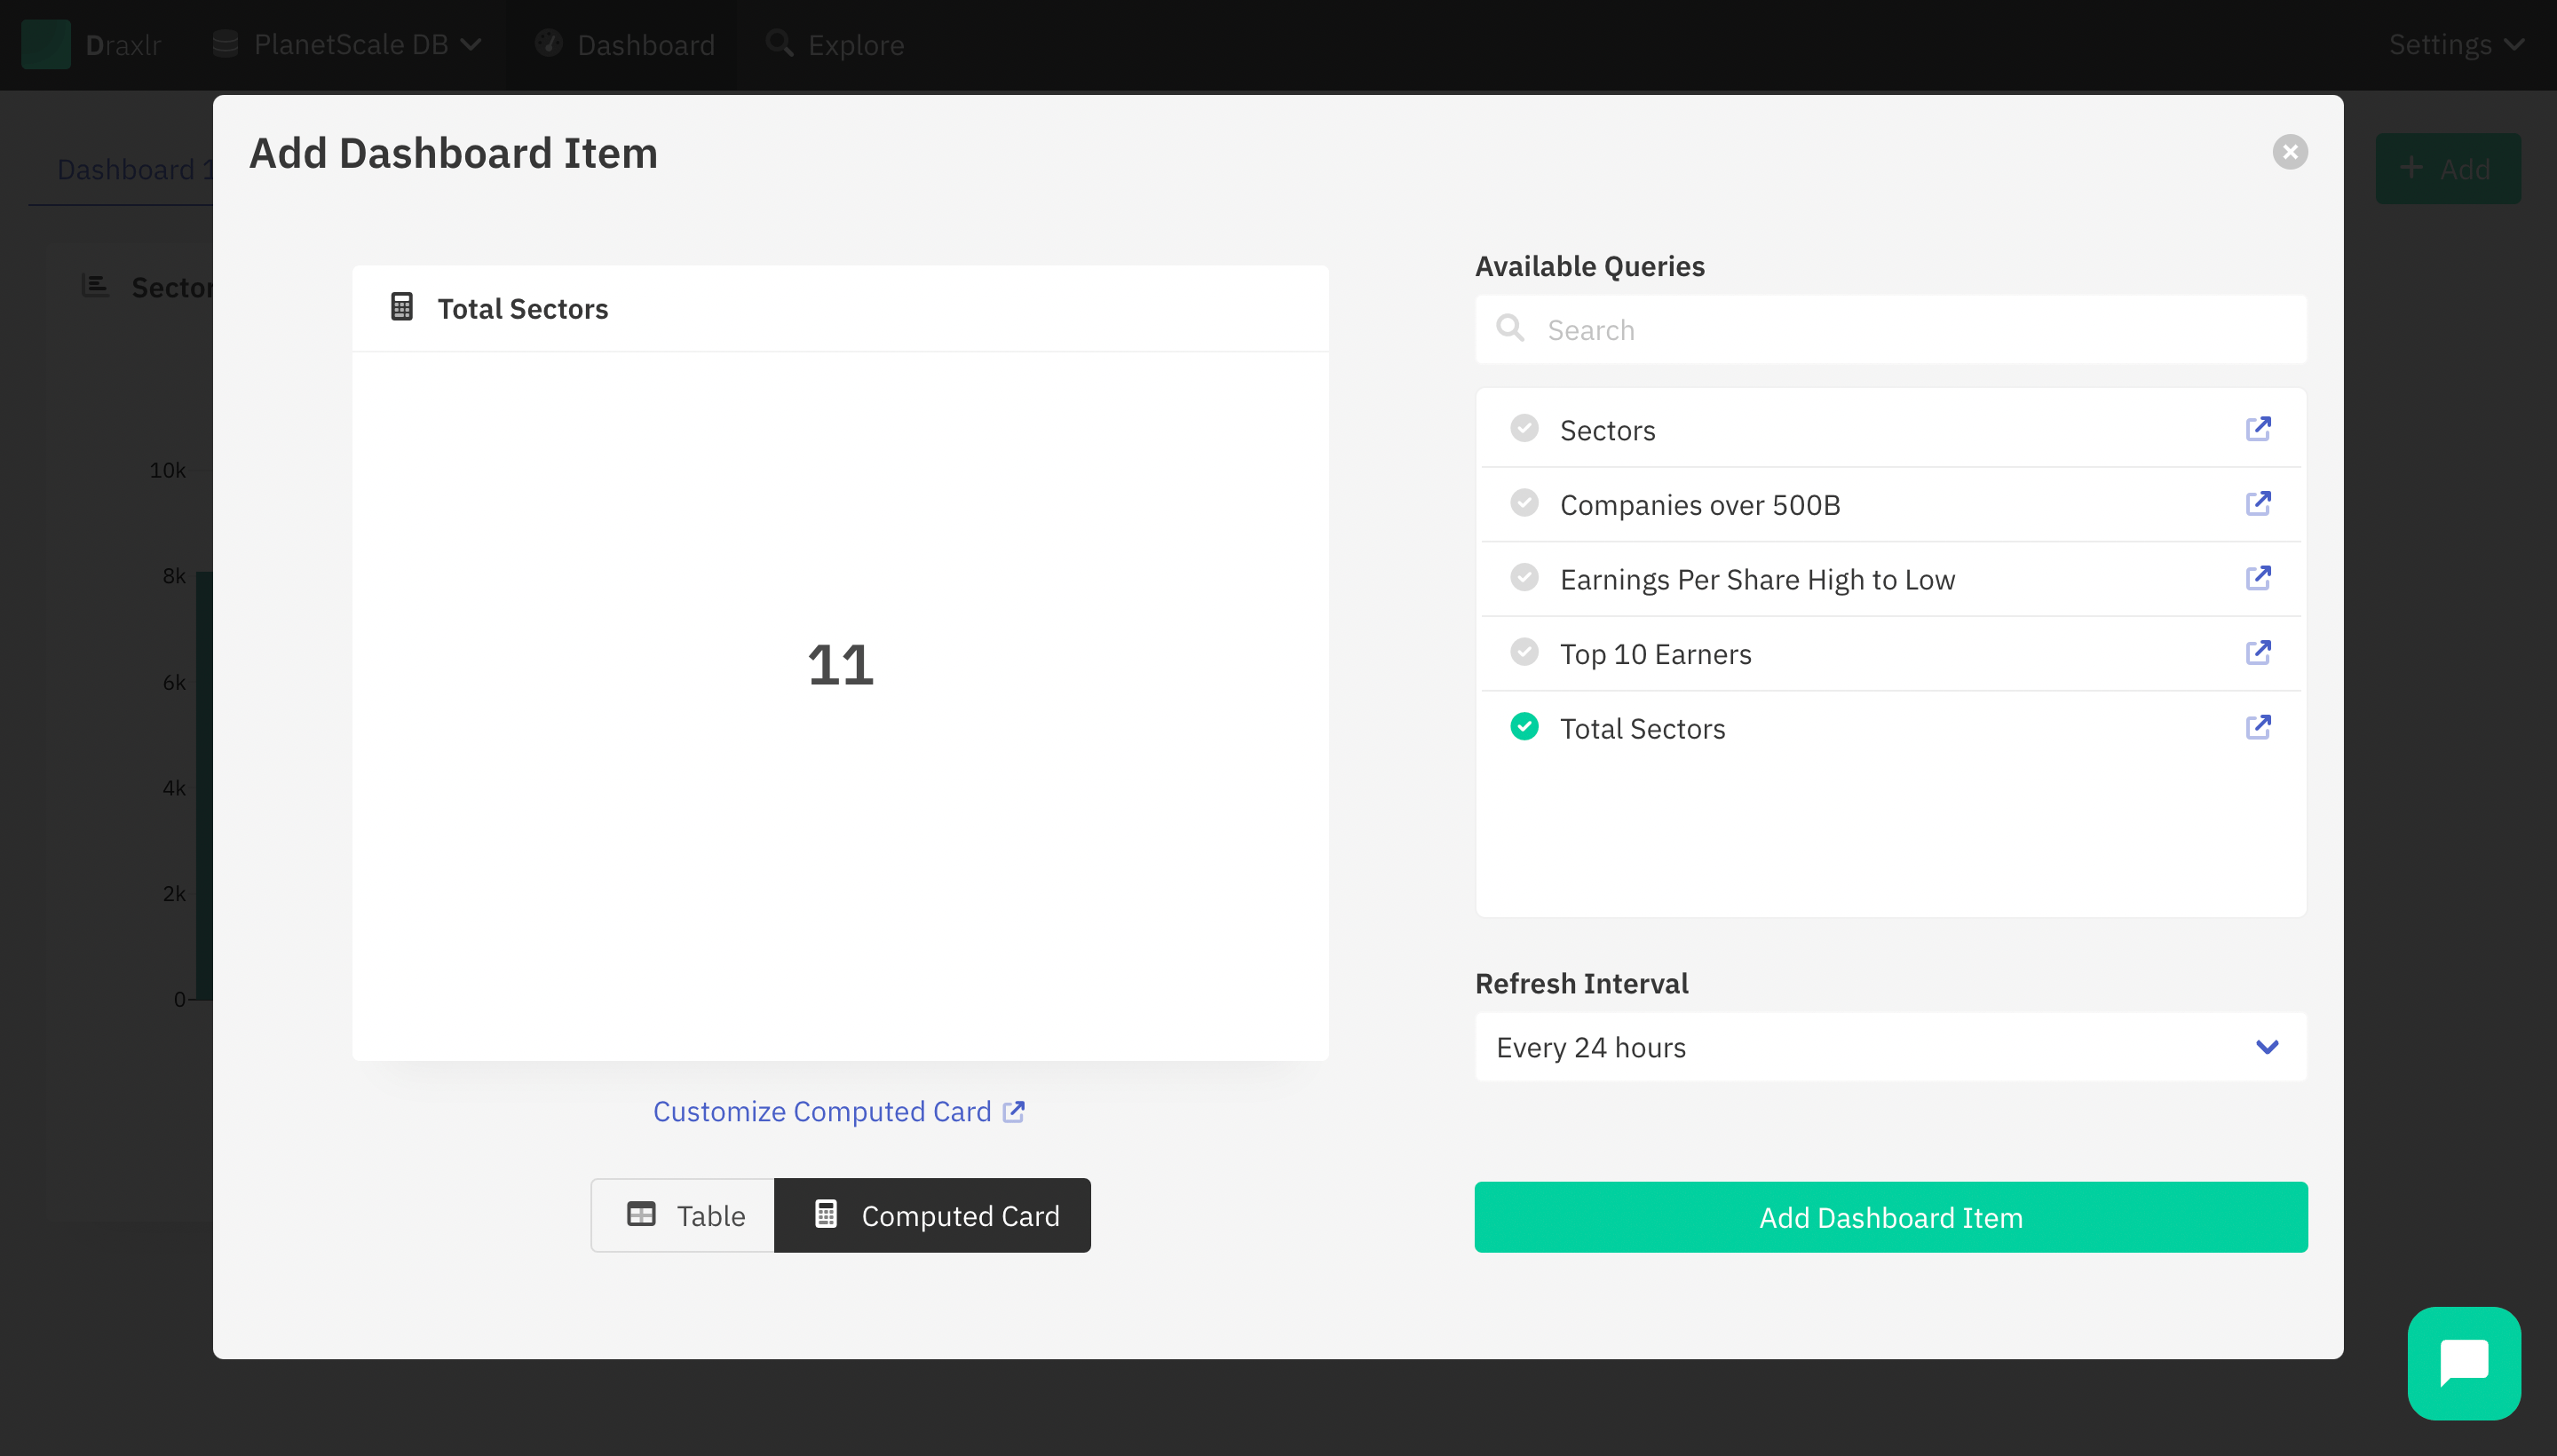
The dashboard is another major section of the app. Once you have the answers you need and have saved your queries, you can go ahead and start building your dashboard. Just head out to the dashboard section and hit the Add button. It’ll open a modal that has a list of all your queries. You can select the query you want to add to the dashboard. Select the view (table, graph, or computed card) and the refresh interval. Since these queries can be quite intensive, we only execute them and update the results at certain intervals. This makes sure your database is not overloaded. If at any point you feel like you need the latest data, you can just go and refresh it manually. Once you have selected all the options, you can click Add Dashboard Item. And it will add the item to the current dashboard.
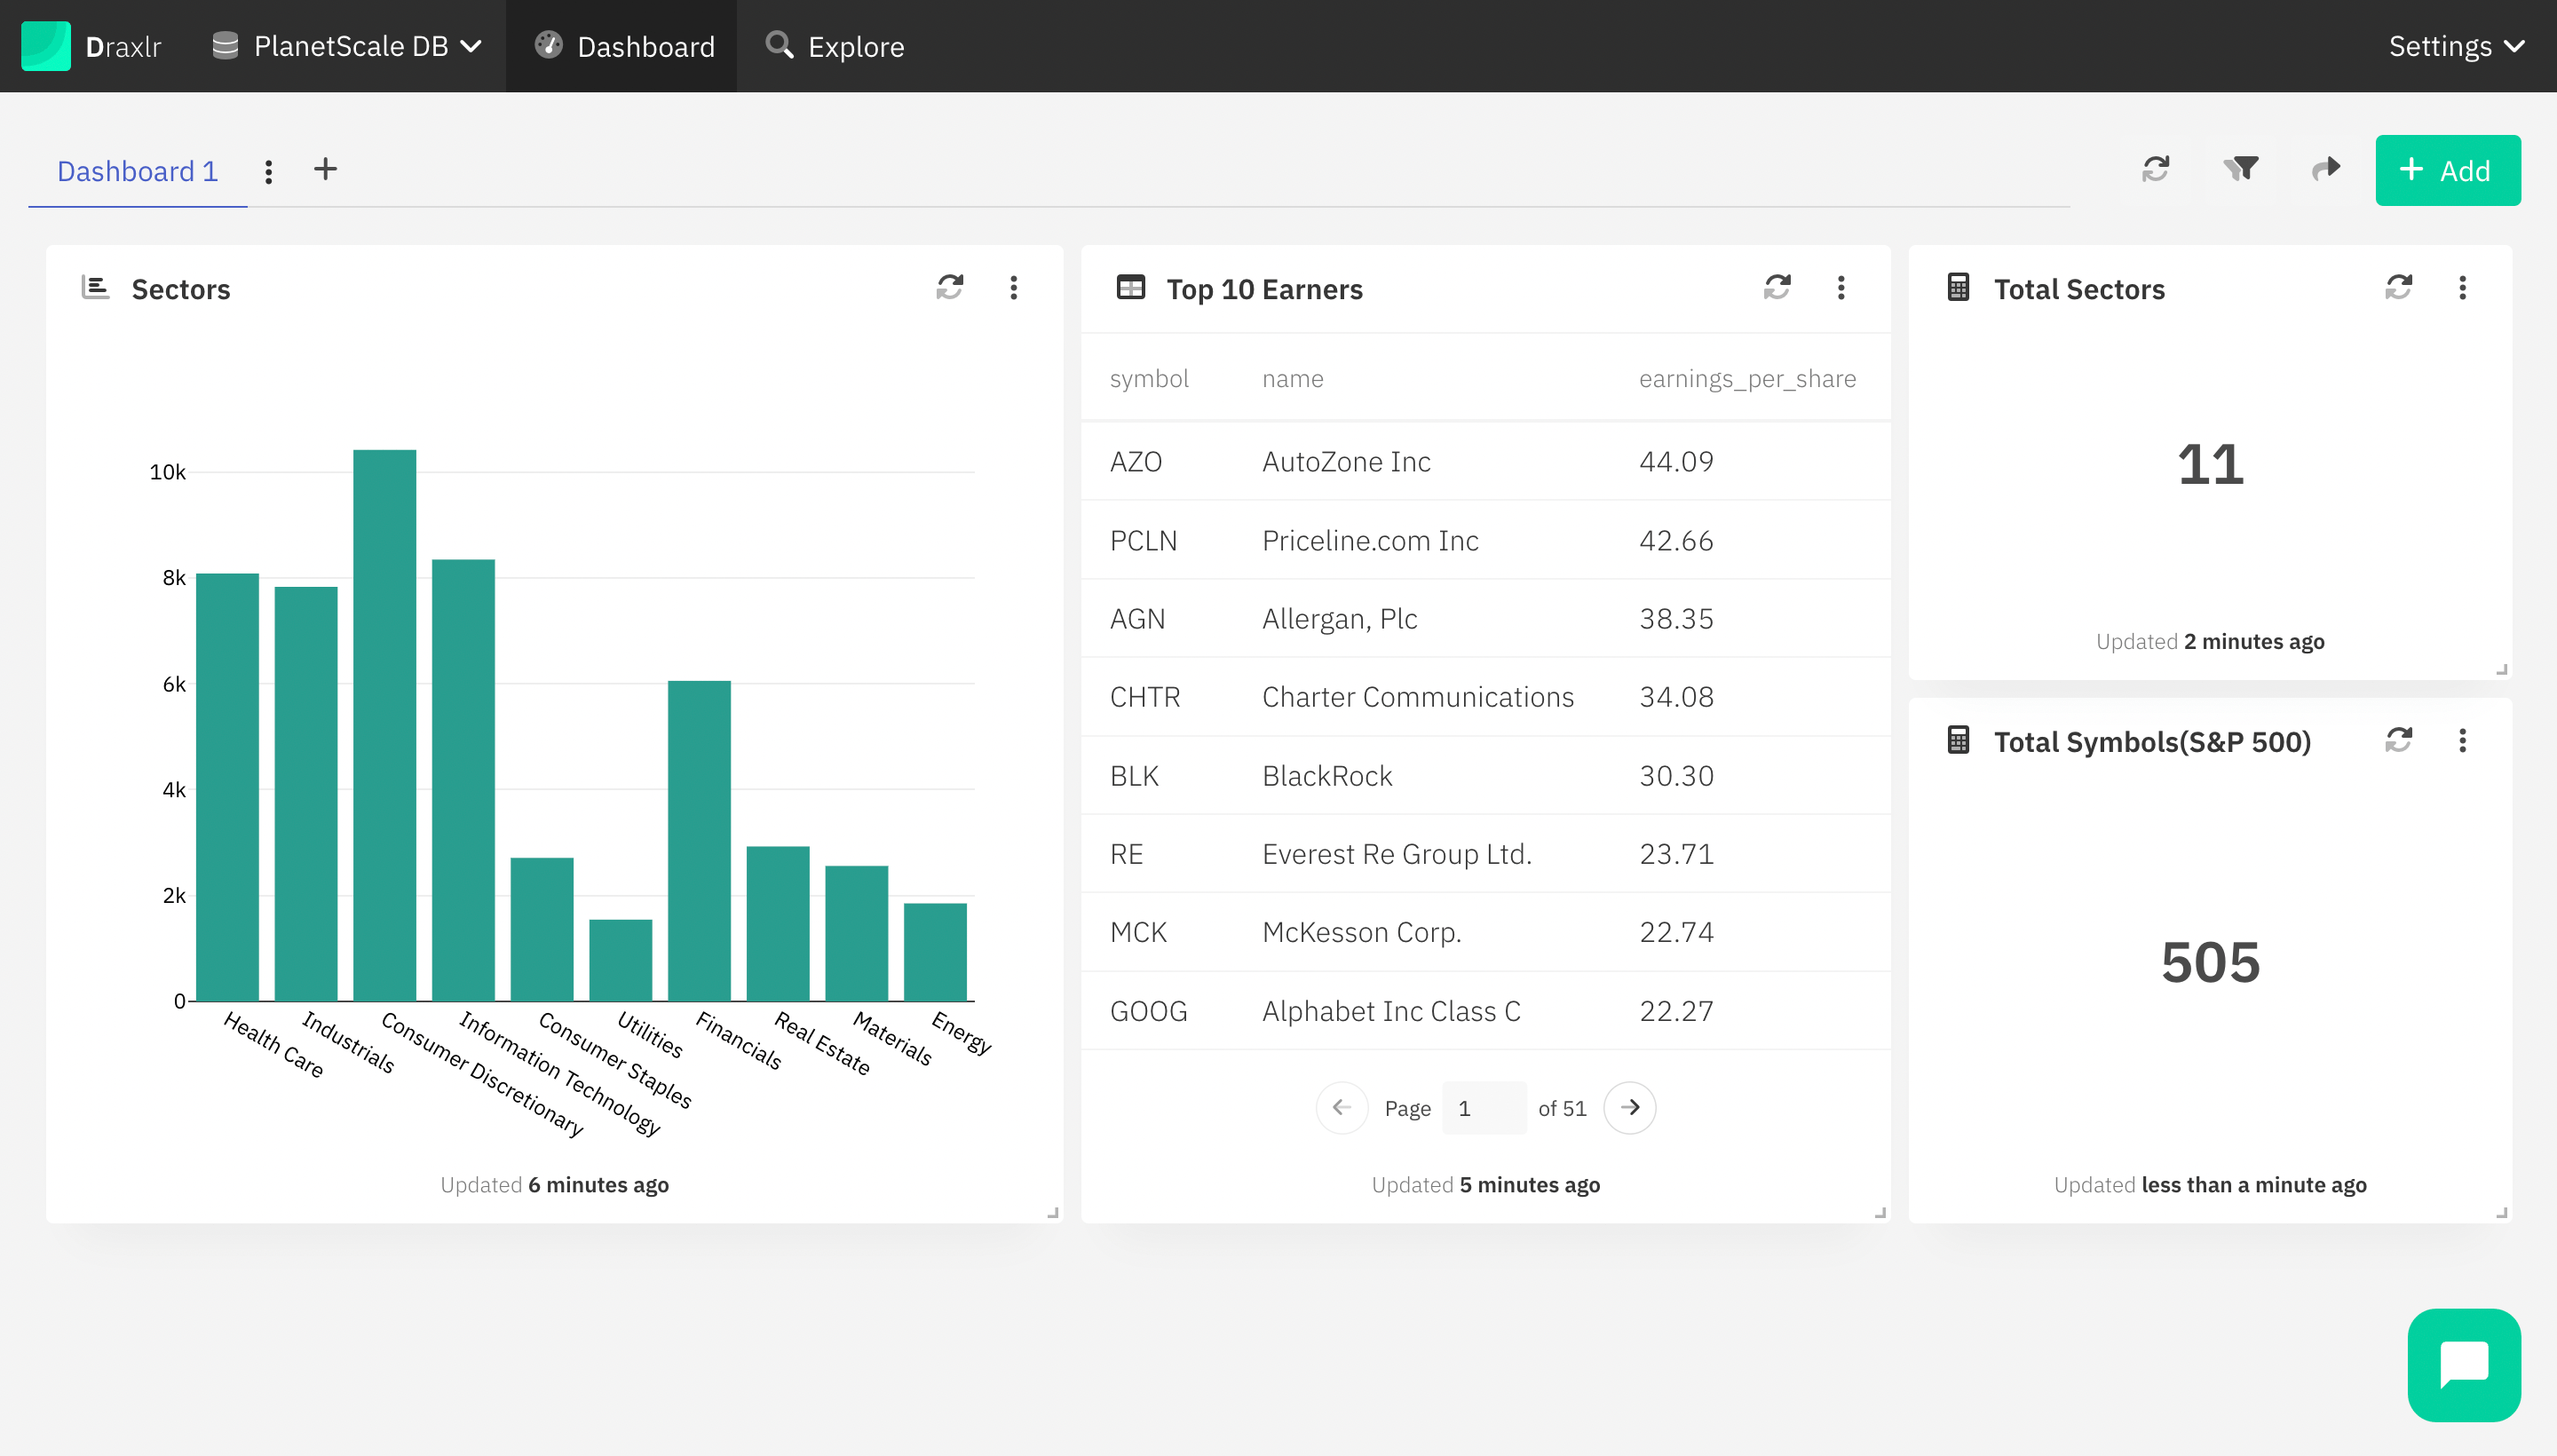
Once the item is added, you can move and resize it to customise your dashboard. Not just that, you can create multiple dashboards for different use cases. And each dashboard can be shared with a different or the same set of users. You can share your dashboard with a link (PIN protected). Or you can embed it on your website or app. The embeds are domain-protected. So that only the domains you allow can embed your dashboard.
Slack and email alerts
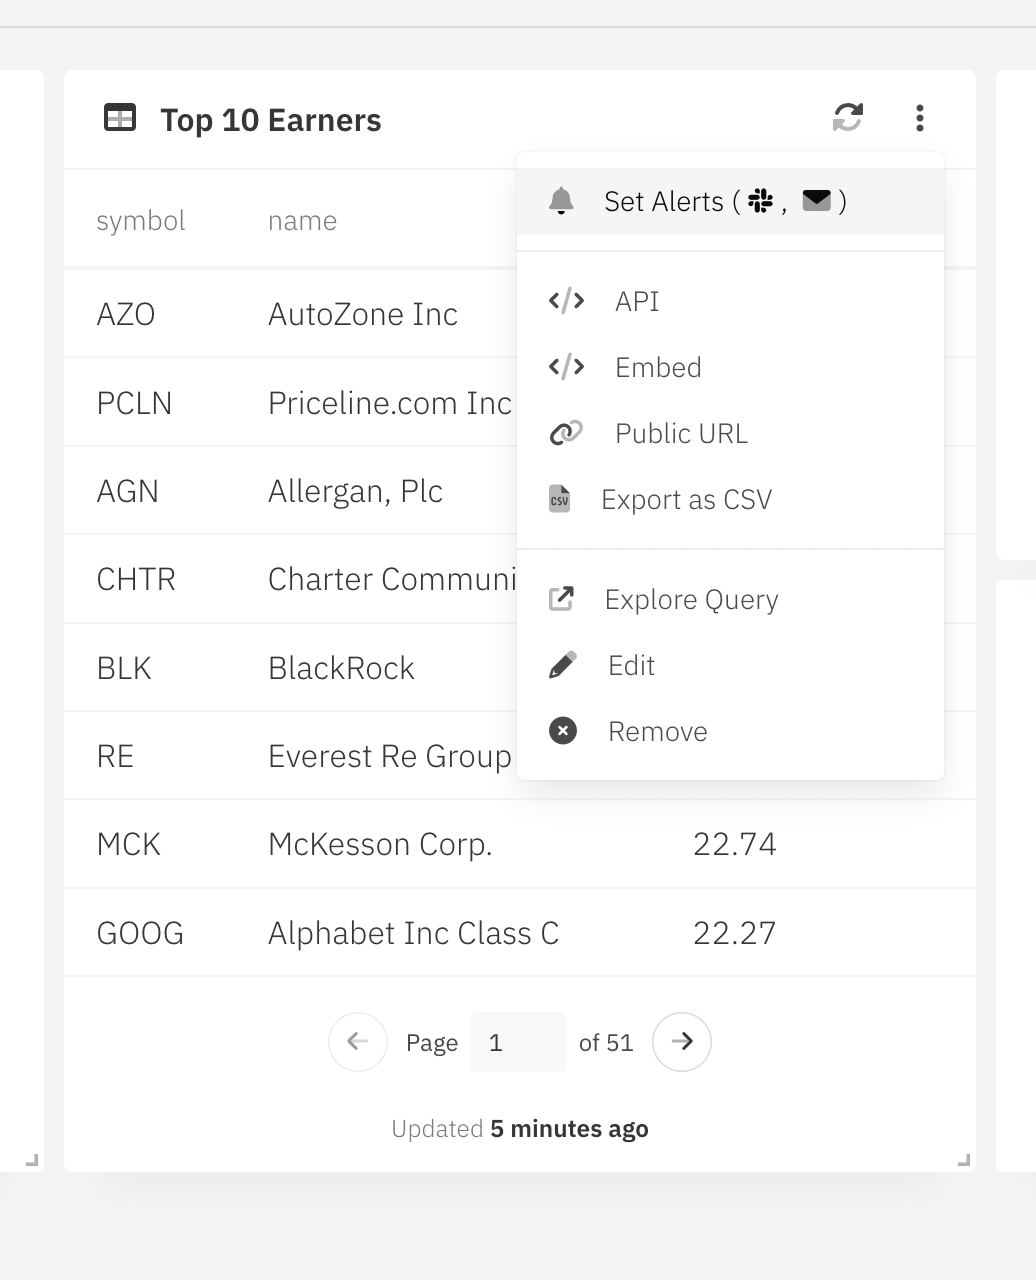
On each dashboard item, you have options to share and set up alerts. On the top right corner of each dashboard item, there is a toggle to open a menu, which has all the options for a dashboard item. You can go ahead and click on Set Alerts. Clicking on it will open a modal that has all the alert options.
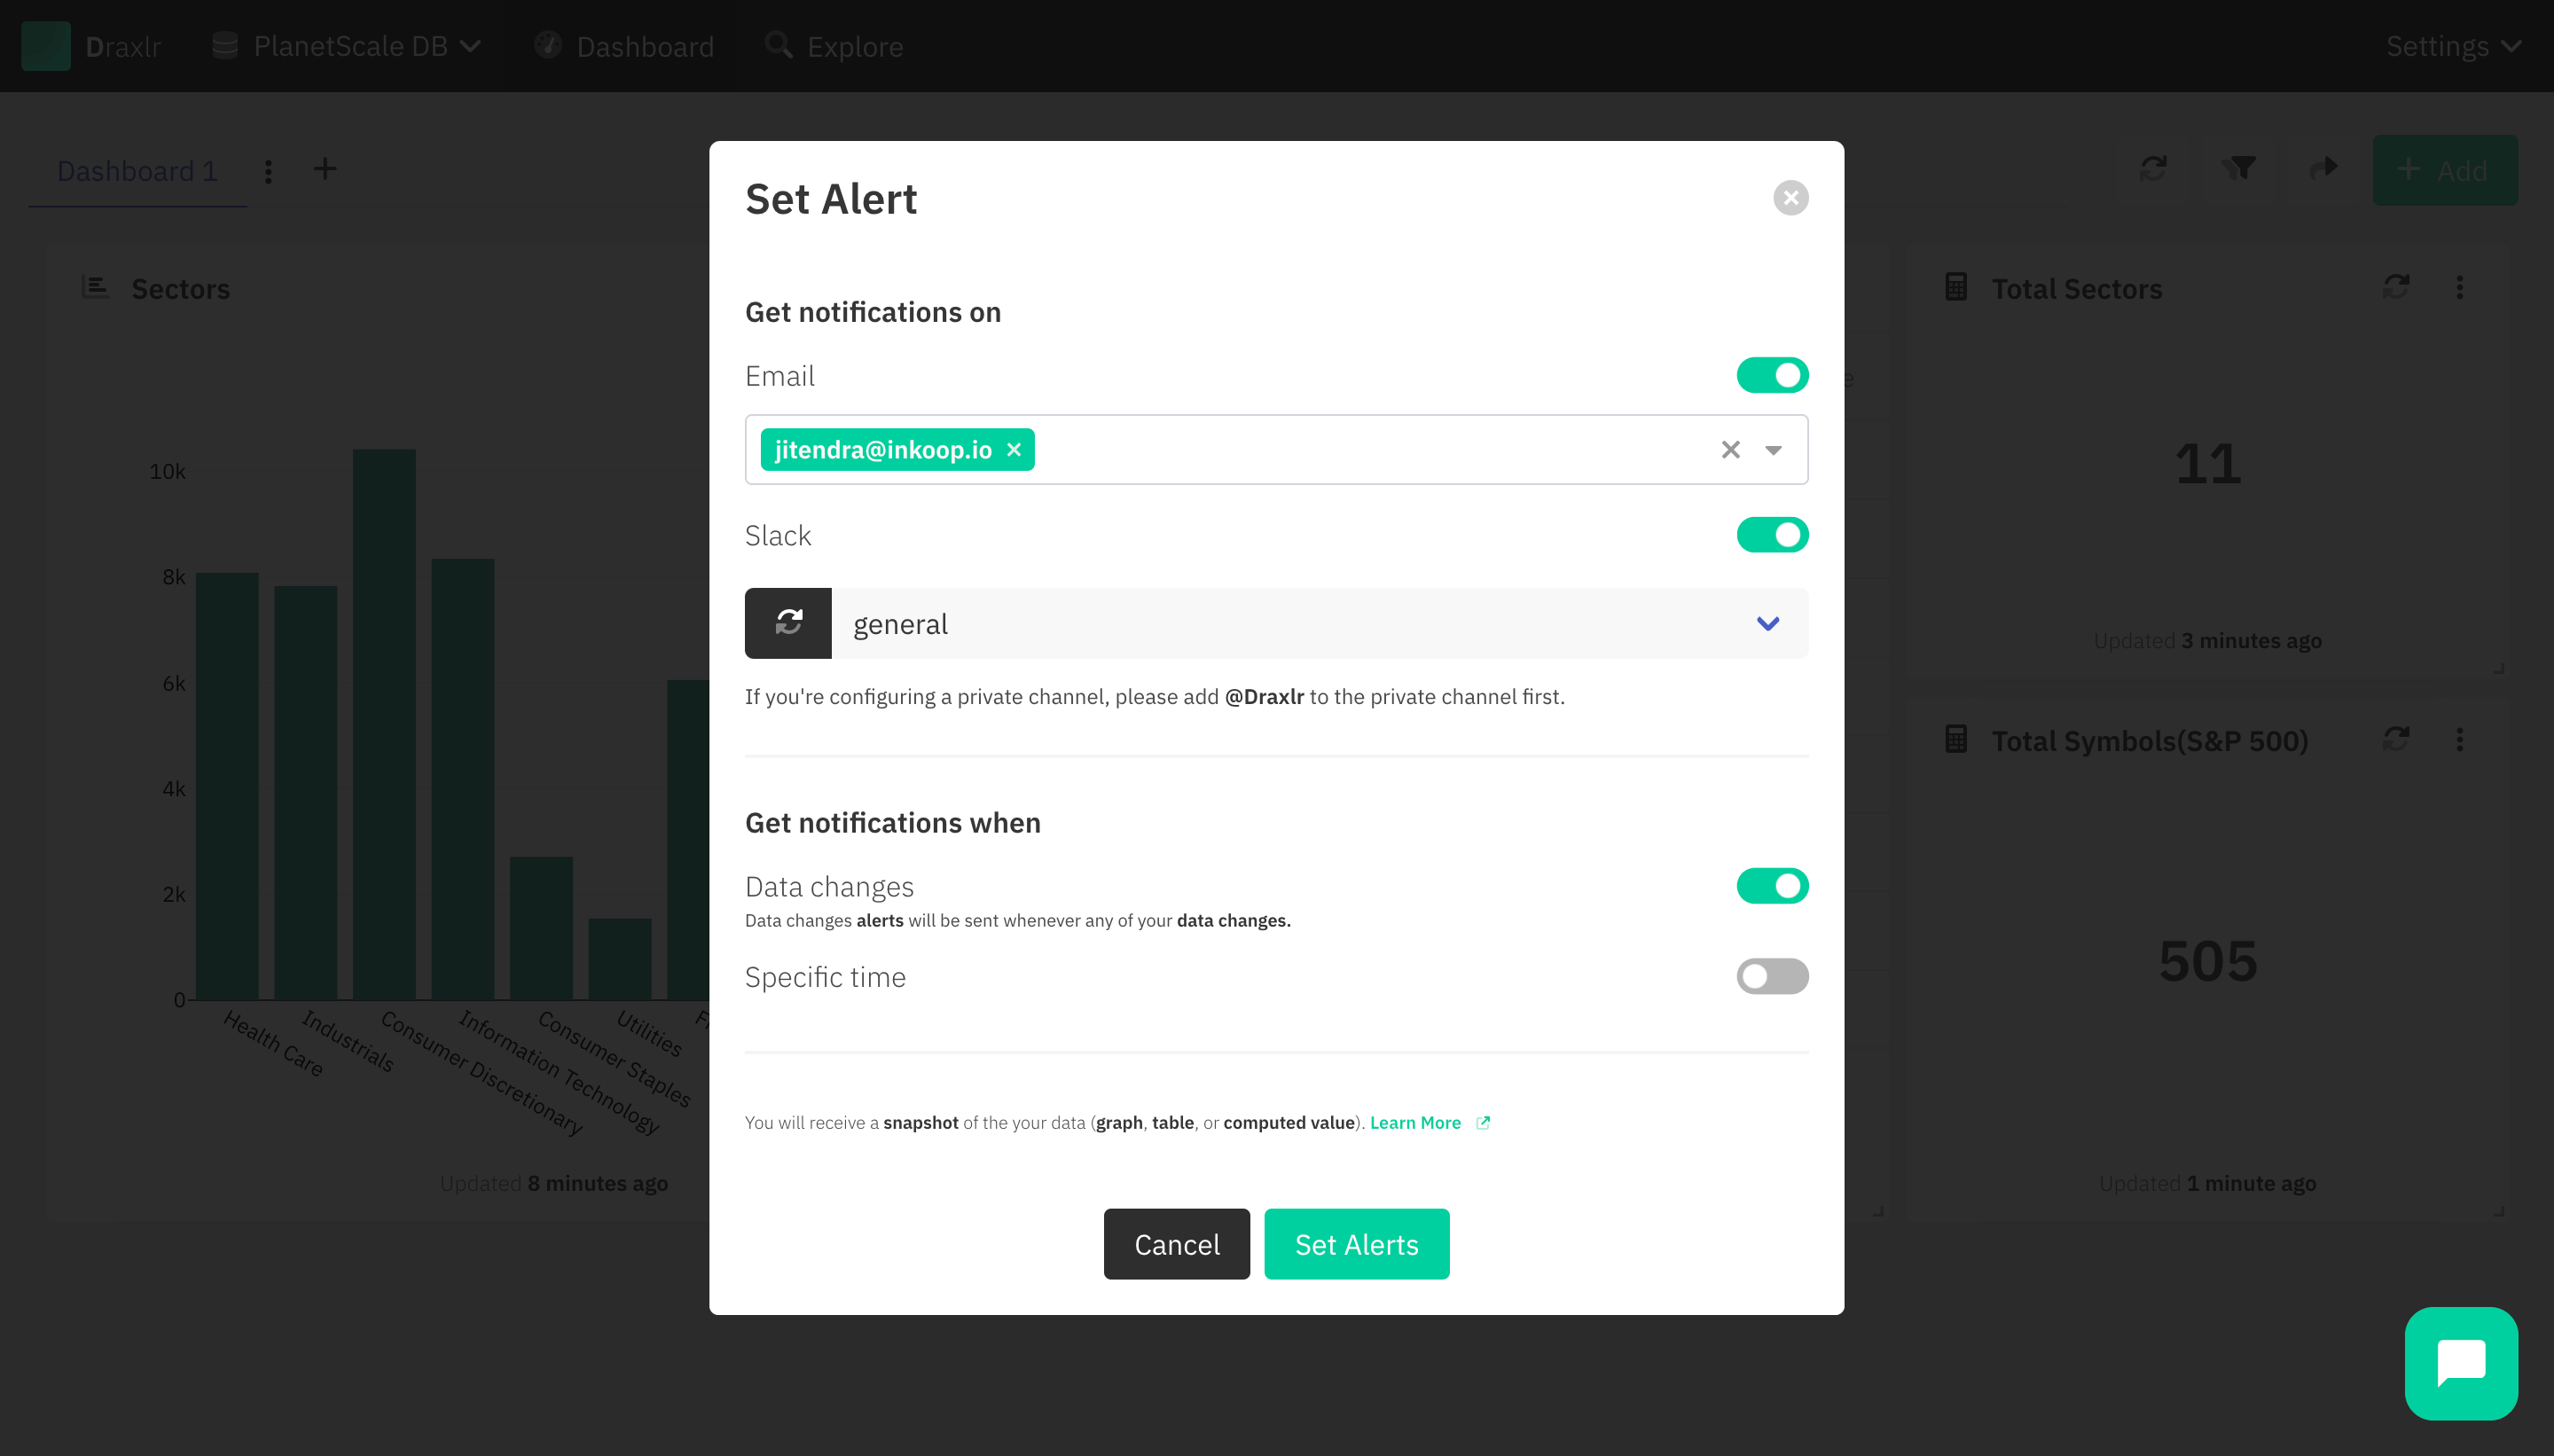
First, you have the option to choose the places you want to receive alerts. You can select the emails you want to send the updates to. It can be users that are part of the organisation, or it can be users from outside the organization. Another option is via Slack Alerts. You can select a slack channel to get updates on your dashboard item. Keep in mind that to receive updates on a private slack channel, you need to add Draxlr to that channel. If Draxlr wasn’t previously added to the channel, you can add it and refresh the list of channels on the popup (click on the refresh icon).
Second, you can select when you want to get updates. Here you again have two options. First, you have the option to get updates when any value is changed. So every time your dashboard item is refreshed, we check if the values have changed from the last time. If it has, we will send you an update. The other option is to receive the updates on specific days at a specific time. You can select the days of the week you want to get updates on and the time of the day. In this case, you can get an update on the dashboard item on the selected days at that time.
You will receive a screenshot of the dashboard item. In the case of the computed card without a target, you will receive the direct values. And in the case of a table, you will receive data in CSV format.
We are very thrilled to add the support for PlanetScale and are excited to see how you guys use it, to build your Business Intelligence dashboards and set up Alerts. If you have any doubts or need help with anything you can schedule a free call with our team to learn more on this link.