Which Data Visualization Is Used the Most in a BI Platform?
Tables are 33.2% of dashboard items built in Draxlr and bar charts 25.6%, but bar charts reach the most teams (71.5%). See every visualization type ranked.
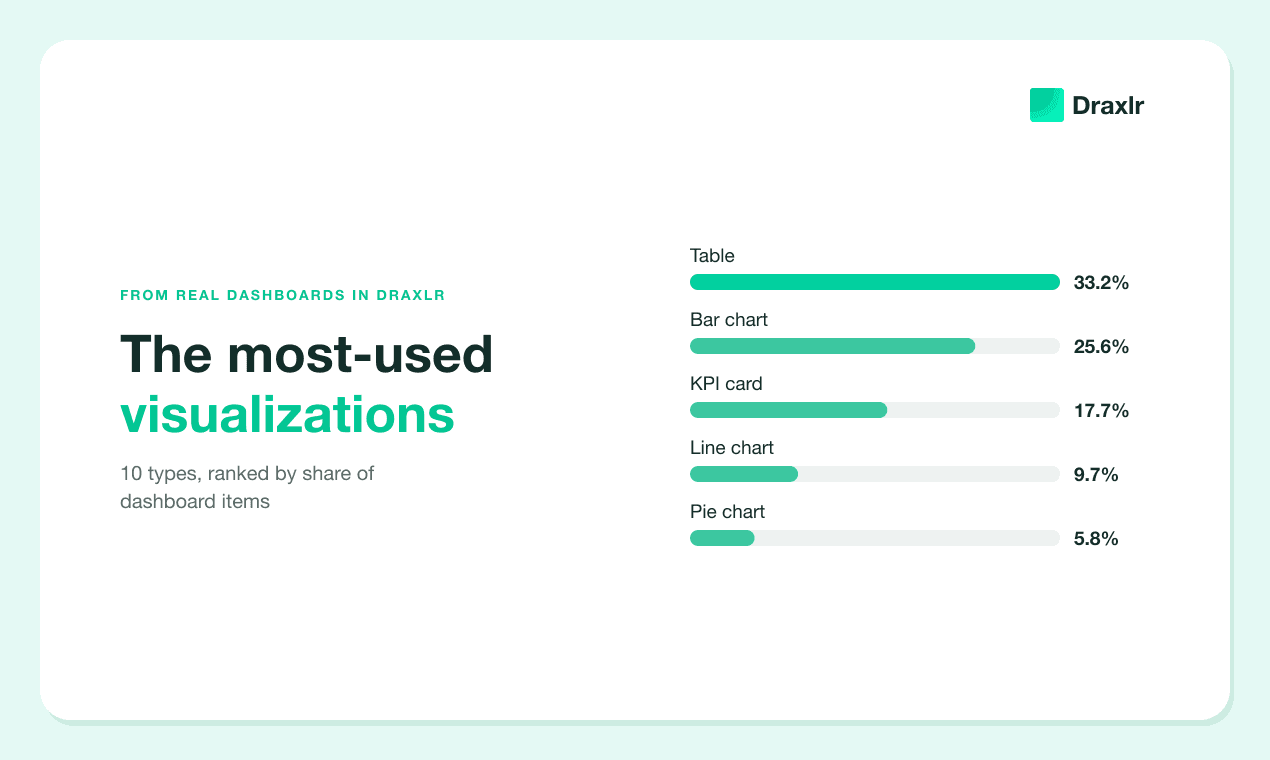
The table is the most-used data visualization in a BI platform, at least in ours. We counted the dashboard items teams have built in Draxlr, from tables to treemaps, and tables came first at 33.2% of items. The bar chart came second at 25.6%, but it's the type the most teams use: 71.5% of teams have built at least one bar chart, against 52.4% for tables.
Tables lead in Datawrapper, a charting tool for publishers, too. In 2024, tables made up 21.6% of the visualizations its users published, more than any other type (Datawrapper, "Which chart types did our users create in 2024?", 2024).
This post ranks every visualization type people put on dashboards, with real examples. It also compares what people build with what our AI builds, and covers what to offer if you're adding analytics to your own product.
Key Takeaways
- The table is the most-used visualization. Tables are 33.2% of the dashboard items built in Draxlr, ahead of bar charts (25.6%) and KPI cards (17.7%).
- Bar charts reach the most teams. 71.5% of teams have at least one bar chart, and 82.2% have at least one graph of some kind.
- Four types make up most dashboard items. Tables, bar charts, KPI cards and line charts are 86.2% of items.
- Items from AI-written queries lean to charts. Bar and line charts are 56.9% of the items whose query Draxlr's AI wrote, against 32.0% of the items people built themselves.
How We Counted
We counted the dashboard items that teams had built on their own databases in Draxlr as of November 2026. A team is one Draxlr organization, and a dashboard item is one tile on a dashboard: a table, a number, a chart. Each item counts once, by how it's displayed today. Every share in this post is a percentage of items, and the 10 shares add up to 100%.
A few rules shaped the count:
- Graphs are split by chart type. Bar, line, pie, area and doughnut charts each get their own row. The 11 chart types that are each under 1% of items are grouped as "Other graphs," and we list every one of them below.
- Both table views count as "Table." Draxlr can show a query as a plain results grid or as a formatted table. We merged the two.
- A KPI card shows one number, like total orders this month. Draxlr's docs call it a computed card.
- Some items are left out. We excluded the demo database that new accounts can explore, items on databases that were later deleted, and two record views, list and detail, which aren't part of this comparison.
We also measured team reach: the share of teams with at least one item of a given type. A few busy teams can tilt item shares, and team reach shows how widely each type is used.
The data has two limits. These are one product's users, so the mix reflects teams that connect a SQL database to a BI tool. And the mix depends on what the product offers. Pivot tables, for example, arrived in Draxlr in 2025, after the other types.
Which Data Visualization Is Used the Most?
The table is the most-used data visualization in Draxlr, at 33.2% of dashboard items. Bar charts come next at 25.6%, then KPI cards at 17.7%, line charts at 9.7% and pie charts at 5.8%. Everything else is under 2% on its own, and the 11 rarest chart types add up to 3.0%.
The top of the ranking is steep. Tables, bar charts, KPI cards and line charts add up to 86.2% of items. The bottom five types, from other graphs down to images, add up to 8.0%.
Most dashboard items, in short, are rows, bars and numbers.
Are Charts or Tables More Popular?
Charts are more popular as a group, and tables as a single type. Graphs of every kind make up 47.5% of the dashboard items in Draxlr. Tables and pivot tables make up 34.4%, KPI cards 17.7% and images 0.4%.
Inside the graph group, bar charts alone are more than half of all graphs. Bar, line and pie charts together are 86.5% of graphs, and the other 13 chart types share the remaining 13.5%.
Datawrapper reports a similar split for charts made for publishing. Its 2025 roundup said tables "may be the single most popular visualization type of 2025," with line charts second, and that line and area charts counted together take the first spot (Datawrapper, "Which chart types did our users create in 2025?", 2025).
On a dashboard, the bar chart wins instead of the line chart, at 25.6% of items against 9.7%. One likely reason: bars do double duty. They compare categories, like "Leads per owner," and they show periods, like "Installations by week."
Team Reach: Which Types the Most Teams Use
Bar charts are the most widely used visualization: 71.5% of teams in Draxlr have built at least one. Tables reach 52.4% of teams, line charts 34.1% and KPI cards 27.4%. Counting every chart type, 82.2% of teams have at least one graph on a dashboard.
Set this next to the item shares and two patterns appear. Charts are spread wide: bar charts are 25.6% of items but reach 71.5% of teams. Tables and KPI cards are built in bulk: tables are 33.2% of items and reach 52.4% of teams, while KPI cards are 17.7% of items and reach 27.4%.
Most teams, about seven in ten, make at least one bar chart. The teams that use tables and KPI cards tend to make a lot of them.
The long tail matters more than its item share suggests. Other graphs are only 3.0% of items, but 12.7% of teams use at least one, about one team in eight.
Every Visualization Type, With Real Examples
Each type follows in order of item share, with its team reach. The examples are real dashboard item names, one per team. We cleaned them up: typos are fixed, product and company names are removed, and translations are marked.
1. Table (33.2% of items, 52.4% of teams)
Tables hold the rows people act on: customer lists, lookups and counts laid out in columns.
- "Biggest customers by ARR"
- "Number of clients by month"
- "Signup growth, year over year"
- "Look up students by teacher email"
- "Active hotel partners with their contacts" (translated from German)
- "Lost dispute costs"
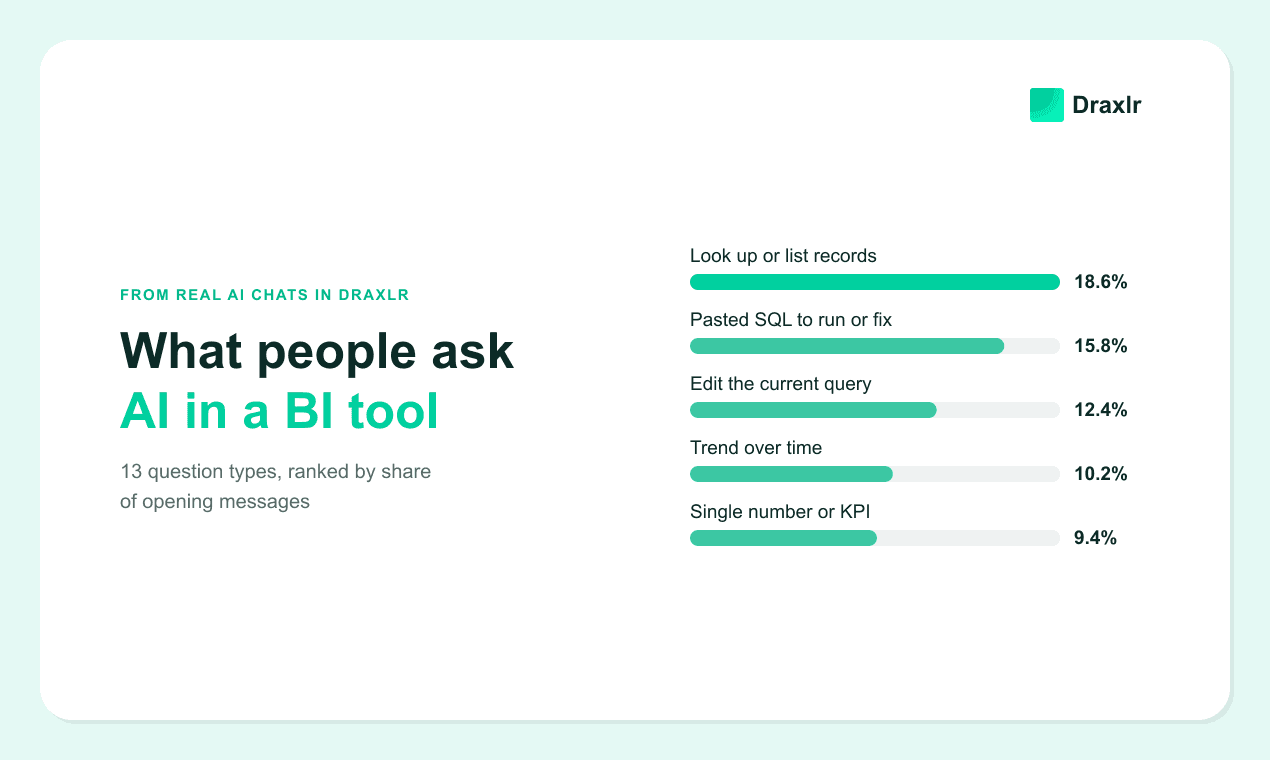
A chart can't answer "which students?" A table can, and you can sort it, export it or work down the list. Looking up records was also the most common opening request in what people ask AI in a BI tool, at 18.6% of opening messages.
2. Bar chart (25.6% of items, 71.5% of teams)
The bar chart is the chart the most teams use, and it covers both comparisons and periods.
- "Revenue, last 3 months"
- "Leads per owner" (translated from German)
- "Signups by email domain"
- "Signups by subscription type, year over year"
- "Installations by week"
Bars are easy to read for a reason, which we cover in the section on choosing a visualization.
3. KPI card (17.7% of items, 27.4% of teams)
A KPI card shows one number, big. Teams that use them tend to build several.
- "Active users"
- "Total income"
- "Events happening this month"
- "Total products created"
- "Percentage of workspaces using content requests"
- "Number of projects with a reuse plan" (translated from French)
The clearest of these name their time window, like "this month." Without one, readers have to guess what period the number covers. Our guide to monitoring KPIs with a SQL dashboard covers which numbers to track.
4. Line chart (9.7% of items, 34.1% of teams)
Line charts show change over time, usually with a fixed window.
- "Viral coefficient, weekly"
- "Event cancellation %, last 24 months"
- "Week 1 retention, last 25 days"
- "Orders and appointments over time"
- "Feature usage per workspace during the subscription"
Line charts reach 34.1% of teams, more than KPI cards do, but they're only 9.7% of items. Teams that use line charts tend to keep just a few.
5. Pie chart (5.8% of items, 24.3% of teams)
Pie charts split a whole into parts.
- "Current events by genre"
- "Sales by terminal profile"
- "Where new workspaces came from"
- "Overall campaign impressions"
- "Invoices by age"
- "Projects by ambition level" (translated from French)
Pies work best with a handful of slices. "Invoices by age" fits: a few age buckets that add up to a whole.
6. Other graphs (3.0% of items, 12.7% of teams)
Eleven chart types are each under 1% of dashboard items. Here they all are, with an example of each:
| Chart type | Share of items | Example |
|---|---|---|
| Bar and line combo | 0.9% | "Revenue per week" (translated from German) |
| Map | 0.6% | "Customers by zip code" |
| Radar | 0.5% | "Returns by product category" (translated from German) |
| Scatter | 0.3% | "How does size affect price?" (translated from Spanish) |
| Treemap | 0.2% | "Locations by state and city" (translated from Portuguese) |
| Funnel | 0.2% | "Workspace funnel" |
| Polar area | 0.2% | "Sales by hour" |
| Bubble | 0.1% | "Manufacturer utilization" |
| Sankey | Under 0.1% | "Sankey path" |
| Venn | Under 0.1% | "Share of reach" |
| Calendar | Under 0.1% | "Reservations by month and week" |
The bar and line combo leads the group. It's the usual way to put two measures with different scales on one chart, like revenue and order count. Draxlr also offers box-and-whisker plots, for showing spread and outliers.
Rare doesn't mean wrong. A funnel is the right picture for a sign-up funnel, and a map is the right picture for zip codes. These types answer narrower questions, so fewer items need them.
7. Area chart (1.9% of items, 6.3% of teams)
An area chart is a line chart with the space underneath filled in. It's often used to show volume over time.
- "Event creation, last 60 days"
- "Incremental reach by day"
- "Approval rating by year"
- "Average mood per workspace"
- "Approved validations by hour"
8. Doughnut chart (1.5% of items, 8.3% of teams)
A doughnut is a pie chart with a hole in the middle.
- "Recurring vs non-recurring"
- "In-progress projects by type"
- "Feature engagement distribution"
- "Interactions by device type"
- "Approved validations by sales tool"
The hole doesn't make it harder to read. In a 2016 study published in Computer Graphics Forum, Drew Skau and Robert Kosara found doughnut (donut) charts as accurate as pie charts. Angle turned out to be the least important visual cue in both (Skau and Kosara, "Arcs, Angles, or Areas", 2016).
9. Pivot table (1.2% of items, 3.8% of teams)
A pivot table splits one measure by two groupings at once, such as months across the top and locations down the side.
- "Receivables outstanding vs upcoming revenue"
- "Net revenue per month by location, updated weekly" (translated from German)
- "Service tickets by month and status" (translated from German)
- "Survey responses with follow-ups, by member"
- "Summary by assignor" (translated from Spanish)
Pivot tables are newer in Draxlr than the other types. So far in 2026, they've made up 1.9% of new dashboard items. See how to create a pivot table from SQL data for a walkthrough.
10. Image (0.4% of items, 1.1% of teams)
Images are mostly company logos placed at the top of a dashboard, plus the odd screenshot. They don't show data, but they make a shared dashboard look like the company's own. We haven't listed examples, since most are logos.
Do People and AI Pick the Same Visualizations?
Not quite. Draxlr's AI wrote the query behind 13.3% of dashboard items, through AI chat or AI dashboard generation. Bar and line charts make up 56.9% of those items. In items people built themselves, bar and line charts are 32.0%, and tables lead at 35.5%.
Each item is counted by how it's displayed today, including any change someone made after the AI wrote the query. Tables show the biggest gap: they're 35.5% of the items people built and 18.2% of the items from AI-written queries. Bar and line charts go the other way. Bars rise from 23.7% to 37.8%, and lines from 8.3% to 19.1%. KPI cards are close in both groups.
We didn't sort the prompts behind these items, so we can't say for sure why. One likely reason is the request itself. When people build a dashboard from one prompt, they tend to list trends and breakdowns, like monthly revenue or signups by plan, and those come back as charts. A table is what you build when you need the rows: which customer to call, which order to fix.
One small difference made us smile. Items from AI-written queries are doughnuts more often than pies, 4.7% against 2.5%. People pick pies more than six times as often as doughnuts, 6.3% against 1.0%.
You can change any item's display without touching its query, so an AI-built chart becomes a table the moment you need the rows.
How Should You Choose a Visualization for a Dashboard Item?
Start from the question the item answers. Lookups need a table, single numbers a KPI card, comparisons a bar chart, and change over time a line chart. Those four types cover most of the items in our data.
| The question | Use | Example from our data |
|---|---|---|
| Which records? | Table | "Biggest customers by ARR" |
| How many, right now? | KPI card | "Events happening this month" |
| Which category is bigger? | Bar chart | "Leads per owner" |
| How has it changed? | Line chart, or area chart for volume | "Viral coefficient, weekly" |
| What share of the whole? | Pie or doughnut chart, with few slices | "Where new workspaces came from" |
| Split by two things at once? | Pivot table | "Service tickets by month and status" |
| Where, or at which step? | Map or funnel | "Customers by zip code," "Workspace funnel" |
When you're torn between a bar chart and a pie chart, pick the bar. In a 2010 replication of Cleveland and McGill's classic graphical perception study, Jeffrey Heer and Michael Bostock found that people judge angles and areas, as in a pie chart, significantly less accurately than positions along a common scale, as in a bar chart (Heer and Bostock, "Crowdsourcing Graphical Perception," CHI 2010).
Pies still earn their place for a simple part-of-a-whole with a few slices. Past five or six slices, a sorted bar chart is easier to read.
Name the item with the measure, the grouping and the time window, too. "Signups by email domain, last 30 days" tells a reader what they're looking at before they read a single bar.
What Should You Offer When You Add Analytics to Your Product?
Offer great tables first. In our data, tables are 33.2% of dashboard items, more than any chart type. Your customers' mix will differ from ours, but a product that does tables, bar charts, KPI cards and line charts well covers most of what people build.
It plays out like this in a product meeting.
Jared: A customer asked for a radar chart.
Gilfoyle: Just one?
Jared: Just one. Everyone else asked for a table they can sort.
You can plan for both:
- Make tables first-class. Sorting, formatting, totals and export are what make a table useful.
- Get KPI cards right. Give the number a label people understand and, where it helps, a comparison with the previous period.
- Keep bar and line charts quick to build. Together they're 35.3% of items.
- Offer the long tail, but don't lead with it. Other graphs are 3.0% of items, yet 12.7% of teams use one. Maps and funnels answer specific questions well: where, and at which step.
- Let customers switch the display. The same query might work as a table today and a bar chart next week.
In Draxlr, Full App Embedding gives each of your customers an analytics workspace inside your product. Next to the dashboards you share, they can build their own tables, pivot tables, KPI cards and charts with a query builder, a SQL editor and the AI assistant. It's on the Power plan ($250/month) and above. Our guide to letting customers build their own dashboards walks through the setup.
Build Your Own Dashboard Items in Draxlr
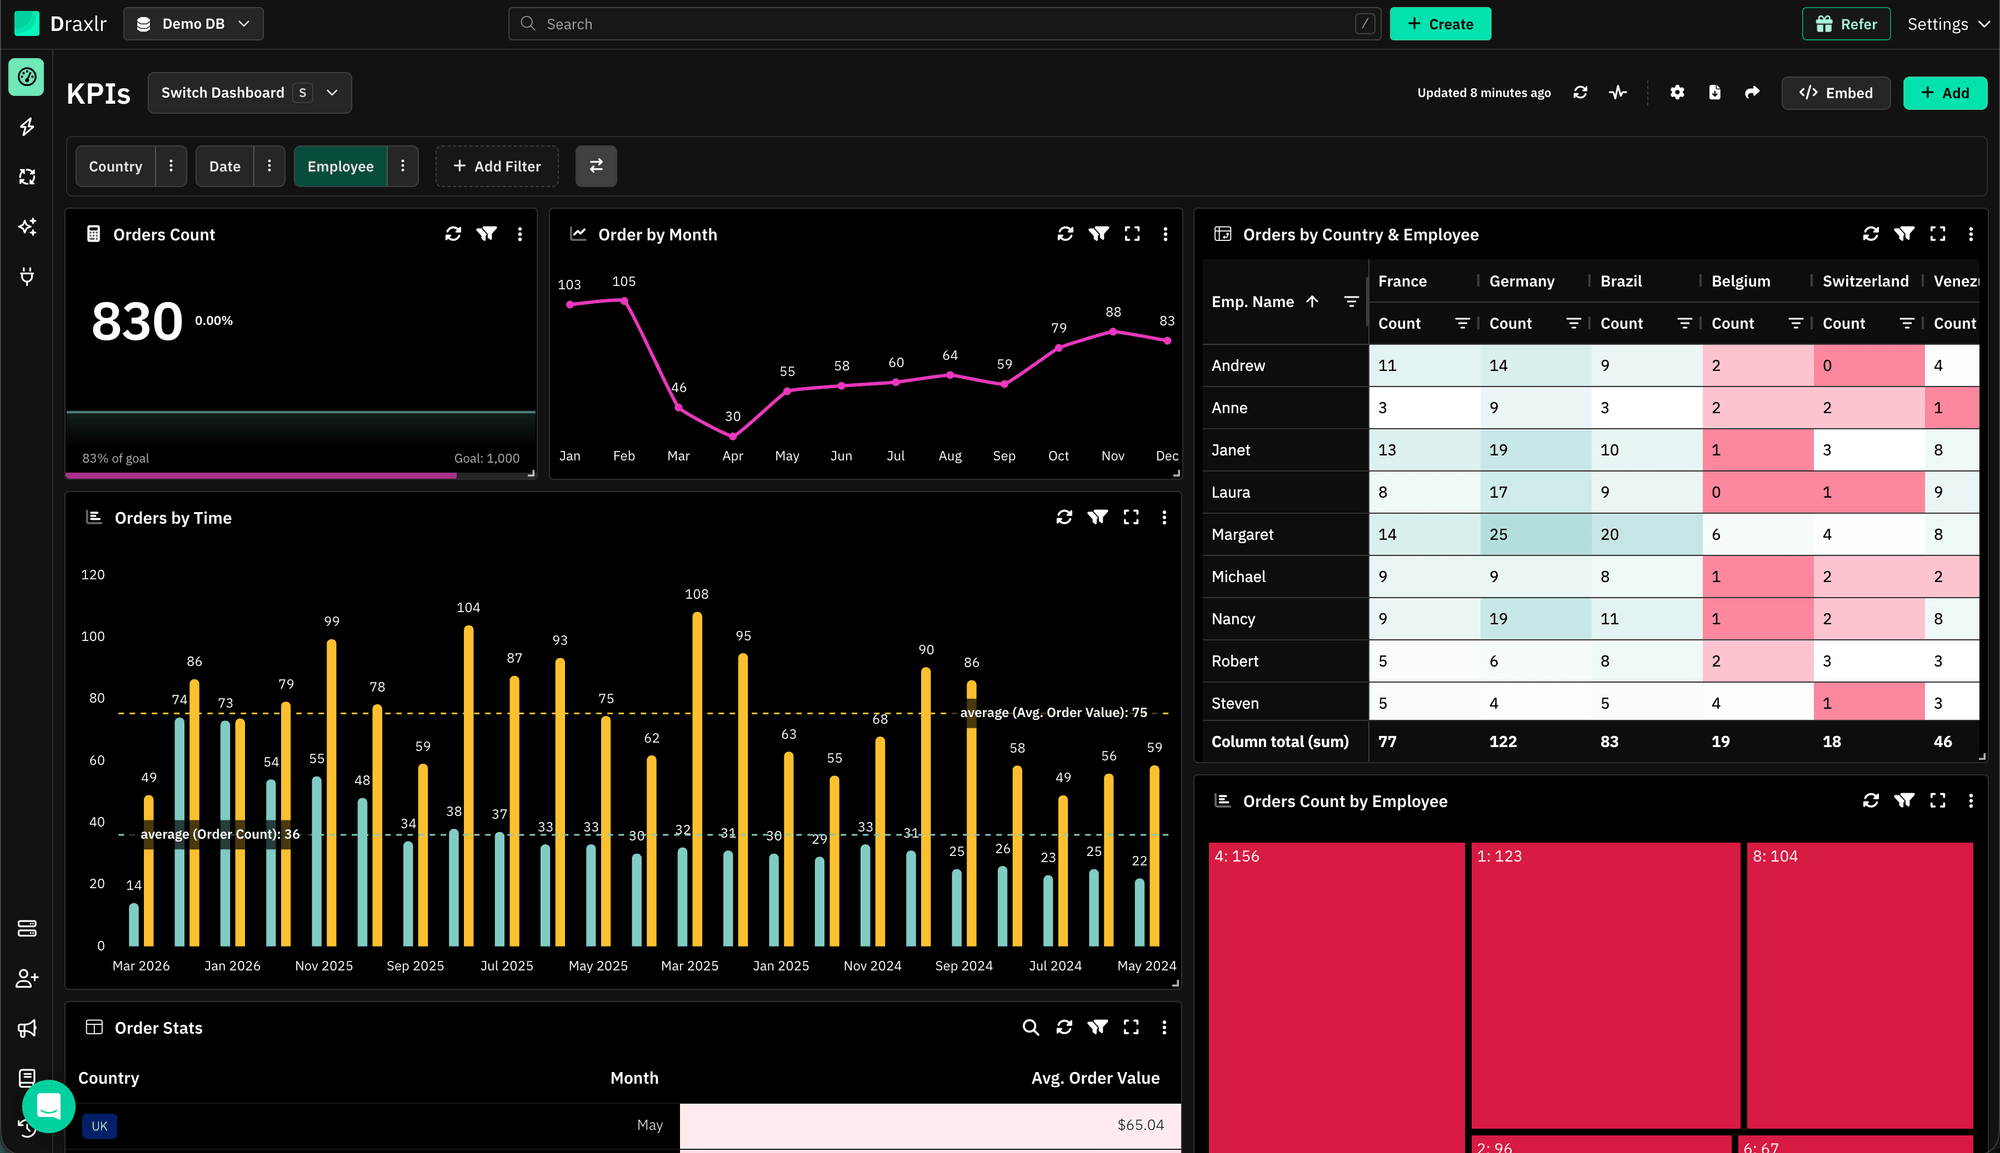
Draxlr connects to your SQL database, such as PostgreSQL, MySQL or SQL Server. Any query can become a table, a KPI card, a pivot table or one of 17 chart types (the 16 above plus box-and-whisker plots), and you can change the display later without rewriting the query. See how dashboards work on the dashboard feature page, or follow our guide to SQL data visualization.
Every new account starts with a 7-day free trial, and no credit card is required.
Connect your DatabaseFAQs
1. What is the most used data visualization in a BI platform?
In Draxlr, the table is the most-used visualization, at 33.2% of dashboard items. Bar charts are second at 25.6%, and KPI cards third at 17.7%. Bar charts reach the most teams, though: 71.5% of teams have built at least one, against 52.4% for tables.
2. Are bar charts better than pie charts on a dashboard?
Usually, yes. People read positions along a scale more accurately than angles or areas, as a 2010 CHI study by Heer and Bostock confirmed. In Draxlr, bar charts are also far more common: 25.6% of dashboard items, against 5.8% for pie charts. Pies suit a simple part-of-a-whole with few slices.
3. When should you use a table instead of a chart?
Use a table when people need the records themselves: which customers, which orders, which students. Tables are 33.2% of dashboard items in Draxlr, more than any chart type. Use a chart when the shape matters more than the rows, such as a trend over time or a comparison across categories.
4. What is a KPI card on a dashboard?
A KPI card shows a single number, such as active users or total income this month. Draxlr calls it a computed card. KPI cards are 17.7% of dashboard items in Draxlr, and 27.4% of teams use them. The clearest ones name their time window, like "this month."
5. Which chart types are rarely used in dashboards?
In Draxlr, 11 chart types are each under 1% of dashboard items: bar and line combo, map, radar, scatter, treemap, funnel, polar area, bubble, sankey, venn and calendar. Together they're 3.0% of items. Still, 12.7% of teams use at least one, for questions like where (maps) or at which step (funnels).
About the author

Vivek is a coder and the founder of Draxlr who cares deeply about building good products. He works at the intersection of AI, SQL, dashboards, and embedded analytics, with a strong focus on making complex data workflows feel simple, useful, and fast for real teams.
If you have questions about anything in this guide, or want to compare options for your specific stack, you can email Vivek at vivek@draxlr.com, try Draxlr free, or reach out directly through the Draxlr team.