What Is Embedded Analytics? A Guide for SaaS Teams
Learn what embedded analytics is, how it works for SaaS teams, what it costs, what to look for in a tool, and the common mistakes to avoid when you ship it.
There are two kinds of SaaS products. Those that show customers their data, and those that make customers go find it somewhere else. The first kind retains better, charges more, and wins more deals. Embedded analytics is what separates them.
This guide covers what embedded analytics actually is, why it matters for SaaS specifically, how it works technically, what to look for in an embedded analytics tool, and how Draxlr makes it easy to ship without building from scratch.
What Is Embedded Analytics
Embedded analytics is the practice of integrating data visualizations, dashboards, reports, and analytics features directly into a software application. Instead of pointing users toward a separate BI tool or a standalone reporting platform, the analytics experience lives inside your product.
When a customer logs into your SaaS product and sees a dashboard showing their usage, revenue trends, or performance metrics without ever leaving the app, that is embedded analytics working correctly.
The word "embedded" is doing real work here. It does not just mean an element dropped onto a page. It means the analytics experience is integrated into the user journey, uses the product's authentication and access model, respects the user's data permissions, and matches the look and feel of the rest of the product.
For SaaS teams specifically, embedded analytics solves a problem that general BI tools were never designed to address. A SaaS product serves dozens, hundreds, or thousands of customers, each of whom needs to see their own data. General BI tools are built for internal teams analyzing a single dataset. Embedded analytics tools for SaaS are built for multi-tenant products serving many customers simultaneously.
Embedded Analytics vs Traditional Business Intelligence
Traditional BI platforms like Tableau, Looker, and Power BI were designed for internal data teams. A company's analysts use them to explore data, build reports, and share insights with executives and department heads. The users are employees. The data is the company's own. The tool can require training, a dedicated login, and a data modeling layer because the people using it are professionals whose job is data analysis.
Embedded analytics inverts this model entirely.
The users are customers, not employees. The data belongs to each individual customer, not to the company running the product. The tool must feel like part of the product, not a separate application. And the experience must be accessible to someone whose job is not data analysis and who has no patience for a learning curve.
This creates four requirements that traditional BI tools were not designed around and that most adapted inadequately to support.
-
Multi-tenant data isolation.
In a SaaS product with 500 customers, each customer must only ever see their own data. A logistics company's shipment data cannot be visible to another logistics company. A fintech platform's transaction records cannot bleed across customer accounts. Traditional BI tools handle data security for internal roles. Embedded analytics tools must handle it for external customer boundaries, at scale, reliably. -
White labeling.
When a customer uses an embedded dashboard, they are using the SaaS product. They are not using Draxlr, Tableau, or any other analytics tool. The dashboard should look, feel, and behave as though the product team built it from scratch. That means no third-party logos, no external color schemes, no vendor branding of any kind. Draxlr's white-label BI solution is built specifically for this requirement. -
Unlimited customer viewers.
A SaaS product with 500 customers does not know in advance which of those customers will view their embedded dashboard on a given day. Per-viewer pricing models where each customer who views a dashboard is billed as a separate user create costs that compound unpredictably as the product grows. Embedded analytics pricing built for SaaS uses flat, capacity-based models that decouple the analytics cost from the customer count. -
Fast implementation.
A SaaS team shipping embedded analytics is shipping a product feature, not building a data warehouse. The tool needs to connect to the existing database, generate ready-to-use embed code, and get a dashboard live in the product within days or weeks, not months.
If you are evaluating whether to replace an existing tool, the best embedded analytics tools guide compares the leading options purpose-built for SaaS.
Traditional BI was built for internal teams analyzing company data. Embedded analytics is built for SaaS products serving external customers who each need their own view of their own data.
How Embedded Analytics Works
At a technical level, embedded analytics involves three stages and those are data connection, dashboard creation, and embed delivery.
1. Data connection
The embedded analytics tool connects to the SaaS product's database. This is typically a direct connection to a SQL database like PostgreSQL, MySQL, Redshift, BigQuery, Snowflake, or similar. The connection allows the tool to run queries against live data and return results in real time.
2. Dashboard creation
The product team builds dashboards using the analytics tool's interface. This might involve a drag-and-drop builder for non-technical team members, a SQL editor for developers, or an AI-powered query tool that generates SQL from plain English. The result is a set of charts, tables, and metrics arranged into a dashboard.
3. Embed delivery
The embedded analytics tool generates an embed token or code snippet. This token authenticates the request, enforces the data filters for the specific customer viewing the dashboard, and returns the rendered dashboard to the host application. The host application renders the dashboard inside the product.
The customer opens the product, sees a dashboard that looks like part of the application, and interacts with their data. They apply filters, drill into specific records, export a report. None of this requires them to know that an embedded analytics tool is doing the work underneath.
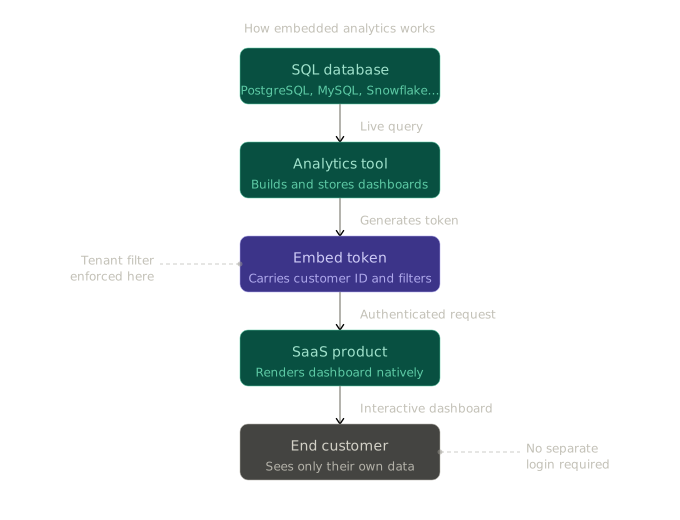
The embed token is where multi-tenant security is enforced. When the SaaS product generates an embed request for a specific customer, it includes that customer's identifier. The embedded analytics tool uses this to filter the data before returning anything. Customer A's token returns only Customer A's data. Customer B's token returns only Customer B's data. This filtering happens at the query level, not the display level, which means the isolation is enforced even if a customer attempts to manipulate the URL or interface.
What Embedded Analytics Requires for SaaS Products
Understanding the mechanics is different from understanding what a SaaS team actually needs to ship embedded analytics successfully. The requirements go beyond the technical.
-
A direct database connection with no middleware. The best embedded analytics tools connect directly to the existing production database or data warehouse. Tools that require a separate ETL pipeline, a data modeling layer, or a custom API as an intermediary add weeks to the implementation and ongoing engineering overhead.
-
Tenant-level data filtering that requires no custom code per customer. Manually writing filter logic for each new customer is not scalable. The right tool lets the product team define the rule once, for example row-level security on a customer ID column, and applies it automatically to every embed request for that customer. In Draxlr, that rule lives in an RLS group on the Power plan, and your backend sends the group and the customer's ID with each embed token. New customers are added without any additional engineering.
-
White labeling from the first paid plan. For many SaaS teams, white labeling is not a nice-to-have. It is a requirement. A dashboard that displays third-party branding breaks the product experience, confuses customers, and undermines trust in the product. Tools that gate white labeling behind an enterprise tier force teams to either pay a premium or ship a sub-standard experience.
-
Unlimited or flat-rate customer viewers. Per-viewer pricing is the most common cause of embedded analytics budget problems. A tool that seems affordable at 50 customers becomes expensive at 500 and unsustainable at 5,000. SaaS teams planning for growth need a pricing model where the analytics cost does not scale linearly with the customer base.
-
Embed options that match the product's architecture. A product built in React needs a React SDK. A product that renders server-side needs an API. The embedded analytics tool must support the host product's frontend architecture, not require the product to change its architecture to accommodate the tool.
Benefits of Embedded Analytics for SaaS Teams
Shipping embedded analytics affects the product in ways that extend beyond the feature itself.
1. Reduced churn
Customers who regularly engage with data inside a product have a much stronger attachment to that product. The data becomes an asset they rely on. Moving to a competitor means losing that history, that context, and that visibility. Analytics creates switching costs that benefit retention.
2. Increased perceived value
A product that surfaces actionable insights alongside the core workflow is a more valuable product than one that requires customers to export data and analyze it elsewhere. Embedded analytics raises the price ceiling for the product and justifies higher subscription tiers.
3. Fewer support requests
A significant proportion of customer support queries are data questions like how many of X happened last month, what changed between these two dates, why is this number different from last week. When customers can answer these questions themselves through an embedded dashboard, the support load decreases.
4. Competitive differentiation
Most SaaS products in a given category offer roughly equivalent core functionality. Embedded analytics gives customers a reason to choose one product over another that goes beyond features and price. It changes the product from a tool that processes data to a platform that generates insight.
5. Expansion inside customer accounts
When users can see the impact of their work inside your product, they have something concrete to share with their manager or team. That shareable proof of value is often what gets a product expanded from one team to a whole department.
Who Uses Embedded Analytics
Embedded analytics appears across nearly every SaaS category. The specific implementation varies but the core pattern is consistent. Customer-specific data surfaced inside the product without requiring the customer to leave.
-
Operations and logistics SaaS. Shipping and delivery platforms embed dashboards showing order volume, delivery times, carrier performance, and exception rates. Each customer sees their own operational data with filters for date range, geography, carrier, and status.
-
Fintech and payment platforms. Payment processing and financial management tools embed revenue dashboards, transaction breakdowns, dispute analysis, and reconciliation reports. Customers use these to manage cash flow and report to their own stakeholders without exporting to spreadsheets.
-
HR and workforce management. HR platforms embed headcount dashboards, turnover analysis, hiring funnel metrics, and compensation benchmarks. These are particularly valuable for customers who need to present workforce data to leadership without involving the HR team for every report.
-
E-commerce and retail SaaS. E-commerce platforms embed product performance, customer cohort analysis, revenue attribution, and inventory dashboards. Merchants use these to make buying, merchandising, and marketing decisions within the platform.
-
Developer tools and infrastructure SaaS. API platforms, monitoring tools, and infrastructure products embed usage dashboards showing request volume, error rates, latency percentiles, and cost attribution. These are often the primary way customers understand their own usage patterns.
-
Healthcare and compliance SaaS. Patient management, compliance tracking, and clinical workflow tools embed reporting dashboards for regulatory submissions, outcome tracking, and operational metrics. The multi-tenant isolation requirement is particularly critical in this category given data privacy regulations.
-
Project management SaaS. Project and work management tools embed sprint velocity, task completion by assignee, time-to-completion trends, and blocked items over time, so team leads can report progress without exporting data.
The strongest implementations share one trait: every metric connects to an outcome the customer cares about. The analytics exist to help customers do their job, not to show that the product collects data. Some products go beyond fixed dashboards and give each customer a self-serve analytics workspace with a query builder and dashboards of their own, which trades a known set of charts for a tenant boundary you now have to enforce at the query layer rather than in the chart. Whether that trade pays off depends on how much your customers' questions vary from account to account. In Draxlr, Full App Embedding is available on the Power plan ($250/month and above).
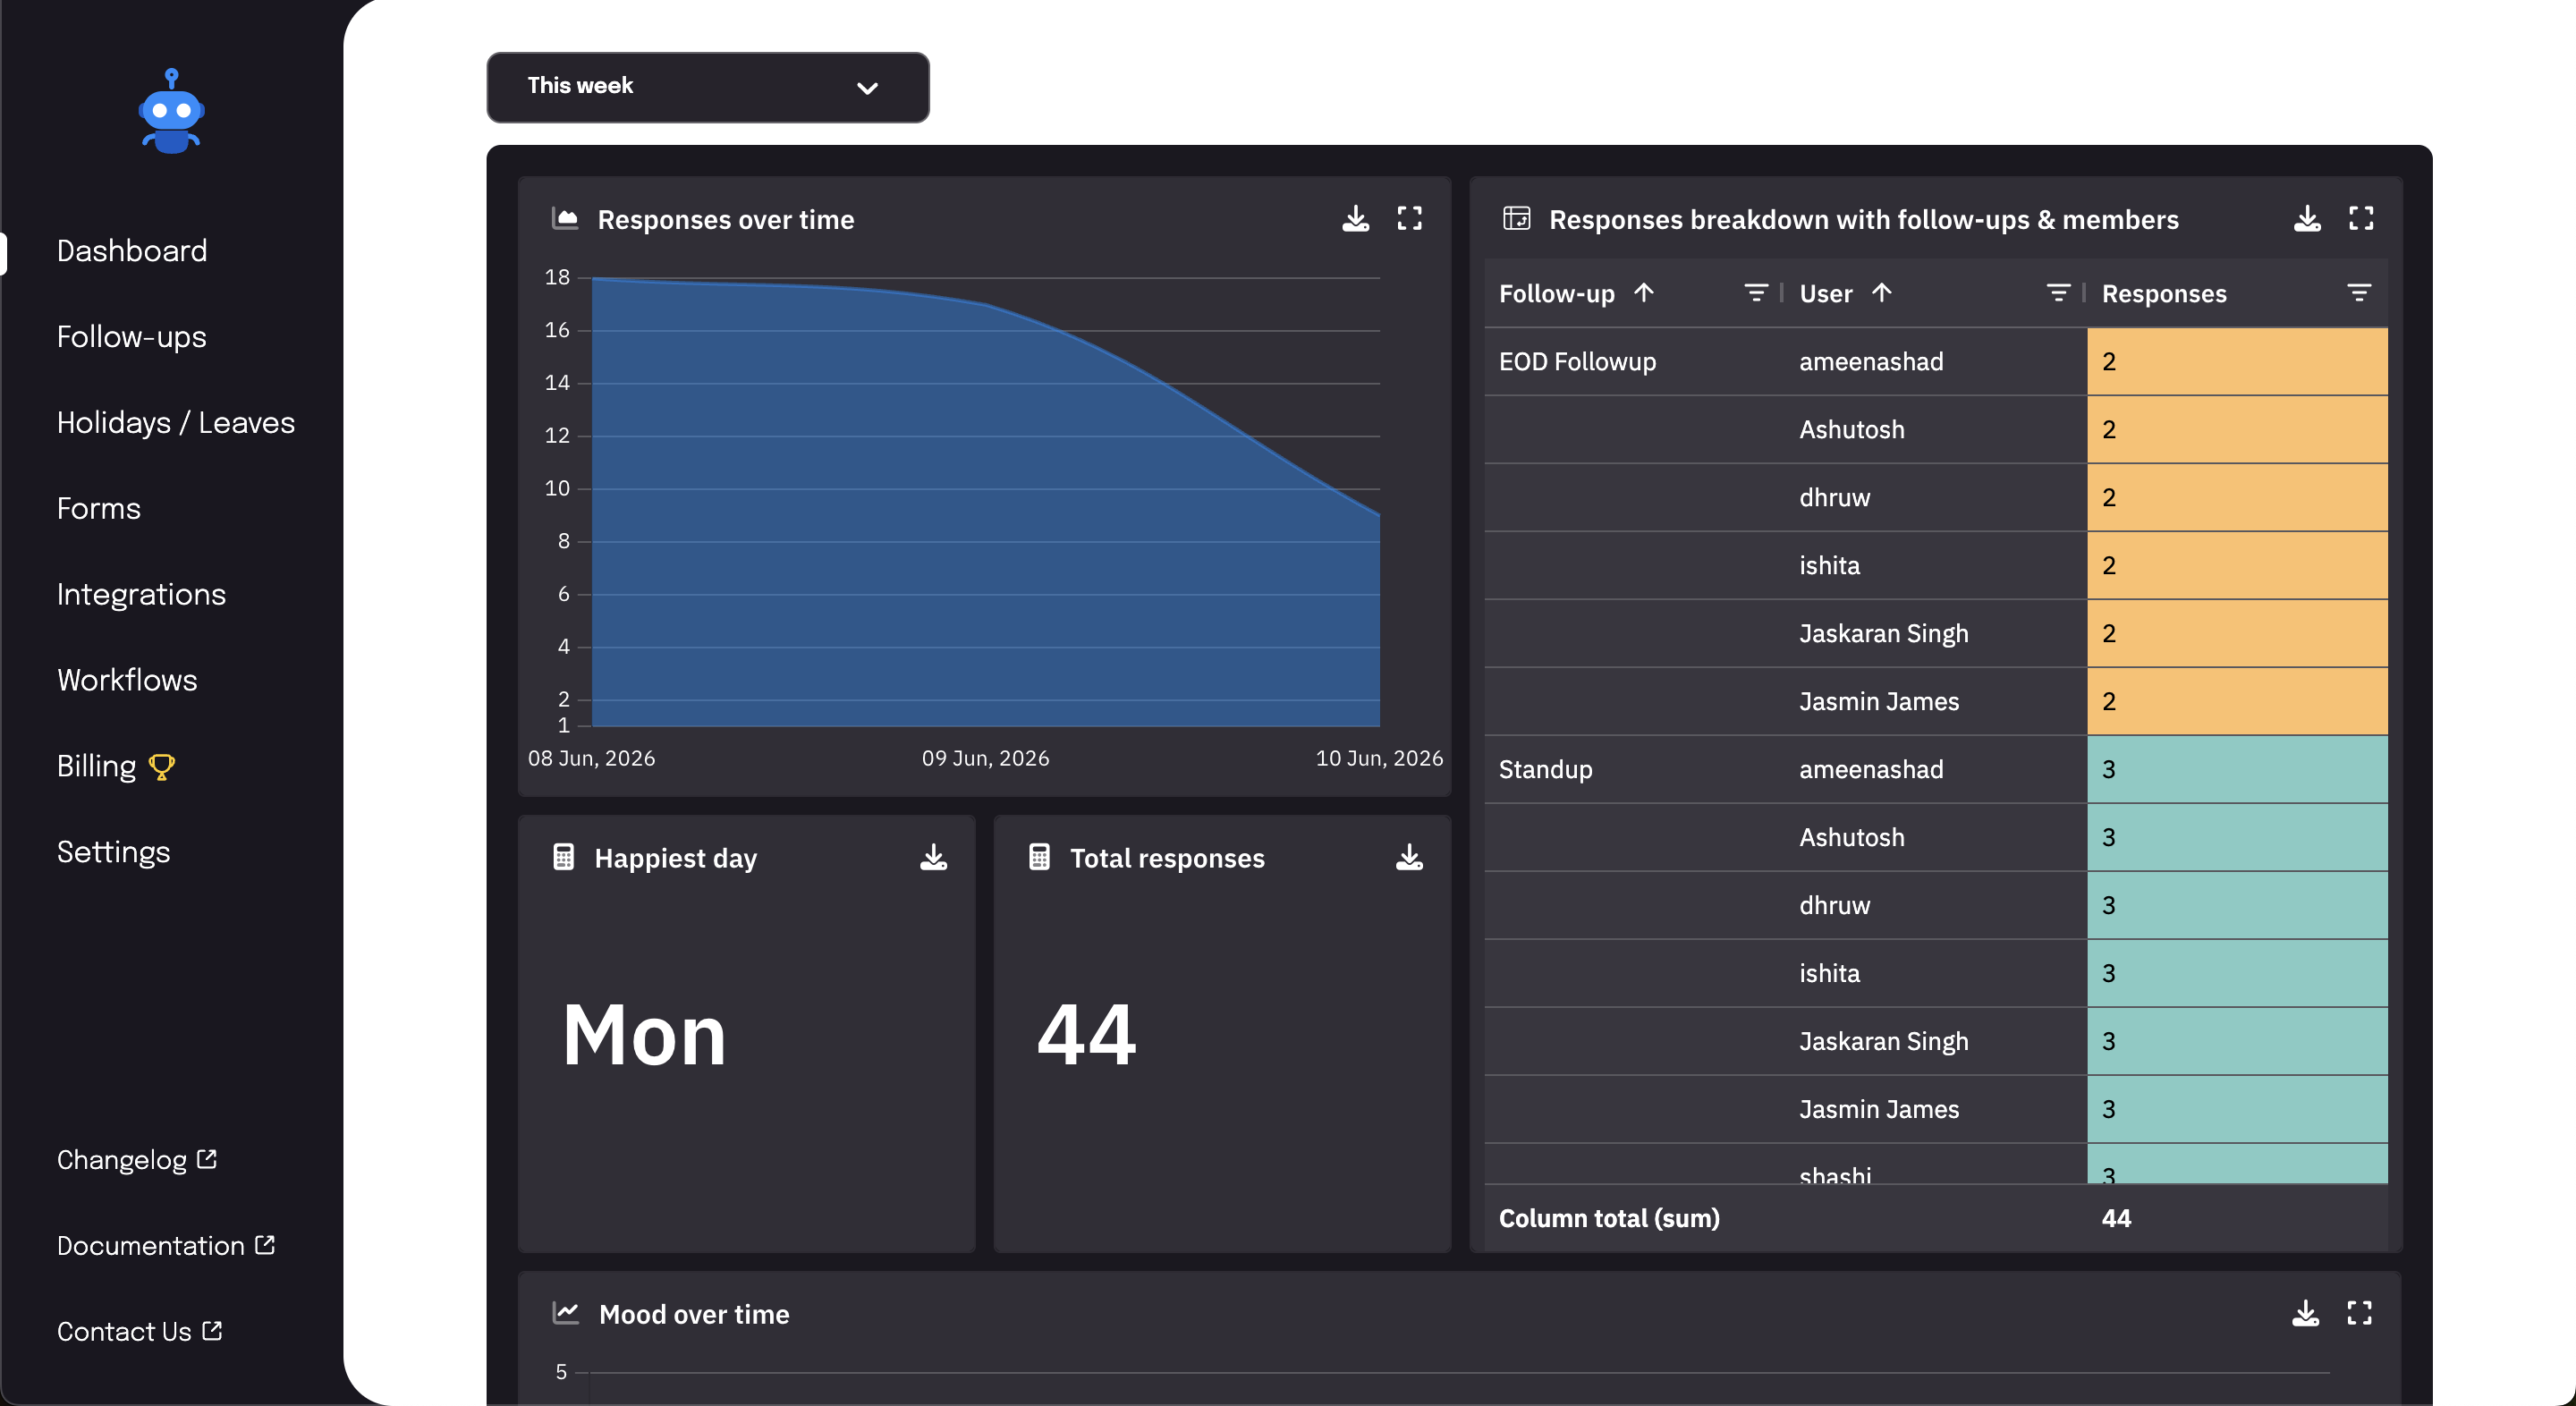
A Draxlr embedded analytics dashboard inside Sup, asynchronous standup tool, showing response trends, happiest day, total responses, and a breakdown by follow-up type and team member. The Draxlr dashboard renders natively inside the Sup product with no separate login required for Sup users.
How Much Does Embedded Analytics Cost
Embedded analytics pricing varies more than almost any other SaaS tool category. The range runs from $75/month for purpose-built tools to $250,000 per year for enterprise platforms.
The variation is explained by pricing model, not by features. Most of the capabilities that matter for a SaaS embedded analytics implementation are available at the affordable end of the market. What enterprise pricing buys is primarily organizational support, compliance certifications, and the brand name on the contract.
The five pricing models in the category work as follows.
-
Flat pricing charges a fixed monthly fee regardless of how many customers view dashboards, how many queries are run, or how much data is processed. This is the most predictable model for SaaS teams because the analytics cost does not change as the product scales. Draxlr uses flat pricing starting at $75/month.
-
Per-seat pricing charges for each user who accesses embedded content. For internal analytics where the user count is fixed and known, this model is predictable. For customer-facing embedded analytics where user counts grow with the product, it compounds quickly. Metabase Pro starts at $575/month and charges $12/month per user for interactive embedding. A product with 500 customers accessing interactive embedded dashboards pays $6,000/month in viewer fees alone before any infrastructure costs.
-
Usage-based pricing charges based on how many customers use embedded dashboards, often counted as Monthly Active Users (MAU). Costs scale with customer engagement, which creates a perverse incentive where a successful product that drives more customer analytics usage generates a higher bill. Luzmo's price scales with customer adoption, starting at €1,995/month billed annually.
-
Capacity-based pricing charges for compute capacity rather than users or queries. Power BI Embedded uses Azure A-SKU capacity pricing starting at approximately $735/month for the A1 SKU. Costs increase when more concurrent users require higher capacity. This model is more predictable than per-seat but still requires capacity planning and can spike under unexpected load.
-
Consumption-based pricing charges for actual usage like queries run, data processed, dashboard sessions initiated. Domo uses a credit-based consumption model with no published pricing. Costs are highly variable and have surprised customers with significant increases at renewal.
For a full comparison of embedded analytics pricing across multiple tools, see the embedded analytics pricing comparison.
The most common pricing mistake SaaS teams make is choosing an embedded analytics tool based on its advertised entry price without modeling what it costs at 500 customers. A $10/month entry price with per-viewer fees can cost more than a $75/month flat-rate tool within three months of launch.
What to Look for When Choosing an Embedded Analytics Tool
Not all embedded analytics tools are built for the same use case. Some are designed for enterprise data teams that also need an embedding option. Others are built specifically for SaaS products that need customer-facing analytics. Knowing what to look for narrows the field quickly.
Multi-tenant support built in, not bolted on
Ask specifically how tenant data isolation is enforced. Some tools handle this natively with parameterized filters that apply at the query level. Others require custom implementation per customer, which adds engineering time for every new account.
White labeling included at the tier you are actually buying.
Do not assume white labeling is available because the pricing page lists it as a feature. Check which tier includes it. Several tools advertise white labeling but gate it behind a tier that costs five to ten times the entry price.
Pricing model that does not punish growth.
Model the cost at 100 customers, 500 customers, and 1,000 customers using the tool's pricing model. If the cost at 500 customers is unacceptable, the tool is not the right fit regardless of how it looks at 10 customers.
Direct database connectivity.
If the tool requires a custom API, a data transformation layer, or a specific cloud data warehouse to function, add the implementation cost and ongoing maintenance of that infrastructure to the total cost of ownership.
Embed options that match your stack.
Confirm the tool supports your frontend framework before evaluating anything else. A React SDK is not interchangeable with an iframe. A backend API requires different development effort than a pre-built component.
A free trial with no credit card required.
Any embedded analytics tool worth evaluating should let the product team connect a real database, build a real dashboard, and test the embed in a staging environment before committing to a subscription. If a sales call is required before pricing or trial access is available, that is a signal about how the relationship will continue.
Build vs Buy
Every SaaS team evaluating embedded analytics eventually asks whether to build a custom charting layer. Building makes sense only when the requirements are simple and unlikely to grow, and the team has spare frontend and data engineering capacity. In practice, a custom analytics layer keeps expanding as customers ask for new charts, filters, and exports, and that work competes with the core product roadmap. For the full numbers, see this build-vs-buy cost breakdown.
AI and the Future of Embedded Analytics
The most significant shift in embedded analytics over the past two years has been the introduction of natural language interfaces. Instead of customers navigating pre-built dashboards, they can ask questions in plain English and receive chart responses generated from their data in real time.
This changes the relationship between the customer and their data. A pre-built dashboard answers questions the product team anticipated. A natural language interface answers questions the product team did not anticipate, which is the vast majority of the questions customers actually have.
For SaaS teams evaluating embedded analytics tools today, AI capability is worth considering but should not be the primary evaluation criterion. The foundational requirements, covering multi-tenancy, white labeling, flat pricing, and fast implementation, matter more than AI features for most teams at the stage where they are first shipping embedded analytics. AI features are additive once the core embedded analytics layer is working.
What is more immediately relevant is AI-assisted dashboard creation. Several embedded analytics tools now include AI SQL tools that generate queries from plain English, which reduces the engineering dependency for building and updating dashboards. This matters for product teams where non-technical members need to own dashboard creation and iteration.
Common Mistakes SaaS Teams Make With Embedded Analytics
-
Starting with too much. Teams try to ship a complete analytics suite on day one and end up with a sprawling dashboard nobody reads. Start with three to five metrics tied to the core outcome your product delivers, build those well, and add more based on what customers ask for.
-
Reusing internal dashboards. A dashboard built for an internal quarterly review rarely works for a customer checking it in the middle of a busy day. Keep customer-facing dashboards simple, fast to read, and focused on metrics the customer can act on.
-
Getting the branding 80% right. A white-labeled dashboard that almost matches your product looks worse than one that is clearly separate. If your product runs in dark mode and the embedded charts are white with a different font, customers notice. Give the analytics layer's theme the same attention as the rest of the product, including dark and light mode.
How to Get Started
Getting embedded analytics into a SaaS product involves five practical steps regardless of which tool is chosen.
-
Step 1 — Define the customer data questions. Before evaluating tools, write down the five to ten questions your customers most frequently ask about their own data. These become the first dashboards. Starting with real customer questions rather than generic metrics produces dashboards that get used.
-
Step 2 — Map the data. Identify which tables and columns in the existing database answer those questions. Note which columns contain customer identifiers that will be used for tenant isolation. If the data lives in multiple sources, decide whether to consolidate it before starting or start with a single source and expand later.
-
Step 3 — Choose the embed method. Decide whether the product will use iframe, HTML, React SDK, Vue SDK, or backend API embedding based on the product's existing frontend architecture. This decision affects which tools are viable and how long implementation will take.
-
Step 4 — Start a free trial with real data. Connect the actual production database or a staging copy to the tool. Build one of the dashboards from Step 1. Configure tenant isolation, such as row-level security. Generate the embed code and paste it into a staging environment. Evaluate the output against the real customer experience, not against a demo dataset.
-
Step 5 — Define the customer experience. Before launching, define what the customer will see, how they will interact with it, and what they will be able to do. The technical implementation should serve a defined customer experience, not the other way around.
For a practical breakdown of how to choose between tools based on your specific stack, budget, and customer requirements, see the embedded analytics tool comparison. For teams specifically evaluating cost, the affordable embedded analytics tool guide covers the pricing options in detail.
Next Steps: Start Embedding Analytics in Your Product
Start a 7-day free trial with no credit card required and have your first embedded dashboard live with Draxlr.
Connect your DatabaseWatch: How Embedded Analytics Works in Draxlr
FAQs
1. What is embedded analytics?
Embedded analytics means putting data dashboards inside a software product so users can see and interact with their data without leaving the application. Instead of logging into a separate reporting tool or downloading a spreadsheet, users see live charts and tables built into the product they already use.
2. What is the difference between embedded analytics and business intelligence?
Business intelligence tools are designed for internal teams analyzing company-wide data. Embedded analytics is designed for customer-facing products where each customer needs to see their own data inside the application. The key differences are multi-tenant data isolation, white labeling, and the requirement that the experience feels native to the host product rather than like a third-party tool.
3. What does an embedded analytics tool do?
An embedded analytics tool connects to a database, lets teams build dashboards, and generates embed code that renders those dashboards inside another application. It handles data security, query execution, visualization rendering, and white labeling so that the product team does not need to build these capabilities from scratch.
4. How much does embedded analytics cost?
Embedded analytics pricing ranges from $75/month for purpose-built SaaS tools to $250,000 per year for enterprise platforms. The most significant cost variable is the pricing model. Flat-rate tools like Draxlr charge a fixed monthly fee regardless of customer count. Per-seat tools like Metabase charge $12/month per user for interactive embedding. Capacity-based tools like Power BI Embedded start at approximately $735/month on Azure. See the full embedded analytics pricing comparison for verified figures.
5. What is multi-tenant embedded analytics?
Multi-tenant embedded analytics means each customer in a SaaS product sees only their own data when they view an embedded dashboard. The tool enforces data boundaries at the query level using customer-specific filters. Customer A never sees Customer B's data. This is a fundamental requirement for any customer-facing SaaS product and should be verified as a built-in capability, not a custom implementation, before choosing a tool.
6. What is white label embedded analytics?
White label embedded analytics means the embedded dashboards show no vendor branding. The dashboards appear to be built by the SaaS team. No third-party logos, no external color schemes, no "powered by" badges. White labeling is available from the entry pricing tier on some tools and gated behind enterprise pricing on others. Draxlr includes white labeling in the Premium plan at $75/month.
7. Can I embed analytics without a data engineering team?
Yes, with the right tool. Purpose-built embedded analytics tools like Draxlr connect directly to SQL databases without requiring a data modeling layer or ETL pipeline. Non-technical team members can build dashboards using a drag-and-drop builder or an AI SQL tool. Enterprise tools require more data engineering investment before the first dashboard can be embedded.
8. What is the difference between embedded analytics and data visualization?
Data visualization refers to the charts and graphs used to represent data. Embedded analytics refers to the full system of connecting to data, building visualizations, enforcing data security, and delivering the output inside a host application. Data visualization is one component of embedded analytics. Embedded analytics also includes query execution, multi-tenant security, embed delivery, and white labeling.
9. What should I look for in an embedded analytics tool for a SaaS product?
The four most important criteria for SaaS teams are multi-tenant data isolation built in without custom code per customer, white labeling available at the plan you are actually buying, a pricing model that does not scale with customer count, and a free trial that lets you test with real data before committing. Secondary criteria include embed method support for your frontend framework, direct database connectivity without middleware, and implementation time to first live dashboard. See the best embedded analytics tools comparison for a detailed breakdown across 18 tools.
10. Do I need a data warehouse to use embedded analytics?
Not necessarily. Most embedded analytics tools, including Draxlr, connect directly to transactional databases like PostgreSQL or MySQL. A data warehouse like BigQuery or Redshift helps with large data volumes or queries across many sources, but many early and mid-stage SaaS products get significant value from connecting their primary database, often through a read replica.
11. Is embedded analytics only for large SaaS companies?
No. Embedded analytics tools now exist at price points that fit early-stage SaaS companies, and implementation timelines are measured in weeks, not months. Draxlr's embedding starts at $75/month on the Premium plan. The decision depends less on company size and more on whether customer-facing data is a meaningful part of your product's value.
About the author

Ameena is the founder of Draxlr, a modern business intelligence platform focused on making data analysis simpler and faster. She writes about embedded analytics, databases, SQL, dashboards, and building scalable data products for modern teams.
If you have questions about anything in this guide, or want to compare options for your specific stack, you can try Draxlr free, or reach out directly through the Draxlr team.