Best ClickHouse Reporting Tools
Looking for ClickHouse reporting tools? Explore the best options for dashboards, analytics, and internal reporting on your ClickHouse data.

ClickHouse is built for speed. Its columnar storage and vectorized query execution let teams run analytical queries across billions of rows in milliseconds — something most transactional databases can't touch. But raw query performance only gets you so far. As soon as your team wants to understand that data regularly, share insights with stakeholders, or surface analytics inside a product, you need more than a fast database.
Engineering teams using ClickHouse often start with the built-in Play UI or connect via a SQL client. That works for development and exploration, but it's not a sustainable reporting layer. Writing ad-hoc queries for every business question, managing access to production for every teammate, and rebuilding the same visualizations manually each week adds up quickly. The same pain that drives teams toward ClickHouse's speed becomes a bottleneck when reporting is still manual.
ClickHouse reporting tools close that gap. They connect directly to your ClickHouse database, give teams controlled access to data, and provide dashboards, charts, and scheduled reports without requiring everyone to write SQL. In this article, we break down the most reliable ClickHouse reporting tools to consider for 2026.
What are ClickHouse reporting tools?
ClickHouse reporting tools connect directly to your ClickHouse database and give you dashboards, charts, and shared reports without writing queries for every business question. They replace ad-hoc SQL workflows with repeatable, visual reporting that technical and nontechnical users alike can work with.
Because ClickHouse is an OLAP database designed for high-throughput analytical workloads, reporting tools that connect natively can take full advantage of its performance. Queries run directly against your ClickHouse schema — no ETL pipelines, no data duplication, no lag between your source data and what appears in the dashboard. This makes ClickHouse an especially good fit for teams that need real-time or near-real-time analytics at scale.
How to choose a ClickHouse reporting tool
Choosing the right ClickHouse reporting tool depends on what you want to achieve with your data. A product team that needs a fast internal dashboard will prioritize very different features compared to a company building customer-facing analytics or an operations team monitoring live system metrics.
Start by identifying your primary goal.
1. If your goal is internal reporting for your team
Pick a tool with strong SQL support, an intuitive dashboard builder, and simple sharing. You want clarity without adding another system to maintain. ClickHouse's speed means your dashboards can handle larger datasets without compromising load times.
2. If your goal is customer-facing analytics
Look for embedding, white-label controls, and row-level filtering. Your users should see analytics that look like part of your product, not an external BI tool. ClickHouse's high query concurrency makes it a solid backend for multi-tenant embedded dashboards.
3. If your goal is replacing an existing analytics stack
Prioritize tools with flexible permissions, reusable queries, scheduling, and scalable embedding. If you're migrating from a slower database or a complex warehouse setup, ClickHouse combined with a dedicated reporting layer can significantly simplify your analytics infrastructure.
4. If your goal is minimal engineering involvement
Pick a tool that lets product, support, or operations teams explore data on their own. Features like visual query builders and AI text-to-SQL reduce the number of ad-hoc requests that get routed to the data or engineering team.
Ultimately, the right ClickHouse reporting tool depends on whether you prioritize speed to insight, customer experience, or long-term scalability.
Key features to look for in ClickHouse reporting tools
A search for ClickHouse analytics tools returns plenty of options, but they're not all built the same. Not every BI tool connects to ClickHouse natively, and those that do vary significantly in how well they handle its columnar architecture, high-cardinality data, and materialized views.
Here are the core features to evaluate when comparing ClickHouse reporting tools.
1. Native ClickHouse compatibility
Your reporting tool should connect directly to ClickHouse without requiring ETL pipelines, data syncing, or schema transformation. Native support means:
- Queries run directly on your ClickHouse tables
- No duplicated datasets or external data stores
- Materialized views and aggregation tables are accessible
- Performance stays consistent with your ClickHouse setup
Tools that require you to export data or transform your schema before reporting will negate the performance advantages that made ClickHouse worth choosing in the first place.
2. Ease of dashboard building
Most teams using ClickHouse don't have a dedicated data department handling day-to-day reporting. Look for features like:
- Visual query building for nontechnical users
- Text to SQL AI for faster exploration
- Reusable chart components
- Filters and drilldowns
- Clear layout controls
- Simple sharing
The goal is for anyone on your team to answer basic data questions without opening a SQL editor.
3. Embeddability (if you want customer-facing dashboards)
If you plan to embed analytics inside your product, choose a tool with:
- Secure, stateless embed tokens
- Row-level filtering for multi-tenant apps
- White-label styling controls
ClickHouse's query concurrency makes it a strong backend for embedded analytics serving many simultaneous users. Your reporting tool should be able to leverage that capacity.
4. API access for automation
Teams using ClickHouse often automate workflows like alerting on data changes, scheduled reporting, or programmatic dashboard management. An API-first reporting tool gives you:
- Programmatic control over dashboards and reports
- Flexibility to integrate with your existing alert and notification systems
- Easier connection to your auth layer
- Automation of recurring analytics tasks
5. Data security and access control
Since ClickHouse typically holds large volumes of sensitive event or user data, access control matters. Important features include:
- No unnecessary data copying
- User-scoped dashboards and queries
- Secure embedding with token validation
- Strong role-based permissions
- Self-hosting option for sensitive deployments
6. Documentation, support, and reliability
ClickHouse-specific support is especially important here — not every BI vendor understands the nuances of columnar query patterns, aggregation states, or ReplacingMergeTree semantics. Pick a tool with clear documentation, an active community, and responsive support when things go wrong.
The best ClickHouse reporting tools to consider in 2026
Without further delay, here's a breakdown of the top ClickHouse reporting tools worth exploring in 2026 and beyond.
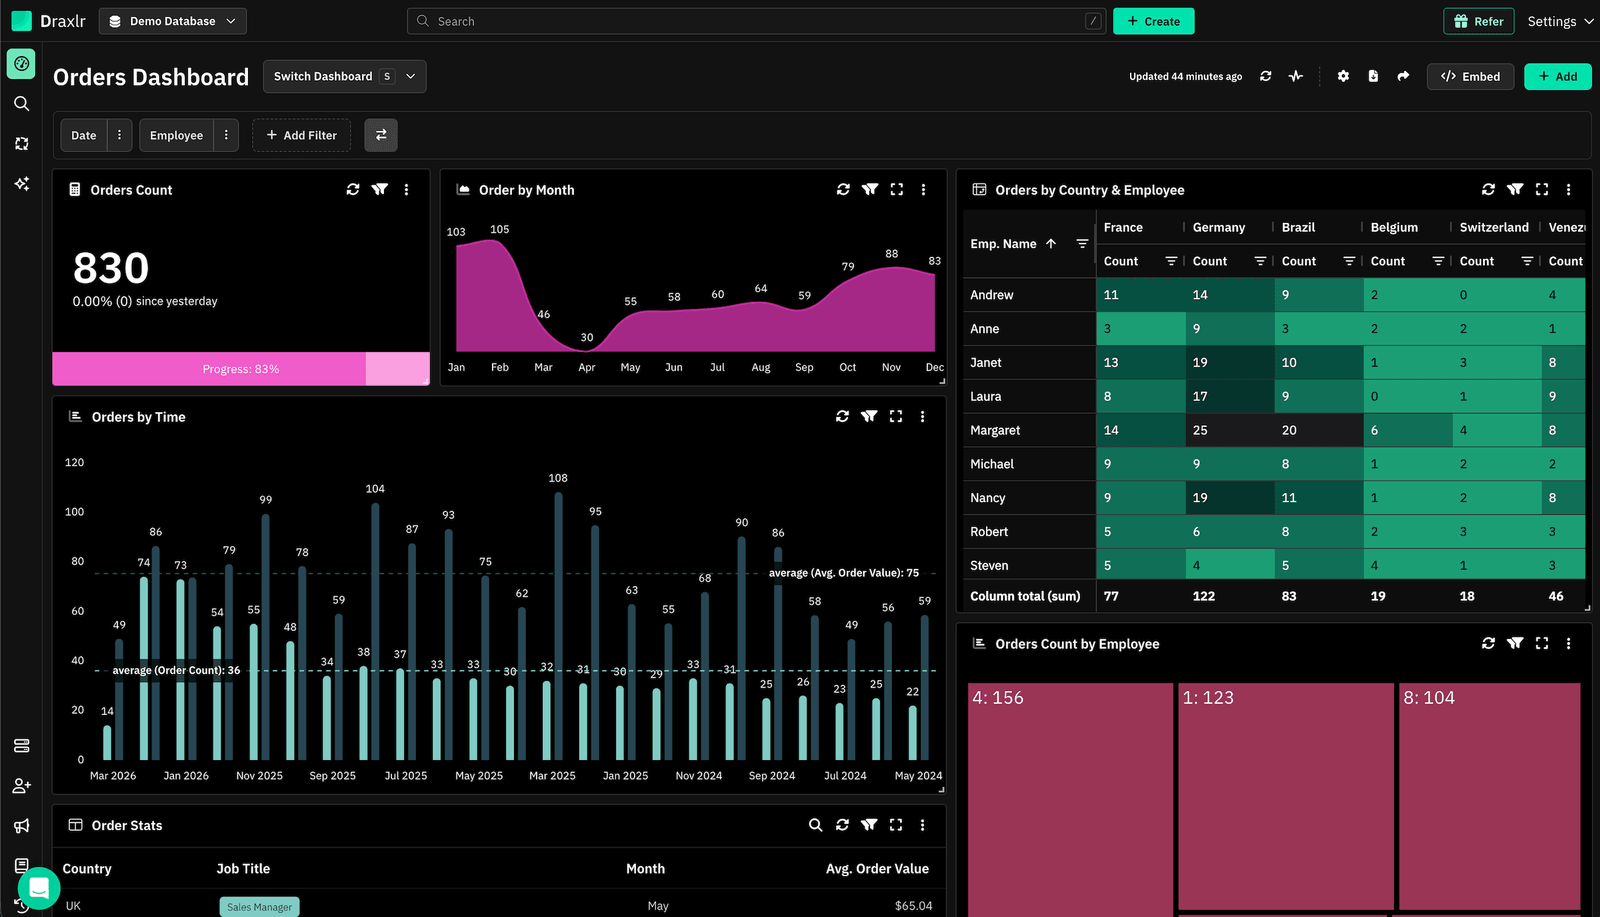
1. Draxlr: Best ClickHouse reporting tool for dashboards, team insights, and embedded analytics
Best for
SaaS teams and data-driven companies using ClickHouse who want a straightforward way to build dashboards, explore data at scale, and offer embedded analytics without setting up a heavyweight BI stack.
Connect your DatabaseDraxlr connects directly to your ClickHouse database and gives teams a clean interface for creating reports, running SQL, and building dashboards without setup overhead. Built for modern SaaS products and data teams, it helps you ship reporting fast — whether the goal is internal visibility or customer-facing analytics that scales with your ClickHouse workloads.
For technical users, Draxlr offers full SQL control, virtual columns, filters, drill-through features, and database-aware autocomplete. For nontechnical teammates, the visual query builder and AI text-to-SQL make data exploration accessible without requiring anyone to understand ClickHouse's query syntax. Given how fast ClickHouse processes analytical queries, dashboards built with Draxlr load quickly even on large tables with millions or billions of rows.
If your product includes customer analytics, Draxlr supports secure embedded dashboards with row-level filtering, white-label options, and React/Vue components that integrate naturally into your app. Teams can also automate reporting with scheduled emails, Slack alerts, and CSV/Excel exports.
Draxlr connects directly to your live ClickHouse schema — no pipelines, warehouses, or modeling layers required.
Key features
- Connects directly to ClickHouse with no ETL or data preparation
- Visual Query Builder, full SQL editor, and AI Chat for text-to-SQL
- Dashboard builder with filters, drill-through, and virtual columns
- Embedded dashboards with secure tokens, row-level filters, and white-label controls
- React and Vue SDKs for easy in-product analytics
- Export options (CSV, Excel, PDF) and scheduled reports
- Team-level permissions for safe access to production data
- Supports both internal reporting and customer-facing analytics from the same workspace
What users say about Draxlr
Draxlr offers a clean, modern interface and makes it incredibly easy to build dashboards — even for non-technical users. I especially like the visual quality and flexibility of the available graph types. It's intuitive, fast to set up, and has excellent usability from the start. The ability to securely share dashboards via link is a game-changer for our client reporting. — Review from a SaaS Founder on G2
Pricing
Draxlr offers multiple plans depending on team size, embedding needs, and data volume. Pricing starts at $75/month.
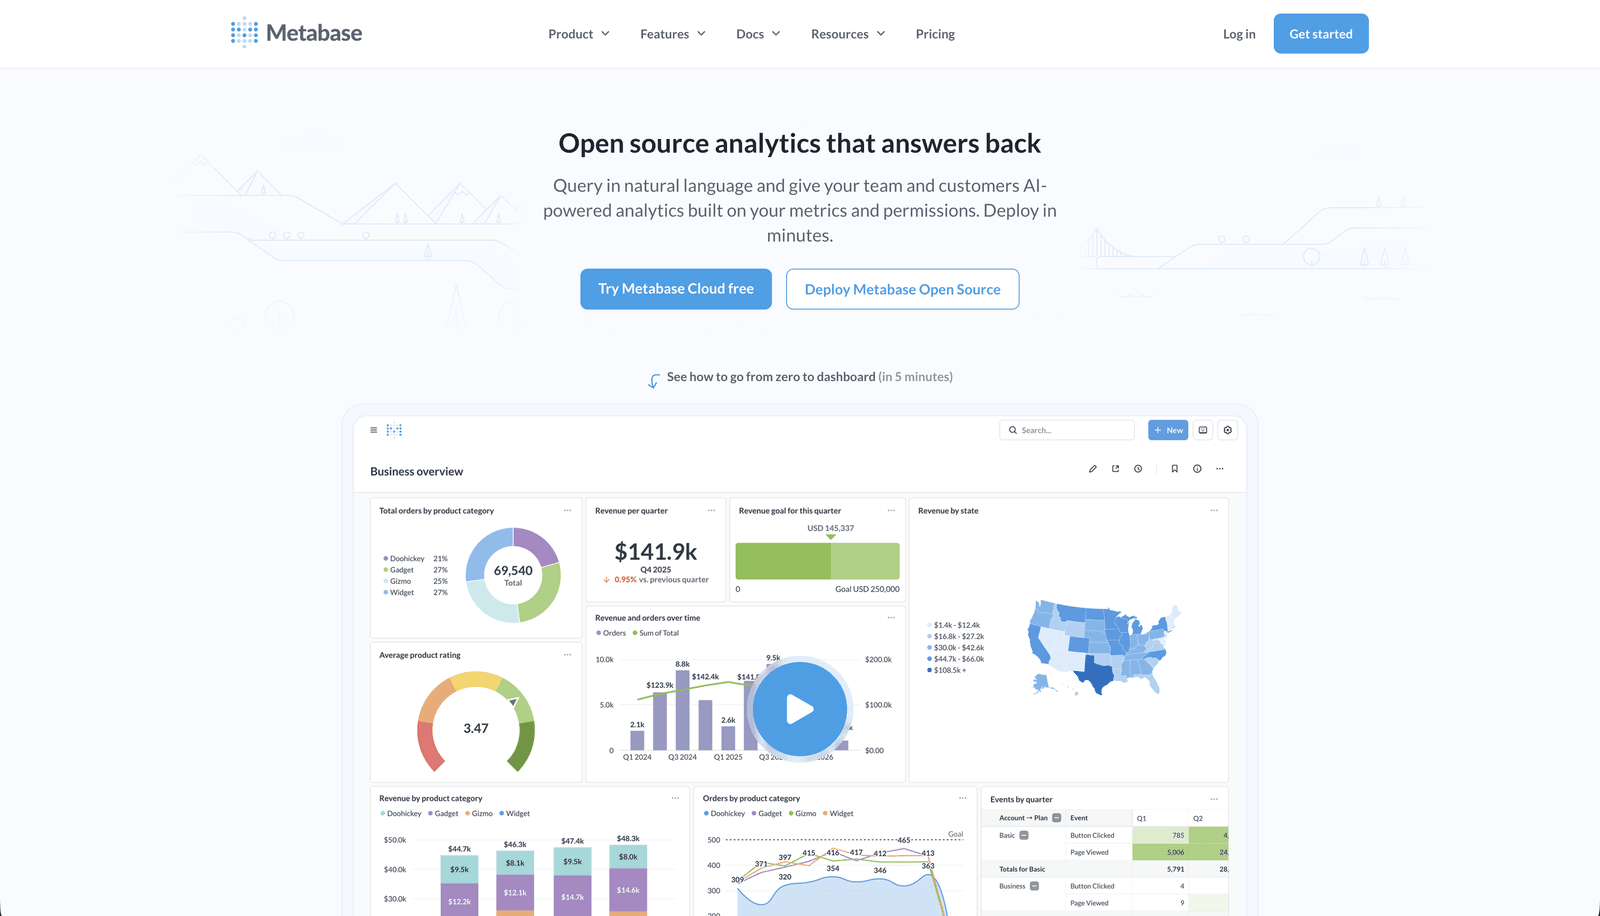
2. Metabase: Self-service analytics with native ClickHouse support
Best for
Product and operations teams that want intuitive, self-service dashboards connected to ClickHouse without needing to write SQL for every question.
Metabase is one of the most widely used self-service analytics tools, and its native ClickHouse driver — bundled directly into Metabase since version 54 — makes the connection seamless. Teams can build dashboards using the GUI question builder or raw SQL, making Metabase a practical choice for mixed technical and nontechnical teams who want to explore ClickHouse data without the complexity of enterprise BI platforms.
Metabase's no-code query builder lets users filter, group, and visualize ClickHouse data without touching SQL, while power users can drop into the native SQL editor at any time. Built-in sharing, scheduled reports, and a clean interface make it easy to distribute dashboards across teams. The open-source version is self-hosted, while Metabase Cloud is available as a managed option.
Key features
- Native ClickHouse driver bundled in Metabase 54+ (no manual installation)
- GUI question builder for no-code data exploration
- Full SQL editor for advanced queries and custom metrics
- Scheduled reports and dashboard subscriptions via email or Slack
What users say about Metabase
Metabase helps me quickly analyze business performance, track funnels, and monitor team productivity without complex tools. It centralizes our data into simple dashboards, enabling faster decision-making, reduced manual reporting, and clearer visibility into key operational and sales metrics. — G2 Review
Pricing
Free open-source version (self-hosted). Metabase Cloud and Pro plans are available for teams that prefer a managed deployment.
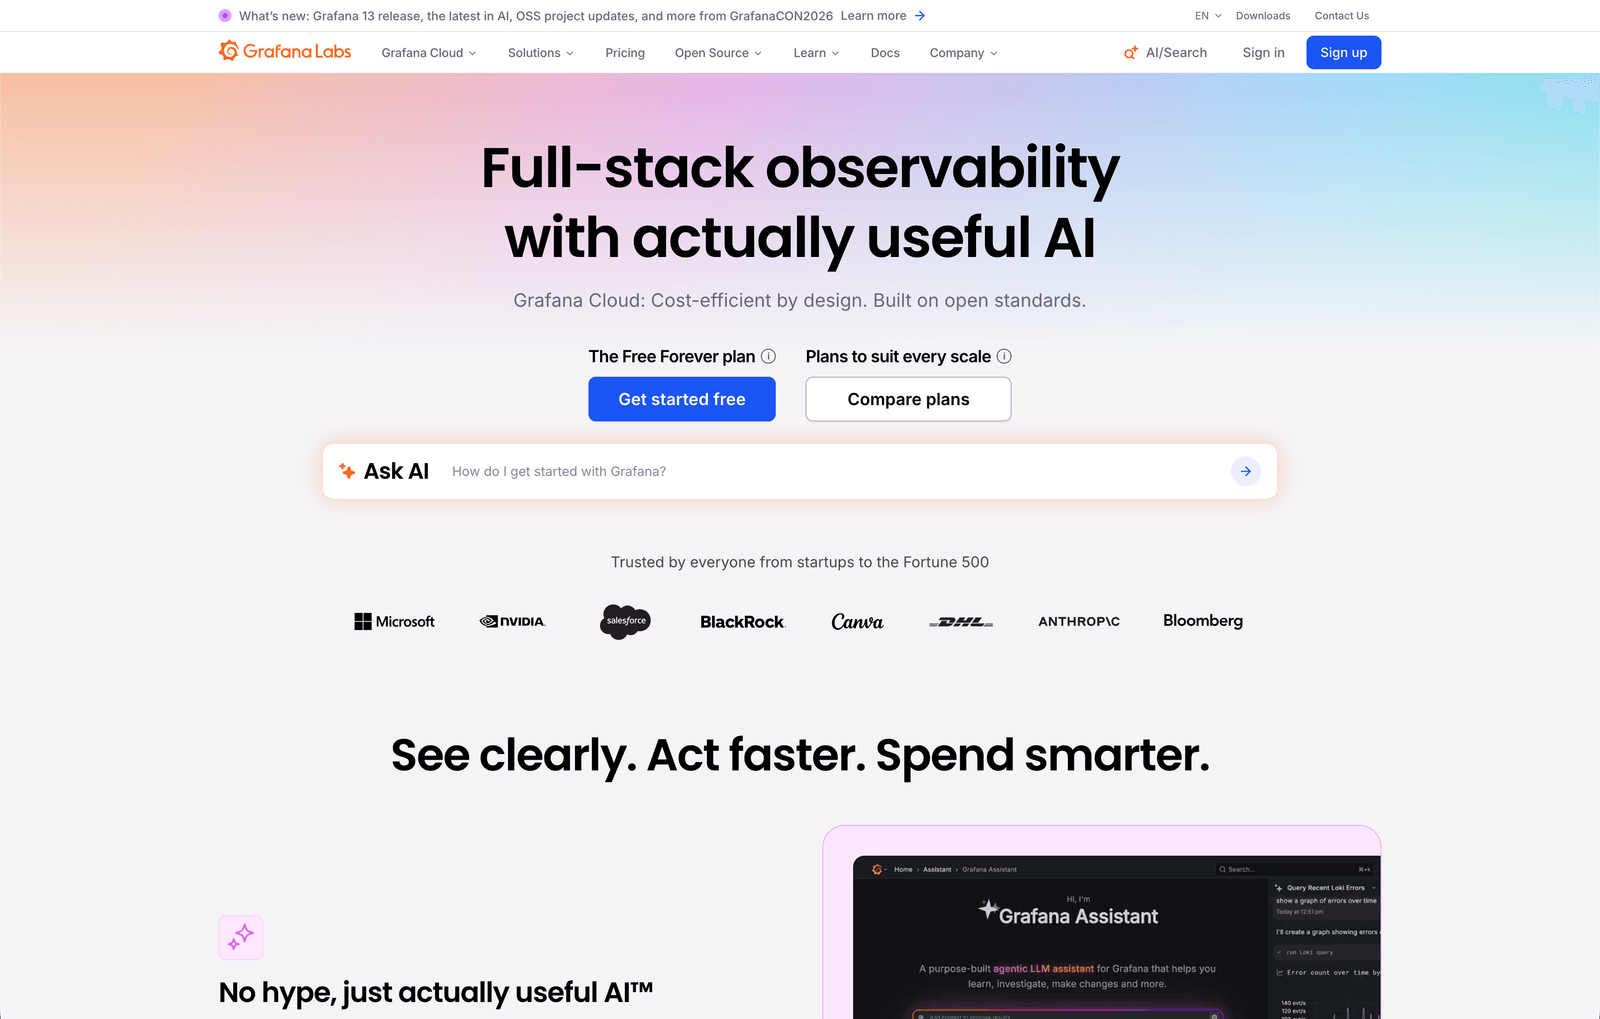
3. Grafana: Real-time operational dashboards for ClickHouse metrics and observability
Best for
Engineering, DevOps, and SRE teams who want real-time operational dashboards for metrics, logs, and traces stored in ClickHouse.
Grafana is the go-to tool for time-series visualization and operational monitoring, and its official ClickHouse plugin — co-developed with the ClickHouse team — makes it a natural fit for teams already using ClickHouse for observability data. The plugin supports a visual query builder optimized for time-series patterns as well as raw SQL, so teams can query logs, traces, and metrics without hand-writing every query from scratch.
Grafana works especially well when ClickHouse is storing event data, system metrics, or application logs that require live dashboards and threshold-based alerting. For operational use cases — monitoring infrastructure, tracking error rates, or measuring API performance — it's hard to beat. For business intelligence or customer-facing dashboards, other tools on this list may be a better fit.
Key features
- Official ClickHouse plugin developed jointly by Grafana Labs and ClickHouse
- Time-series query builder with support for metrics, logs, and traces
- Built-in alerting and threshold notifications
- Supports both HTTP and native ClickHouse protocols
What users say about Grafana
Beautiful, interactive dashboards that bring all the KPIs together in one place, with very useful alerting. All in all, an essential tool for keeping things transparent across the company and across teams. — G2 Review
Pricing
Free and open-source (Grafana OSS). Grafana Cloud offers a free tier with paid plans starting for larger usage and enterprise features.
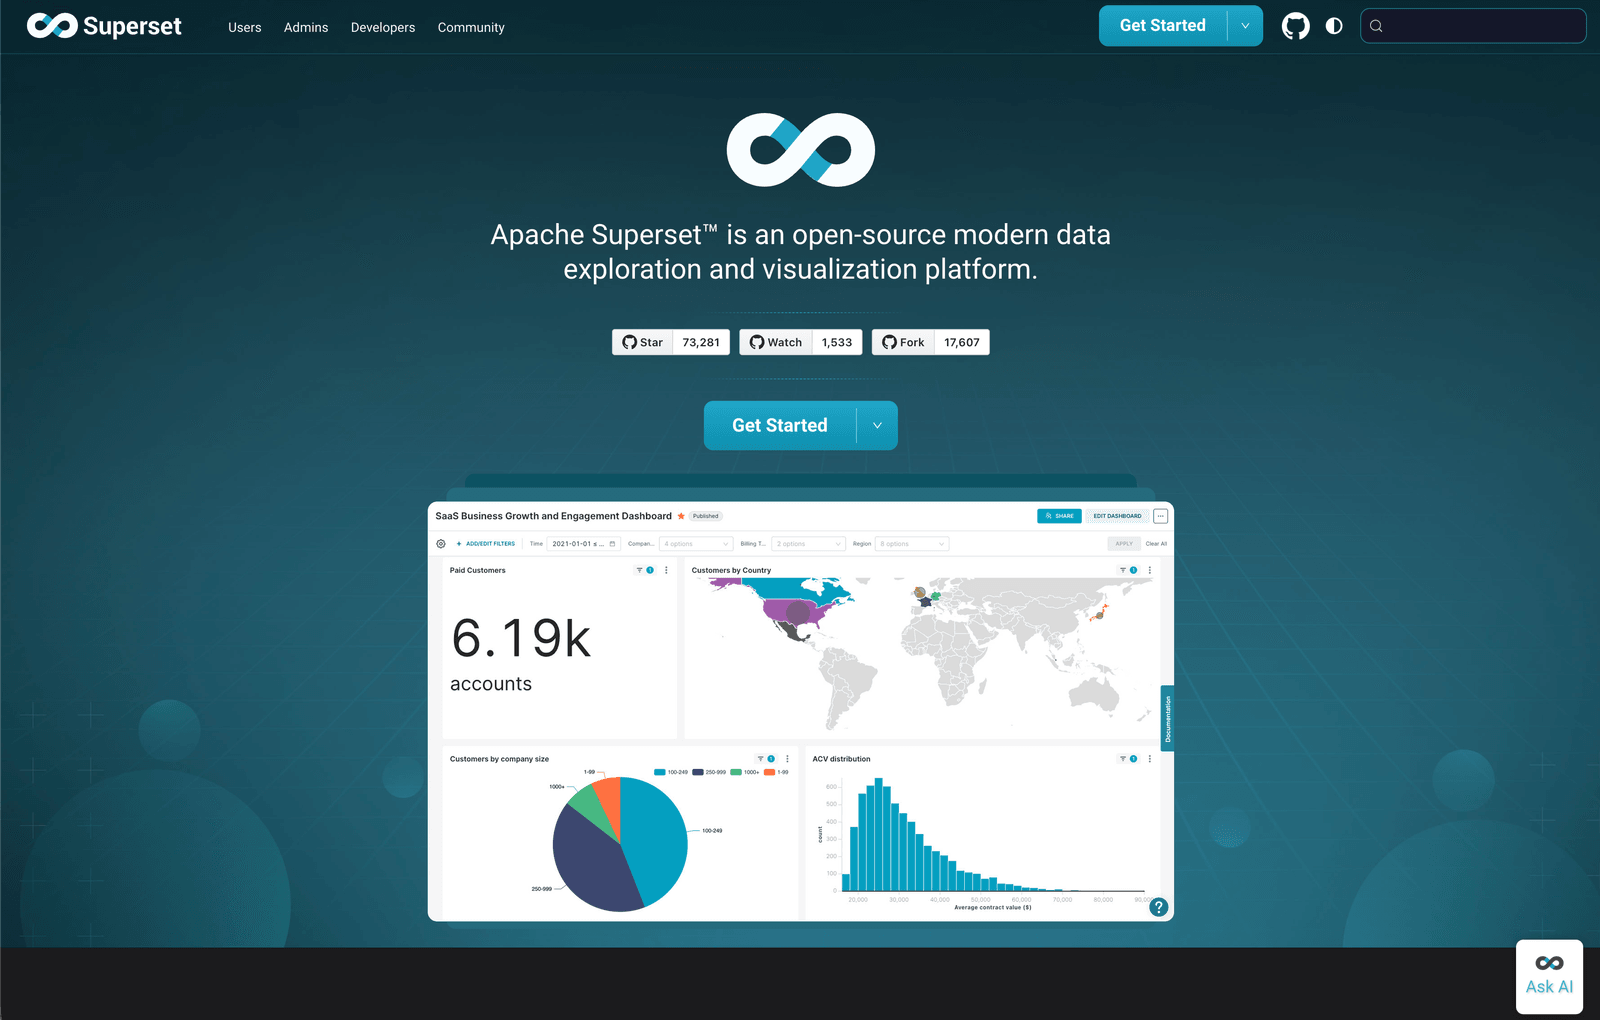
4. Apache Superset: Open-source BI for teams with engineering capacity
Best for
Companies that want a fully open-source BI platform, have in-house engineering support, and want complete control over their analytics infrastructure.
Apache Superset is a powerful open-source analytics tool with official ClickHouse support via the clickhouse-connect driver. It provides a full SQL IDE alongside a visual dashboard builder, and supports the full range of ClickHouse query features including JOINs, subqueries, ARRAY JOIN, and FINAL modifiers. Teams comfortable self-hosting get a capable and customizable analytics platform at no licensing cost.
Superset's chart library is extensive, and its dashboard builder allows complex layouts, filters, and drill-through interactions. The trade-off is setup and maintenance — Superset requires engineering investment to deploy, configure, and keep running. For teams that have the capacity, it offers a great deal of power. For teams looking for a managed, low-maintenance solution, other tools on this list will be easier to sustain.
Key features
- Official ClickHouse support via
clickhouse-connectwith full SQL feature coverage - SQL IDE and visual dashboard builder in a single platform
- Extensive chart library with customizable layouts and filters
- Fully open-source and self-hosted with no licensing fees
What users say about Apache Superset
We can combine data from different systems for thorough analysis because the platform supports an extensive amount of data sources, including ClickHouse. The visual dashboard builder is flexible and the SQL editor handles complex queries well. — G2 Review
Pricing
Free and open-source. Operational costs depend on hosting and maintenance.
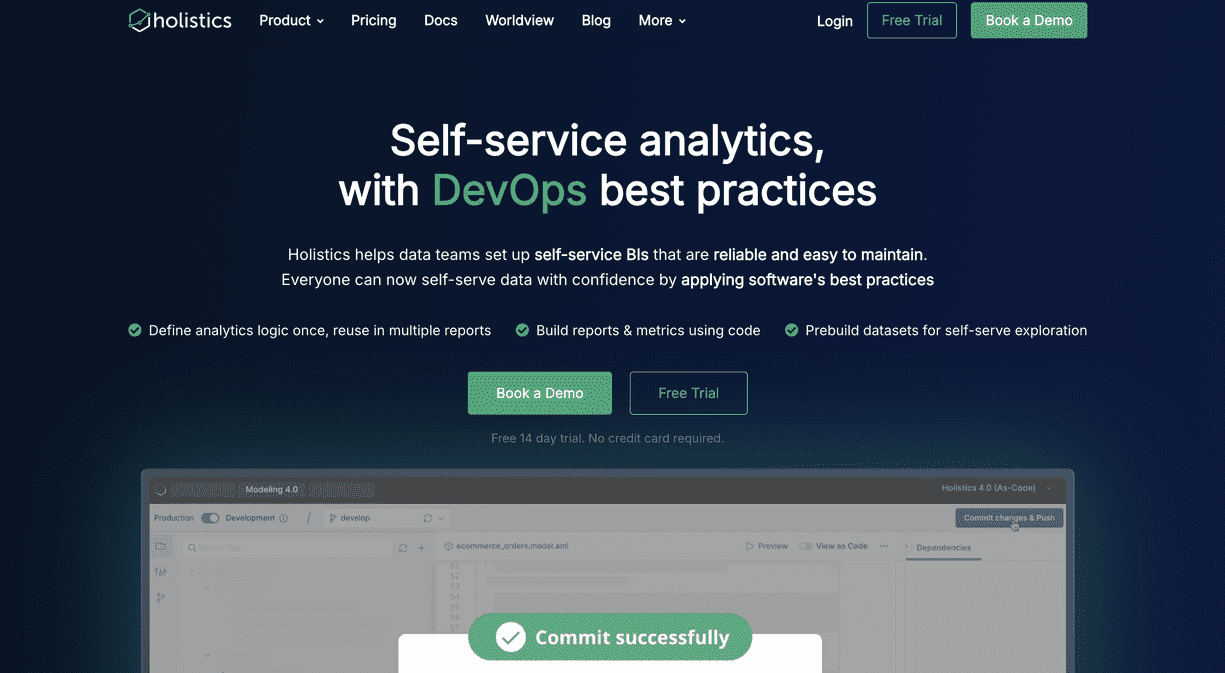
5. Holistics: SQL-centric BI with semantic layer for ClickHouse data teams
Best for
Data teams that want centralized metric definitions, a code-based semantic layer, and self-service dashboards built on ClickHouse.
Holistics is one of the first BI vendors to officially support ClickHouse, and it has invested significantly in making the integration reliable for production workloads. Its AI-native platform combines a programmable semantic layer with drag-and-drop dashboards, allowing data teams to define metrics centrally in code and expose them to business users for self-service exploration — without risking inconsistent definitions or raw table exposure.
For ClickHouse users, Holistics is particularly well-suited to teams that need structured, consistent reporting across multiple business units. The semantic layer lets you encode ClickHouse-specific logic — aggregation functions, materialized view references, time-grain definitions — once and reuse it across all dashboards. Holistics also does not store or sync a copy of your source data, so your ClickHouse data stays on your own infrastructure.
Key features
- Official ClickHouse support with a focus on production-grade reliability
- Code-based semantic layer for consistent, reusable metric definitions
- AI-assisted data exploration for self-service analytics
- No data copying — queries run directly against your ClickHouse instance
What users say about Holistics
What really stands out to me is the support. I've never had this kind of help from a BI vendor before. Most of the time, I get support from people who work on the product. They reply fast, they know what they're doing, and they even suggest better ways of solving problems. — G2 Review
Pricing
Team-based pricing with tiers based on usage and features. Contact Holistics for current plan details.
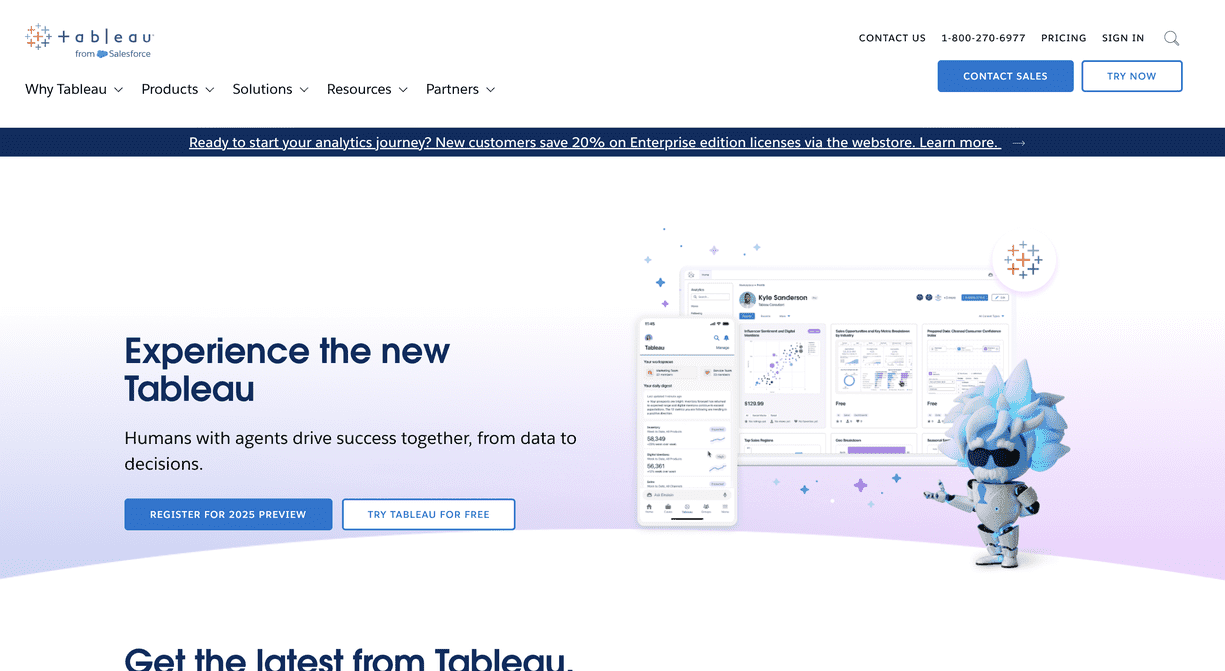
6. Tableau: Enterprise-grade visualization for analyst-driven ClickHouse workflows
Best for
Large organizations with dedicated BI analysts who need sophisticated visualizations and governance at scale, connected to ClickHouse.
Tableau is one of the most feature-complete visualization platforms available, and it supports ClickHouse connectivity for teams that need advanced analytical depth. Tableau's drag-and-drop interface allows analysts to build complex, multi-layer visualizations that go beyond what most lightweight dashboard tools support. Combined with ClickHouse's fast query performance, analysts can explore very large datasets interactively without long wait times.
Tableau is better suited to organizations with dedicated BI resources rather than small or fast-moving product teams. The platform requires setup, often needs modeling, and involves significant licensing costs. For teams with those resources, though, it delivers powerful exploration, governance, and enterprise sharing that few tools can match.
Key features
- Advanced drag-and-drop visualization builder with extensive chart types
- Tableau Prep for data modeling and transformation before visualization
- Strong enterprise governance, access controls, and audit logging
- Connects to ClickHouse for fast analytical queries at scale
What users say about Tableau
What I like best is Tableau's design philosophy — it emphasizes data exploration and visual storytelling over just rigid reporting. Once you connect it to a fast backend like ClickHouse, the interactive exploration feels seamless even on large datasets. — G2 Review
Pricing
Premium pricing tailored toward enterprise and team deployments. Tableau Creator plans start at approximately $75/user/month.
Implementing your ClickHouse reporting tool effectively
Choosing the right ClickHouse reporting tool is only half the job. A tool can give you clean dashboards and powerful querying, but it won't deliver value on its own. Like any part of your product or analytics stack, success depends on how well you implement it and how quickly your team starts using it.
Here's how to get the most out of whichever ClickHouse reporting tool you choose.
1. Onboarding your team
Invest time in proper onboarding. Developers, product managers, data analysts, and support teams should understand how the tool works from the start. A focused onboarding session prevents future bottlenecks, avoids misconfigurations that lead to bad data, and ensures that the people closest to the business questions know how to find answers themselves.
2. Start with a pilot
Instead of rolling dashboards out to everyone at once, start with a small group. A controlled pilot helps you validate metrics, refine permissions, and confirm that the dashboards you've built actually answer the questions teams have. For ClickHouse in particular, this is a good time to identify which tables, materialized views, or aggregation structures your reporting tool should query to keep dashboards fast.
3. Collect feedback continuously
Reporting is not a "set it and forget it" system. Once dashboards go live, actively ask your users — internal or customer-facing — what works and what needs improvement. As your ClickHouse schema evolves, your reporting layer should evolve alongside it.
4. Monitor performance and usage
Track how often dashboards are viewed, which queries run most frequently, and which reports are ignored. ClickHouse's query log makes this especially easy — you can see exactly which dashboard queries hit which tables and how long they take. If certain queries slow down as data grows, adjust them to hit materialized views or add the right aggregation layers.
Conclusion
The ClickHouse reporting tool you choose becomes part of how your team and your customers understand data. It shapes whether insights are slow and manual or fast and accessible. It determines whether non-technical teammates can explore data themselves or have to wait for a developer to run a query.
ClickHouse's raw performance is only as useful as your ability to surface it clearly. If you want a reporting layer that works naturally with ClickHouse — without extra pipelines, warehouses, or modeling overhead — tools like Draxlr help you ship dashboards quickly while keeping your stack simple. Whether you need internal visibility, customer-facing analytics, or embedded dashboards inside your product, the right tool should let you move fast without sacrificing clarity or data integrity.
If you'd like to explore a ClickHouse-native approach to dashboards and reporting, you can try Draxlr and see how it fits your workflow.
FAQs
1. What is a ClickHouse reporting tool?
A ClickHouse reporting tool connects directly to your ClickHouse database and lets you build dashboards, charts, and reports without writing SQL for every question. These tools help teams explore live data safely and share insights without setting up ETL pipelines or additional infrastructure.
2. Can I build customer-facing dashboards on top of ClickHouse?
Yes. Several reporting tools support embedding dashboards inside your product with ClickHouse as the backend. Look for options like secure embed tokens, row-level filtering for multi-tenant applications, and styling controls so the dashboards match your product's UI. ClickHouse's query concurrency makes it a strong backend for serving many simultaneous embedded dashboard users.
3. Does ClickHouse have built-in reporting or dashboarding?
ClickHouse includes a Play UI and SQL console suitable for development and exploration, but it's not designed for ongoing team reporting or dashboards. Dedicated reporting tools are needed for repeatable, shareable analytics.
4. Is it safe to connect a reporting tool directly to ClickHouse?
Yes, as long as the tool uses secure connections, respects your ClickHouse user permissions, and supports row-level access controls when embedding dashboards. Most modern reporting tools offer these safeguards. Avoid tools that require exporting or duplicating your ClickHouse data outside your infrastructure.
5. Can non-technical users work with ClickHouse reporting tools?
Yes. Choose a tool that offers visual query builders, saved reports, dashboard filters, and easy sharing so non-technical users can explore ClickHouse data without writing SQL. AI text-to-SQL features make this even more accessible.
6. Do I need to model my ClickHouse data before using a reporting tool?
Not necessarily. Many reporting tools connect directly to raw ClickHouse tables and materialized views without requiring a separate modeling layer. That said, if you want reusable, governed metrics across many dashboards, a tool with a semantic layer — like Holistics — can be worth the extra setup.
About the author

Vivek is a coder and the founder of Draxlr who cares deeply about building good products. He works at the intersection of AI, SQL, dashboards, and embedded analytics, with a strong focus on making complex data workflows feel simple, useful, and fast for real teams.
If you have questions about anything in this guide, or want to compare options for your specific stack, you can email Vivek at vivek@draxlr.com, try Draxlr free, or reach out directly through the Draxlr team.