Best BigQuery Reporting Tools
Looking for BigQuery reporting tools? Explore the best options for dashboards, analytics, and internal reporting on your BigQuery data.

BigQuery is one of the most powerful cloud data warehouses available — serverless, massively scalable, and built for analytical queries across billions of rows. But storing and querying data is only part of the equation. Once your team starts running analyses in BigQuery, the next question quickly becomes: how do you turn those results into dashboards, share insights across your organization, and report on data without writing SQL every time?
Engineering and data teams often start by building dashboards themselves — pulling results from BigQuery, writing frontend components, and wiring up charts. That process works initially, but it rarely stays manageable. Queries evolve, schema changes break charts, and nontechnical teammates end up dependent on engineering for every data question. What starts as a weekend project becomes a maintenance burden.
BigQuery reporting tools solve this by sitting between your warehouse and your team. They connect directly to BigQuery, allow you to build reusable dashboards and queries, and make data accessible without engineering involvement for every request. Whether you need internal visibility, customer-facing analytics, or embedded dashboards inside your product, the right tool eliminates the need to build and maintain your own reporting layer.
In this article, we break down the most reliable BigQuery reporting tools worth considering for 2026.
What are BigQuery reporting tools?
BigQuery reporting tools are analytics and dashboarding platforms that connect directly to your BigQuery data warehouse and let teams build charts, dashboards, and automated reports without running SQL queries manually for every request. Instead of exporting data or duplicating it into another system, these tools query BigQuery in place — keeping your data live, consistent, and governed by the same access controls your warehouse already enforces.
For teams working at scale, this matters. BigQuery is designed to handle massive datasets efficiently, and the best reporting tools take advantage of that by pushing queries down to the warehouse rather than extracting data into a separate engine. This approach avoids data staleness, eliminates redundant storage costs, and ensures every dashboard reflects the most current state of your data.
How to choose a BigQuery reporting tool
Choosing the right BigQuery reporting tool depends on the goals your team is optimizing for. A startup that wants quick internal dashboards will have very different priorities than a SaaS company embedding analytics inside a customer-facing product.
Start by identifying your primary goal.
1. If your goal is internal reporting for your team
Look for a tool with strong SQL support, a visual query builder, and straightforward sharing. You want dashboards your team can actually use without engineering involvement on every question.
2. If your goal is customer-facing analytics
Prioritize embeddability, row-level filtering for multi-tenant applications, and white-label controls. Your customers should experience analytics that feel native to your product.
3. If your goal is replacing an existing analytics stack
Look for tools with flexible permissions, reusable metric definitions, scheduling, and scalable embedding. These features streamline your entire analytics layer rather than just adding another chart-building tool.
4. If your goal is minimal engineering involvement
Pick a tool that gives product managers, operations teams, and business analysts the ability to explore BigQuery data independently. Features like visual query builders, AI text-to-SQL, and saved reports reduce the number of ad-hoc requests engineers get pulled into.
The right BigQuery reporting tool depends on whether you're optimizing for speed, customer experience, or long-term scalability.
Key features to look for in BigQuery reporting tools
Not every reporting tool handles BigQuery equally well. Some are designed for general SQL databases and treat BigQuery as an afterthought. Others are built with cloud data warehouses in mind and take full advantage of BigQuery's performance. Here's what to evaluate when comparing your options.
1. Native BigQuery compatibility
Your reporting tool should connect directly to BigQuery using your existing project credentials — no ETL pipelines, no data duplication, and no separate storage layer. Native support means:
- Queries push down to BigQuery's execution engine
- No data movement or sync delays
- Consistent access controls
- No duplicate storage costs
Tools that extract data before rendering dashboards will slow you down and undermine the scale advantages BigQuery provides.
2. Ease of dashboard building
Most teams using BigQuery don't have dedicated BI analysts managing every dashboard. Look for features that make reporting accessible:
- Visual query building
- Text to SQL AI
- Reusable charts and saved queries
- Filters and drill-down controls
- Clear layout and sharing options
Anyone on your team should be able to answer basic data questions without writing SQL or depending on engineering.
3. Embeddability (for customer-facing dashboards)
If you're building analytics into your product, choose a tool designed for embedded analytics. Key requirements include:
- Secure, stateless embed tokens
- Row-level filtering for multi-tenant applications
- White-label styling controls
- SDK components for React and Vue
Customer-facing dashboards should feel like part of your product, not an iframe dropped on top of it.
4. API access for automation
BigQuery teams often automate workflows — scheduled reports, data alerts, query triggers, and embedding logic. An API-first reporting tool lets you:
- Control reports programmatically
- Integrate with your authentication layer
- Automate recurring queries and exports
- Trigger alerts when data crosses a threshold
Developers should be able to manage reporting via API just like any other part of their stack.
5. Data security and access control
BigQuery holds your most sensitive analytical data. Your reporting tool needs to respect that. Important security features include:
- No data copying outside your warehouse
- User and team-scoped dashboard permissions
- Secure embed tokens with user context
- Self-host option for sensitive environments
Access control is not an optional feature — it's foundational.
6. Documentation, support, and reliability
Reporting tools get implemented under time pressure and often by teams without dedicated BI resources. Good documentation, responsive support, and a stable, performant UI save hours when things go wrong.
Pick a tool that won't leave you debugging dashboards when your team needs answers.
The best BigQuery reporting tools to consider in 2026
Without further delay, here's a breakdown of the top BigQuery reporting tools worth exploring in 2026 and beyond.
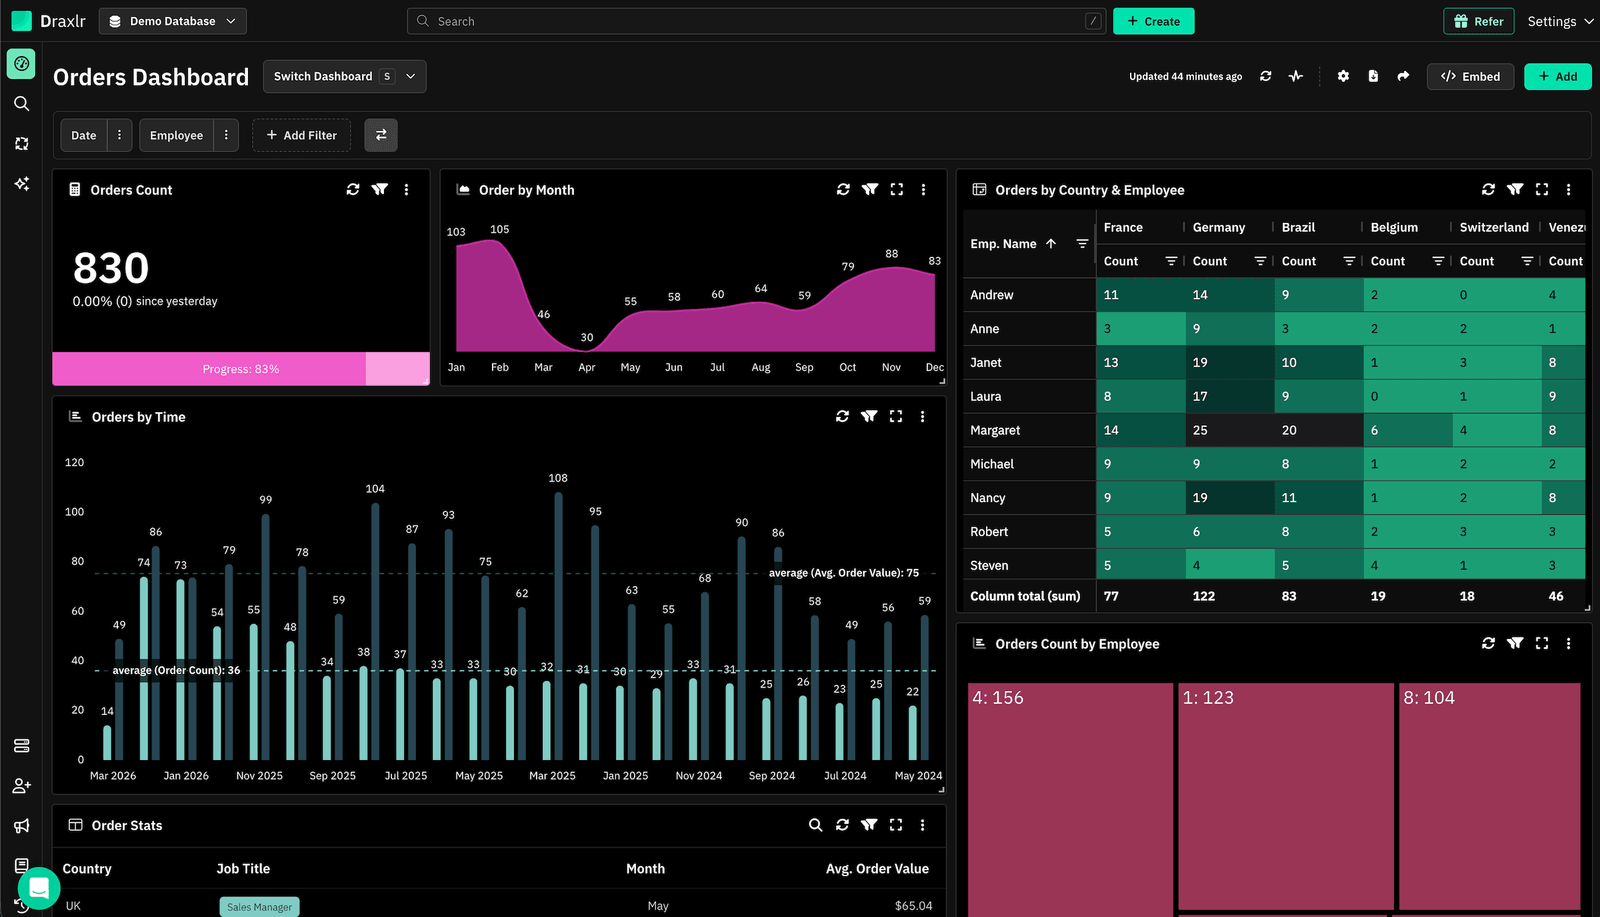
1. Draxlr: Best BigQuery reporting tool for dashboards, team insights, and embedded analytics
Best for
SaaS teams and data analysts using BigQuery who want a fast, reliable way to build dashboards, share reports, and deliver embedded analytics without adding a complex BI stack.
Connect your DatabaseDraxlr connects directly to BigQuery and gives teams a clean interface for creating reports, running SQL, and building dashboards without setup overhead. It's built for modern data-driven products — helping teams ship reporting fast whether the goal is internal visibility or customer-facing analytics embedded inside an app.
For technical users, Draxlr provides full SQL control, virtual columns, filters, drill-through features, and database-aware autocomplete tuned for BigQuery's SQL dialect. For nontechnical teammates, the visual query builder and AI text-to-SQL make it easy to explore data without touching the SQL editor. You can build BigQuery dashboards with interactive charts, define dashboard-level filters that control multiple charts simultaneously, and drill into specific segments with a single click.
If your product includes customer analytics, Draxlr supports secure embedded dashboards with row-level filtering, white-label options, and React/Vue components that integrate naturally into your application. You can pass customer context at embed time to ensure each user sees only their own data. Teams can also automate reporting with scheduled email reports, Slack alerts, and CSV/Excel exports.
Draxlr runs on your existing BigQuery infrastructure — no pipelines, additional warehouses, or modeling layers required.
Key features
- Connects directly to BigQuery with no ETL or data movement
- Visual Query Builder, full SQL editor, and AI Chat for text-to-SQL
- Dashboard builder with filters, drill-through, and virtual columns
- Embedded dashboards with secure tokens, row-level filters, and white-label controls
- React and Vue SDKs for in-product analytics
- Export options (CSV, Excel, PDF) and scheduled reports via Slack or email
- Team-level permissions for safe access to warehouse data
- Supports both internal reporting and customer-facing analytics from a single workspace
What users say about Draxlr
Draxlr offers a clean, modern interface and makes it incredibly easy to build dashboards — even for non-technical users. I especially like the visual quality and flexibility of the available graph types. It's intuitive, fast to set up, and has excellent usability from the start. The ability to securely share dashboards via link is a game-changer for our client reporting. — Review from a SaaS Founder on G2
Pricing
Draxlr offers multiple plans depending on team size, embedding needs, and data volume. Pricing starts at $75/month.
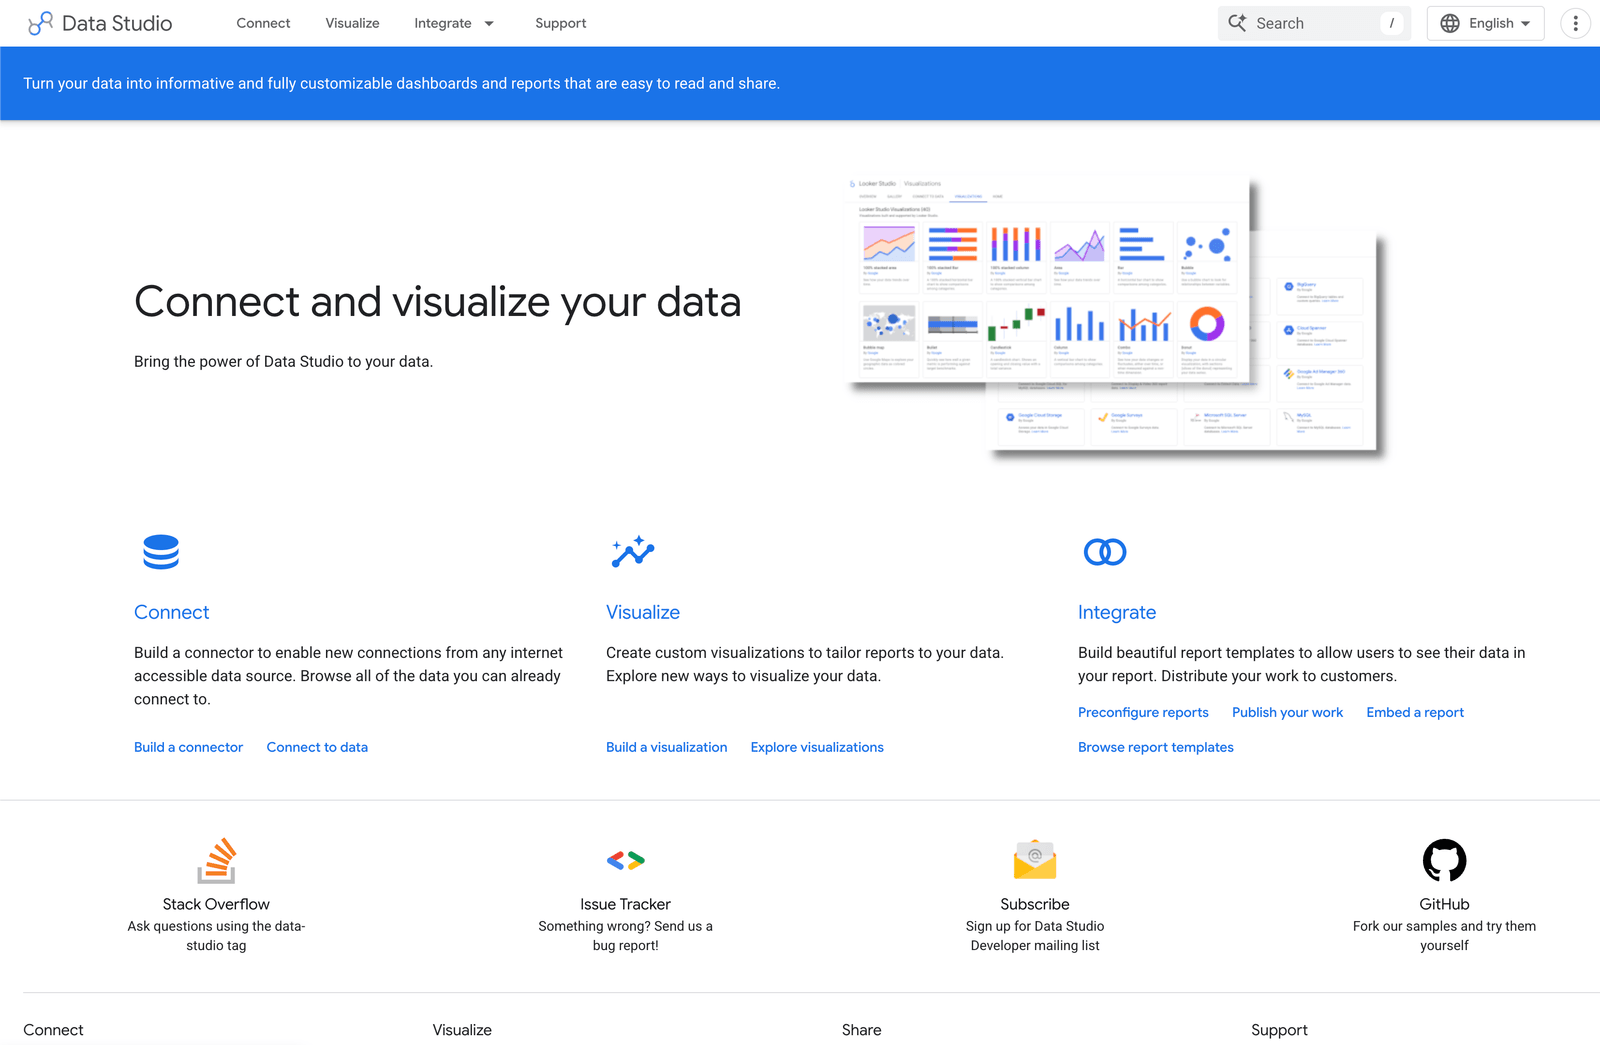
2. Looker Studio: Best free BigQuery reporting tool for Google-native teams
Best for
Teams already in the Google ecosystem who want a free, browser-based reporting tool with a native BigQuery connector and no infrastructure to manage.
Looker Studio (formerly Google Data Studio) is Google's free BI and reporting platform, and it has the tightest native integration with BigQuery of any tool on this list. Authentication happens through your Google account, queries run directly on BigQuery using its execution engine, and the tool supports BigQuery BI Engine acceleration for sub-second dashboard loading on frequently queried data.
The editing experience is browser-based and drag-and-drop, making it accessible to nontechnical users. You can connect to GA4, Google Ads, Google Sheets, and BigQuery from a single workspace. Dashboards can be shared freely across your organization. Looker Studio Pro, at $9/user/month, adds enterprise features like team workspaces, scheduled delivery, and dedicated support.
The main limitations are its lack of native row-level security, no built-in alerting, and performance that can degrade on complex or high-volume BigQuery queries. For teams that need embedding, multi-tenant support, or advanced permissions, it falls short.
Key features
- Native BigQuery connector with direct query execution — no ETL required
- BigQuery BI Engine support for accelerated dashboard loading
- Drag-and-drop report builder accessible to nontechnical users
- Integrations with GA4, Google Ads, Sheets, and 800+ data sources via connectors
- Free base tier; Looker Studio Pro at $9/user/month for enterprise controls
What users say about Looker Studio
Looker Studio makes it incredibly easy to build interactive, shareable dashboards and reports — all without coding. The native connectors including BigQuery and Google Analytics work seamlessly out of the box.
Pricing
Free. Looker Studio Pro is $9/user/month. Note that BigQuery query costs ($6.25/TiB processed after the free tier) apply separately.
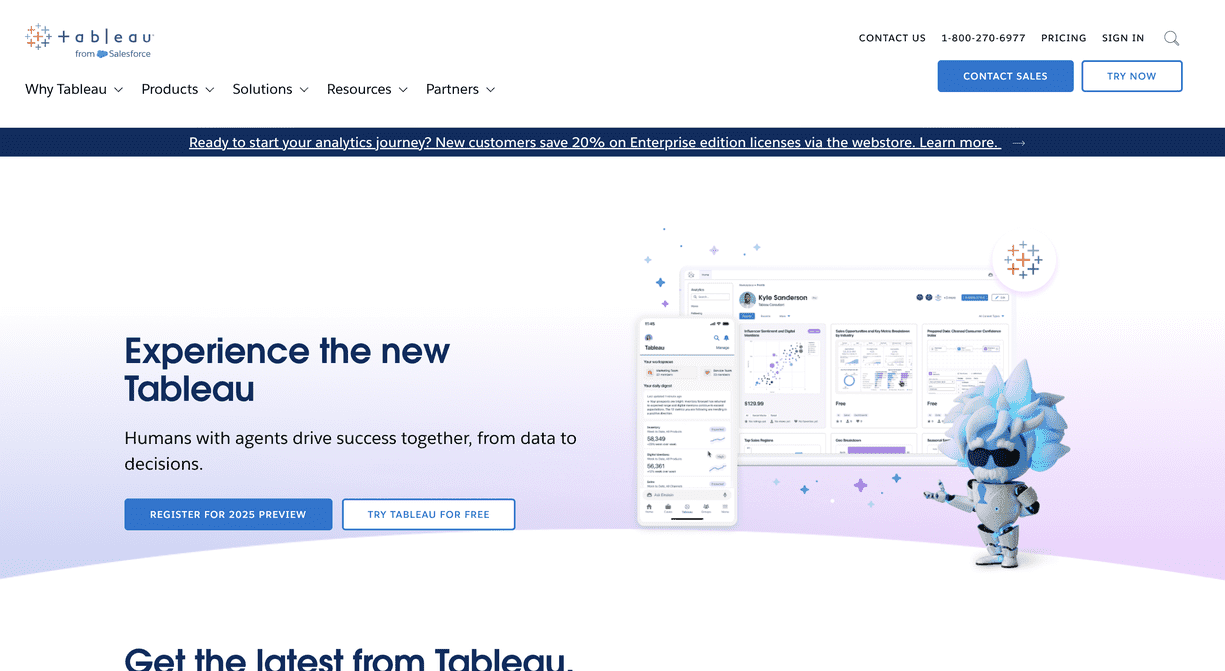
3. Tableau: Best BigQuery reporting tool for advanced data visualization
Best for
Organizations that need sophisticated visualizations, analyst-driven workflows, and have the BI resources to manage a full-featured enterprise platform.
Tableau connects to BigQuery using a native JDBC connector and offers one of the most comprehensive visualization libraries in the market — 80+ chart types, advanced mapping, and statistical analysis functions. For teams that need complex analytical exploration across large datasets, Tableau's depth is hard to match.
The trade-off is complexity and cost. Tableau requires meaningful setup, modeling, and BI analyst expertise to get the most out of. For fast-moving SaaS teams or companies without dedicated BI staff, the operational overhead often outweighs the visualization benefits. It's a strong fit for enterprise teams that already have BI workflows in place and want to point them at BigQuery.
Tableau also offers Tableau Cloud for managed hosting and Tableau Server for on-premises deployments, giving organizations flexibility over their data governance model.
Key features
- Native BigQuery JDBC connector with live query support
- 80+ chart types including advanced maps, statistical charts, and custom visuals
- Tableau Prep for data modeling and transformation before dashboarding
- Tableau Cloud and Tableau Server deployment options
- Enterprise governance, row-level security, and version control
What users say about Tableau
What I like best about Tableau is its design philosophy — it emphasizes data exploration and visual storytelling over rigid reporting. The depth of visualization options means I can always find the right way to present our BigQuery data.
Pricing
Tableau Creator licenses start at $75/user/month. Explorer and Viewer tiers available at lower price points. Enterprise pricing negotiated separately.
4. Metabase: Best open-source BigQuery reporting tool for self-hosted teams
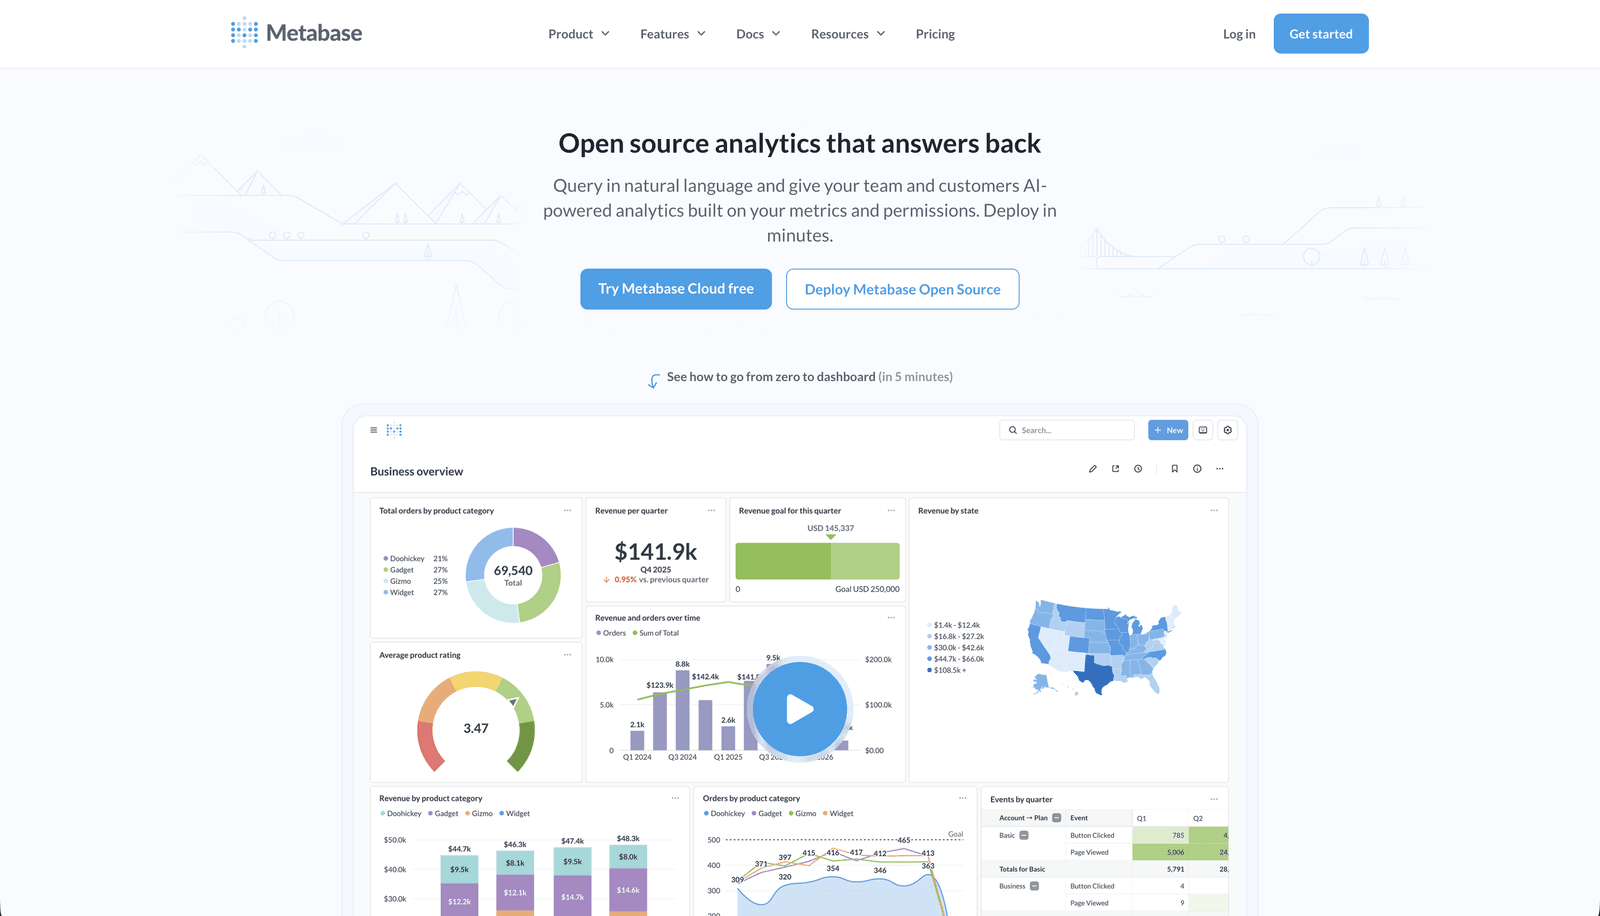
Best for
Engineering-led teams that want an open-source BI tool they can self-host, and that need to make BigQuery data accessible to nontechnical teammates with minimal setup.
Metabase is one of the most widely used open-source BI tools and has solid native BigQuery support. It connects through your BigQuery project credentials and lets both technical and nontechnical users explore data — technical users through a full SQL editor, and nontechnical users through Metabase's "Questions" interface, which generates SQL behind the scenes from a visual query flow.
For teams that want to self-host their analytics layer, Metabase is free and open-source. The hosted cloud version starts at a reasonable price for small teams. Dashboards can be shared internally, scheduled for email delivery, or embedded in external applications using signed URLs. The embedding capability is more limited than purpose-built tools but works for many straightforward use cases.
The main limitation is that Metabase's UX can feel dated for complex analytical work, and the embedded analytics features are less polished than dedicated embedding-focused tools.
Key features
- Native BigQuery connector — no ETL or data movement
- Visual "Questions" builder for nontechnical users alongside a full SQL editor
- Dashboard builder with filters, drill-down, and scheduled reports
- Open-source self-hosted option (free) and Metabase Cloud starting at $85/month
- Embedding via signed URLs for basic customer-facing analytics
What users say about Metabase
I love the Question feature of Metabase, which allows for the creation of no-code SQL queries that can be easily and intuitively answered even by non-technical users. It's great that you can access joinable fields without an active join — this makes it a breeze to create entire dashboards in a short amount of time.
Pricing
Open-source and free to self-host. Metabase Cloud starts at $85/month. Pro and Enterprise tiers available with additional embedding and governance features.
5. Sigma Computing: Best BigQuery reporting tool for business users who want a spreadsheet interface
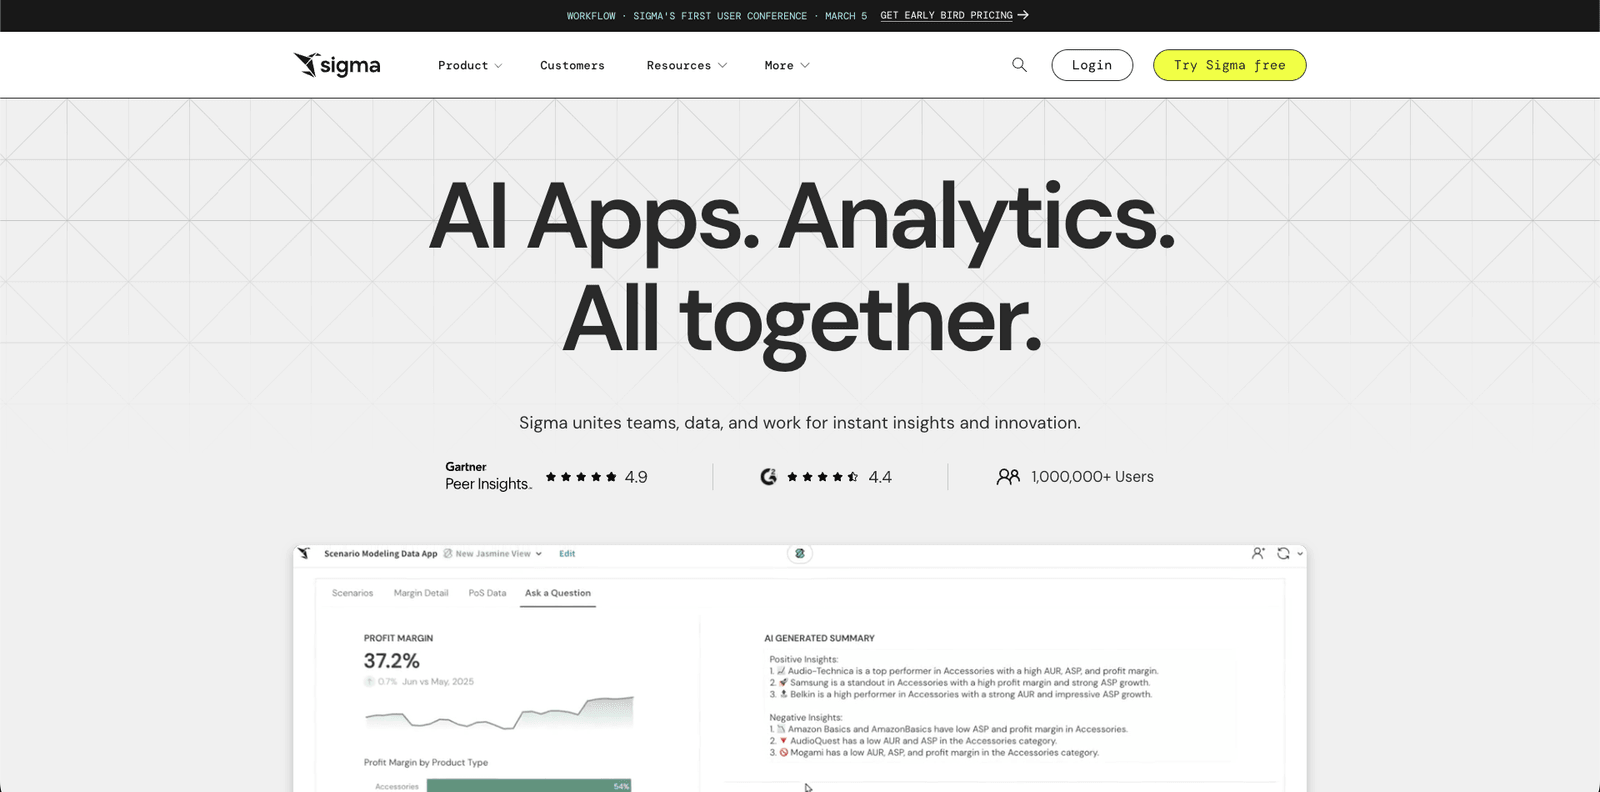
Best for
Data and business teams who want to explore large BigQuery datasets using a familiar spreadsheet interface without needing SQL expertise.
Sigma Computing is a cloud-native analytics platform that connects directly to BigQuery (as well as Snowflake, Redshift, and Databricks) and executes all queries live against the warehouse. What sets Sigma apart is its interface — instead of a dashboard builder or a SQL editor, Sigma presents data in a spreadsheet-style grid that business users find immediately familiar.
This interface is deceptively powerful. Business users can pivot, filter, and aggregate BigQuery data using point-and-click interactions, while data teams can drop into SQL or Python when needed. Sigma also supports dashboard publishing, data applications, and embedded analytics. For organizations with large business user populations that need BigQuery access, the unlimited viewer model on some plans provides strong value.
Performance can be uneven on very large tables or complex queries, and costs can escalate without careful query governance. But for teams where analyst-to-business-user collaboration is the priority, Sigma's interface reduces the barrier to BigQuery exploration significantly.
Key features
- Native BigQuery connection with live query push-down — no data extraction
- Spreadsheet-style interface for business users alongside SQL and Python editors
- Dashboard publishing and embedded analytics support
- Unlimited viewers on Essentials and higher plans
- Native AI features for automated insights and query assistance
What users say about Sigma Computing
I like Sigma's spreadsheet interface — it makes it easy for me to explore data without needing advanced technical skills, and it integrates well with cloud data warehouses like BigQuery. Even without SQL expertise, I can answer complex questions about our data.
Pricing
Essentials starts at $300/month with unlimited users. Professional and Enterprise tiers are custom-priced.
6. Holistics: Best BigQuery reporting tool for SQL-centric data teams with a modeling workflow
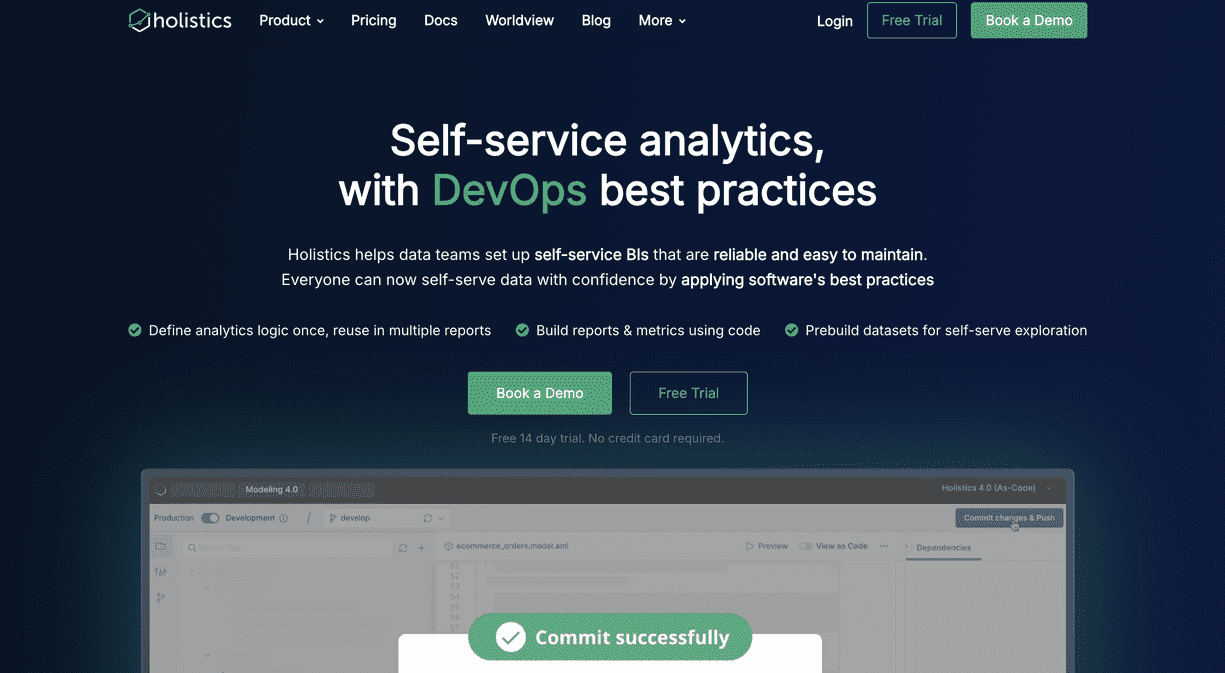
Best for
Data teams that want a code-based, model-driven BI workflow — central metric definitions, Git integration, and reusable datasets — built on top of BigQuery.
Holistics connects natively to BigQuery and takes a semantic-layer approach to BI. Rather than building charts directly against raw tables, data teams define metrics, dimensions, and relationships in a central modeling layer using Holistics' analytics-as-code framework. Those definitions are version-controlled in Git and reused across dashboards — meaning metrics stay consistent organization-wide.
For organizations that care about data governance, reproducibility, and avoiding the "which dashboard is correct" problem, Holistics' approach is compelling. Business users get clean, governed dashboards without needing to understand raw schema. Data teams maintain a single source of truth. The tool also supports scheduled email reports, Slack integrations, and self-service exploration through a visual query builder.
The trade-off is the upfront investment in modeling. Teams that want to connect BigQuery and build dashboards immediately will find Holistics slower to get started with than tools like Draxlr or Looker Studio. But for mature data teams managing a growing BI stack, the governance model pays off.
Key features
- Native BigQuery connector with SQL pass-through support
- Analytics-as-code semantic modeling layer with Git integration
- Reusable metric and dimension definitions across dashboards
- Scheduled email reports and Slack-based alerts
- Visual query builder for business users on top of the governed data model
What users say about Holistics
Out of all BI tools we explored, Holistics hit the sweet spot. It was the most robust and user-friendly — and they support SQL pass-throughs. We were able to build reports in a fraction of the time it took with Tableau. — Capterra review
Pricing
Holistics offers team-based pricing with tiers based on usage and feature requirements. Contact their team for current pricing.
Implementing your BigQuery reporting tool effectively
Choosing the right BigQuery reporting tool is only half the job. A tool can give you clean dashboards and powerful querying, but without a thoughtful rollout, adoption will stall and the investment won't deliver value. Here's how to get the most out of whichever tool you choose.
1. Onboard your team properly
Invest time in proper onboarding before handing tools to the full team. Developers, product managers, analysts, and operations staff all have different mental models for working with data. A short, focused kickoff session prevents future bottlenecks, avoids permission misconfigurations, and ensures users build dashboards against the right tables.
2. Start with a pilot
Roll out dashboards to a small group first rather than the entire organization. A controlled pilot helps you validate that queries run efficiently against BigQuery, that permissions are configured correctly, and that the dashboards actually answer the questions your team is asking. It's faster to refine a small set of dashboards than to fix issues at scale.
3. Collect feedback continuously
Reporting is not a "set it and forget it" system. Once dashboards go live, actively ask your users — internal or customer-facing — what works and what needs improvement. As your BigQuery schema evolves and your product grows, your reporting layer needs to keep up.
4. Monitor performance and query costs
BigQuery charges per byte scanned, so the reporting tools and queries you deploy have a direct impact on cost. Monitor which dashboards are running expensive queries, which reports are unused, and where performance can be improved through caching or query optimization. Understanding usage patterns helps you manage both cost and user experience over time.
Conclusion
The BigQuery reporting tool you choose shapes how your team interacts with data — and for products with customer-facing analytics, it shapes how your users understand their own results. It needs to perform reliably at the query volumes BigQuery enables, fit the technical capabilities of the people using it, and deliver a clear, consistent experience whether it's powering internal dashboards or embedded inside your product.
If you want a reporting layer that works naturally with BigQuery without extra infrastructure, pipelines, or a complex modeling setup, tools like Draxlr help you ship dashboards quickly while keeping your stack simple. Whether you need internal visibility, embedded analytics, or customer-facing dashboards, the right BigQuery reporting tool should help you move fast without compromising on data accuracy or user experience.
If you'd like to explore a BigQuery-native approach to dashboards and reporting, you can try Draxlr and connect your warehouse in minutes.
FAQs
1. What is a BigQuery reporting tool?
A BigQuery reporting tool connects directly to your Google BigQuery data warehouse and lets you build dashboards, charts, and reports without writing SQL for every request. These tools help teams explore live warehouse data safely, share insights across the organization, and automate recurring reports — without needing to set up ETL pipelines or duplicate data.
2. Can I build customer-facing dashboards with BigQuery data?
Yes. Several BigQuery reporting tools support embedding dashboards inside your product. Look for options with secure embed tokens, row-level filtering for multi-tenant applications, and white-label styling so the analytics feel native to your app rather than like a third-party add-on.
3. Does BigQuery have built-in reporting or dashboarding?
BigQuery includes a SQL editor and basic data exploration in the Google Cloud Console, but it's not designed for dashboards or repeatable reporting for business users. Looker Studio is Google's free dashboarding layer for BigQuery, though purpose-built tools like Draxlr offer more flexibility for product and team analytics use cases.
4. Is it safe to connect a reporting tool directly to BigQuery?
Yes, as long as the tool uses secure credential management, respects your IAM roles, and supports user-scoped filtering when embedding dashboards. Avoid tools that require exporting or duplicating your BigQuery data into a separate storage layer — this creates unnecessary cost and data governance risk.
5. Can non-technical team members use BigQuery reporting tools?
Yes. Several tools are specifically designed to make BigQuery data accessible without SQL knowledge. Look for visual query builders, AI text-to-SQL features, saved report templates, and easy sharing — so product, operations, and support teams can explore data without developer involvement.
6. Do I need to move my data out of BigQuery to use a reporting tool?
No. The best BigQuery reporting tools query your data warehouse directly without extracting, copying, or moving data. This keeps your dashboards live, avoids double storage costs, and ensures that permissions and governance policies remain consistent with your BigQuery setup.
About the author

Vivek is a coder and the founder of Draxlr who cares deeply about building good products. He works at the intersection of AI, SQL, dashboards, and embedded analytics, with a strong focus on making complex data workflows feel simple, useful, and fast for real teams.
If you have questions about anything in this guide, or want to compare options for your specific stack, you can email Vivek at vivek@draxlr.com, try Draxlr free, or reach out directly through the Draxlr team.