What Is Metabase? A Detailed Guide for SaaS Teams
What is Metabase and how does it work for embedded analytics? A detailed look at pricing, features, real user feedback, and when Metabase is or is not the right fit for SaaS teams.

Metabase has become one of the default choices for teams that want BI capability, largely because of its free open source tier and accessible no-code builder. That accessibility comes with real trade-offs once the use case shifts from internal reporting to customer-facing embedded analytics. Some users report slower load times with large datasets and limited visual customization options, and interactive embedding introduces a per-user cost that grows with every signed-in customer.
This guide breaks down how Metabase actually works, what it costs at each tier, and when it is or is not the right fit for SaaS teams building embedded analytics.
Stop paying per viewer. Try a Metabase alternative that gives your customers fully interactive white-labeled dashboards at a flat monthly rate from $75/month.
Try Draxlr today →What is Metabase?
Metabase is an open source data visualization and business intelligence platform that lets teams connect to a database and explore data without writing code. It has a free, self-hosted version and paid plans for cloud hosting, white labeling, and embedding.
What distinguishes Metabase from most BI tools is the open source model. Teams can self-host it for free on their own infrastructure and get a fully functional BI tool with no licensing cost. This has made it one of the most widely adopted BI platforms among startups and small teams who need analytics capability without an enterprise BI budget.
Metabase includes a no-code query builder for non-technical users and a full SQL editor for advanced users, which means both a product manager who has never written SQL and a data analyst who wants full control can use the same tool effectively.
What Metabase Offers
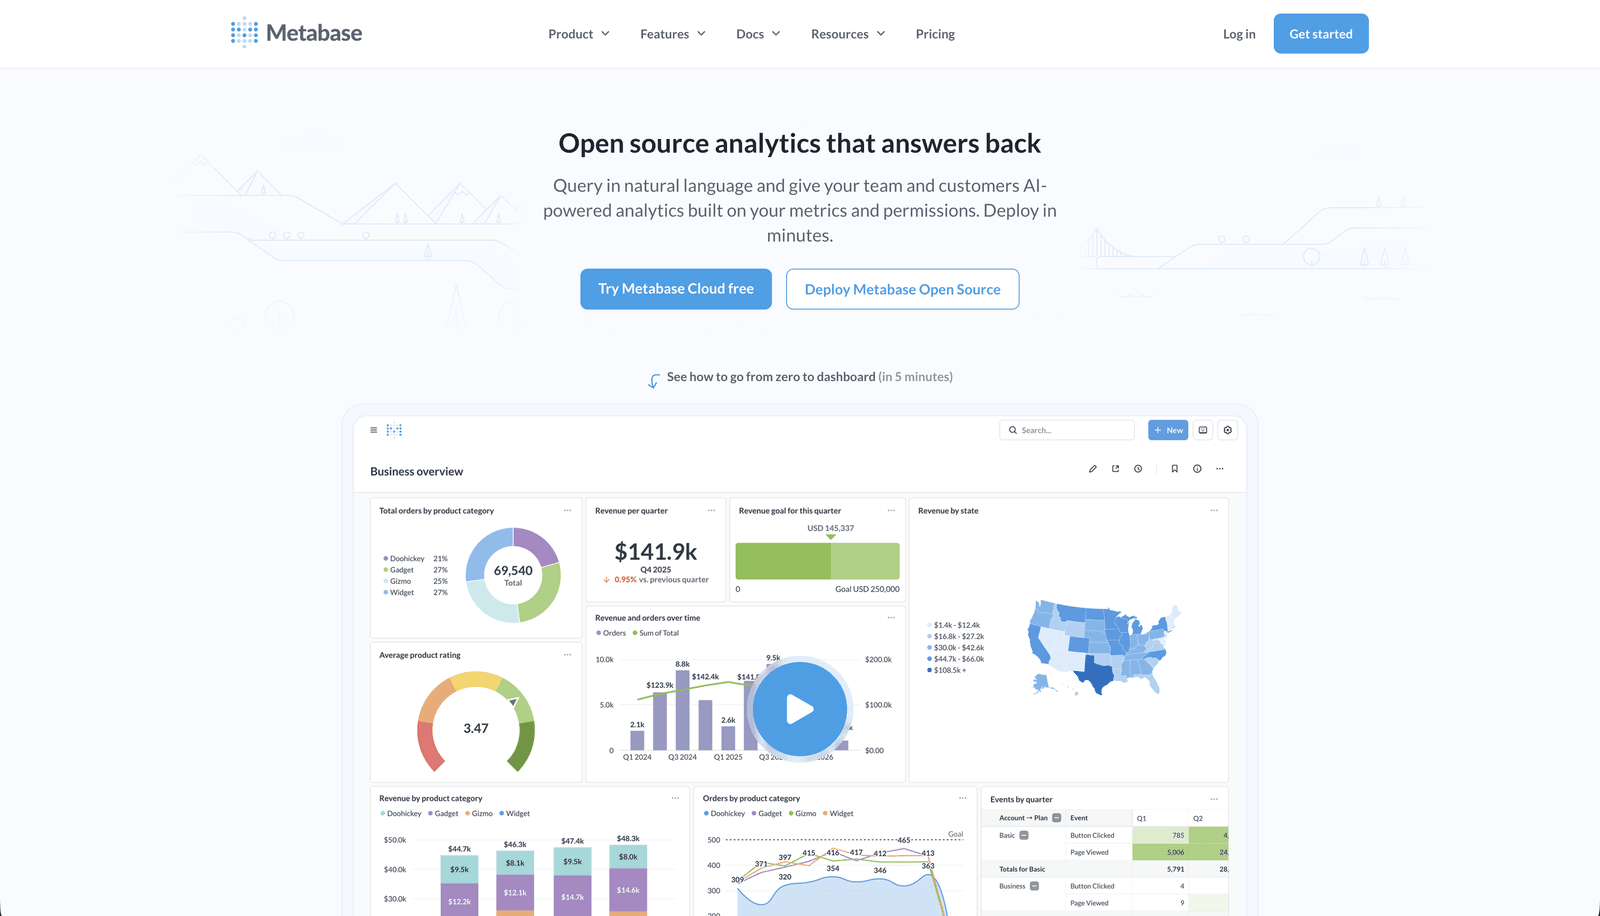
At its core, Metabase gives a team three things. A way to connect to a database and explore it without writing code, a way to turn that exploration into dashboards other people can read, and a way to put those dashboards in front of customers rather than just internal staff.
The first part, exploration, is handled through a no-code query builder for non-technical users, a full SQL editor for analysts and developers, and Metabot, an AI assistant that builds charts and SQL from a plain English question. The second part, sharing, covers dashboards, scheduled reports, and alerts that notify someone when a metric crosses a threshold. The third part, embedding, is what turns an internal BI tool into a customer-facing one, letting a SaaS product show a dashboard inside its own interface rather than sending users somewhere else.
Underneath all three is a permissions layer that decides who sees what, which is what makes it possible to give one dashboard to a hundred different customers and have each of them see only their own data.
How Metabase Works
1. Deployment options
Metabase can be deployed two ways.
- Self-hosting means running Metabase on your own infrastructure using Docker, Kubernetes, AWS, or any server supporting Java applications. This gives full control over data and security.
- Metabase Cloud is the managed hosting alternative, where Metabase handles infrastructure, scaling, and updates for a monthly fee.
2. Connecting to data
Once deployed, Metabase connects to relational databases and data warehouses including PostgreSQL, MySQL, Snowflake, Google BigQuery, Redshift, and ClickHouse, among others. The connection process involves entering database credentials and configuring schema access and caching.
3. Building dashboards
Metabase offers three ways to explore and visualize data.
- The no-code query builder lets non-technical users filter, group, and chart data without writing SQL, which is the entry point most product managers and business users rely on.
- The SQL editor gives developers and analysts full control, including support for variables, joins, and CTEs, with saved queries reusable across dashboards.
- Metabot, Metabase's AI assistant, adds a third path by creating charts and SQL queries directly from natural language questions, analyzing existing charts, and fixing query errors.
Dashboards support standard visualization types including line, bar, and pie charts, tables, heatmaps, and funnels. Users can drill into data, apply filters, and share dashboards through public links or role-based access.
4. Alerts and scheduled reports
Once a dashboard exists, Metabase can keep people updated without anyone checking it manually. Scheduled reports send dashboards or individual charts to email, Slack, or other tools on a recurring basis. Custom alerts trigger a notification when a specific condition is met, for example when daily active users drop below a set threshold. Both run in the background, so a question gets answered automatically the next time the condition is true rather than someone needing to remember to look.
5. Embedding into other applications
For companies building customer-facing analytics, Metabase offers three ways to embed. Public embedding uses a simple iframe-based approach suited for non-sensitive data with no login required. Signed embedding is the secure option, where dashboards are embedded with access controlled through API tokens, and this is the method required for interactive, customer-facing use cases. The newer Metabase SDK is a React-based option that lets developers embed individual components, standalone charts, dashboards, or the query builder itself, rather than only full pages, giving more control over interactivity and theming directly from the application code.
Whichever method is used, multi-tenant access is handled through group-based permissions and row-level security, which restricts data by user attributes so different customers can see different data from the same underlying dashboard. This is the mechanism that makes it possible to serve one dashboard to many customers, each seeing only their own data.
Metabase Pricing
Metabase offers four tiers. The open source self-hosted version is free but displays a "Powered by Metabase" badge on all dashboards including embedded ones, and has no white labeling. The Starter plan adds cloud hosting for a base fee plus a per-user charge, with the first several users included.
The Pro plan is where embedding for customer-facing products becomes viable. It unlocks white labeling and signed, interactive embedding, but introduces a per-user charge for anyone signing in to view interactive embedded dashboards. Static embeds, where customers view dashboards without logging in, do not carry this per-viewer cost but are read-only with no interactivity.
This distinction matters more than it first appears. A SaaS team that wants customers to apply filters, drill into data, or interact with their dashboards needs interactive embedding, which means every signed-in customer counts as a billable user. For a product with hundreds of customers viewing dashboards regularly, that cost compounds quickly. Teams that only need to display fixed, pre-filtered dashboards can use static embedding at no per-viewer cost, but customers lose the ability to interact with their own data.
Enterprise pricing is available for advanced security, SSO, and audit requirements; pricing is available upon request and is not published publicly.
For a full pricing comparison across multiple embedded analytics tools, see the embedded analytics pricing guide.
Key Metabase Features
No-code query builder. Lets non-technical users filter, group, and visualize data through a point-and-click interface without writing SQL.
SQL editor. Gives developers and analysts full native query support, including variables, joins, and CTEs, for cases the query builder cannot handle.
Metabot AI assistant. Generates charts and SQL from natural language questions, explains existing charts, fixes query errors, and can be used through the query builder, the SQL editor, or Slack.
Analytics dashboards. Multiple charts and saved questions can be compiled into a single dashboard with filters that apply across everything on it.
Models. A frequently used table or saved query can be turned into a reusable, named building block, so every chart built on it shares the same definition of a metric like "active customer" or "monthly revenue."
CSV upload. Teams without a connected database can upload and analyze CSV files directly inside the platform.
Drill-through. Clicking into a data point opens a more detailed view of the underlying records without leaving the dashboard or writing a new query.
Scheduled reports and alerts. Dashboards or charts can be sent automatically to email, Slack, or other tools on a schedule, and alerts can trigger a notification when a chosen metric crosses a threshold.
Public and signed embedding. Dashboards can be embedded in another application as a read-only iframe with no login, or as an interactive, access-controlled embed using signed API tokens.
Metabase SDK. A React-based option for embedding individual components, such as a single chart or the query builder itself, with full control over theming and interactivity in code.
Permissions and row-level sandboxing. Access can be restricted at the database, table, or column level, and sandboxing restricts which rows a user can see based on their attributes, which is what makes multi-tenant and embedded use cases possible.
Self-hosting or managed cloud. Metabase can run on infrastructure you control using Docker, Kubernetes, or any Java-compatible server, or as a fully managed cloud instance.
Broad data source support. Connects to relational databases and warehouses including PostgreSQL, MySQL, Snowflake, BigQuery, Redshift, and ClickHouse, among others.
Who Uses Metabase
Startups and small teams. The free open source version gives early-stage companies BI capability without the cost of Looker, Tableau, or Power BI, and the no-code builder makes it accessible without a dedicated analyst.
SaaS and software companies. Used internally for product usage and KPI tracking, and in some cases for embedded analytics, passing dashboards through to end users.
E-commerce businesses. Used to track sales, customer behavior, and inventory trends across multiple connected data sources.
Financial and fintech companies. Used for transaction analysis and compliance dashboards, with self-hosting appealing to teams that need full control over sensitive data.
Healthcare and research organizations. Self-hosting supports data privacy requirements, and granular permissions help manage access to sensitive patient or research data.
What Real Users Say About Metabase
Across G2, Capterra, and independent review sites, the same themes appear consistently across hundreds of reviews.
Users praise the ease of use and intuitive interface, which lets both technical and non-technical users build dashboards and analyze data. The no-code builder is repeatedly cited as accessible to people with no SQL background, and the open source model is valued for being cost-effective.
The most consistent complaint is performance. Users often experience slow loading times, with lag and slow processing speeds reported specifically with large datasets. The second consistent theme is limited customization. Users find that dashboard creation and visualization options need improvement, with several reviewers specifically noting that chart types and formatting controls feel basic compared to enterprise BI platforms.
For embedded and customer-facing use specifically, one founder writing about the topic summarized the trade-off clearly. Metabase has a lot going for it including open-source flexibility, a friendly interface, and quick dashboard setup, but it has trade-offs that matter especially for teams wanting a reliable embedded BI solution for clients. The same analysis pointed to limited white labeling unless on the more expensive Pro or Enterprise tiers as a specific friction point for SaaS teams.
Considerations Before Choosing Metabase for Embedded Analytics
White labeling requires Pro and above. The free and Starter tiers either show Metabase branding or do not support the embedding methods SaaS products typically need. Budget for Pro pricing if white labeling is a requirement, not the entry-tier price.
Interactive embedding has a per-user cost that scales with your customer base. This is the single most important economic factor for SaaS teams. Static embedding avoids the cost but removes interactivity. Interactive embedding restores interactivity but introduces a cost that grows with every new signed-in customer.
When Metabase Makes Sense and When It Does Not
Metabase is a strong choice for internal reporting, startups with limited budgets, and teams comfortable with self-hosting who need flexible SQL-based analysis. The open source model and accessible query builder make it one of the easiest ways to get a capable BI tool running quickly with no license cost.
For embedded analytics specifically, the calculation changes. SaaS teams need to weigh the per-viewer cost of interactive embedding against the predictability of a flat-rate tool, weigh the visual customization ceiling against the importance of dashboard appearance to the product experience, and weigh self-hosting and performance management against the simplicity of a tool built specifically to handle embedding at scale without infrastructure overhead.
Draxlr is built specifically for the embedded analytics use case Metabase was not originally designed around. Embedded dashboards are fully interactive with no customer login required and no per-viewer fee at any scale, white labeling is included from the Premium plan at $75/month, and most teams have their first embedded dashboard live within one to two weeks with no infrastructure to manage.
Draxlr is built specifically for the embedded analytics use case — fully interactive dashboards, white labeling from $75/month, no per-viewer fees.
FAQs
1. Is Metabase free?
Yes, the open source version is free to self-host with no licensing cost. It includes a "Powered by Metabase" badge on dashboards including embedded ones, and does not include white labeling or interactive embedding. Paid plans starting with Starter add cloud hosting, and Pro adds white labeling and interactive embedding.
2. Does Metabase support embedded analytics?
Yes. Metabase supports static embedding, where dashboards display without requiring customer login but are read-only, and interactive embedding, where customers sign in and can filter and explore data but each signed-in user counts as a billable cost on the Pro plan.
3. What is the difference between Metabase static and interactive embedding?
Static embedding requires no customer login and has no per-viewer cost, but the dashboard is read-only with no filtering or drill-down for the customer. Interactive embedding gives customers full interactivity but requires them to sign in to Metabase, with every signed-in customer counted as a billable user.
4. Is Metabase good for SaaS products with customer-facing analytics?
It depends on the requirements. Metabase works for SaaS teams that need basic, low-customer-count embedded dashboards or are comfortable managing self-hosted infrastructure. For SaaS products that need fully interactive dashboards at scale with predictable flat pricing and no per-viewer cost, purpose-built embedded analytics tools are typically a better fit. See the best embedded analytics tools comparison for a full breakdown.
5. What is a good alternative to Metabase for embedded analytics?
Draxlr is a strong alternative for SaaS teams specifically, offering fully interactive embedded dashboards with no customer login required and no per-viewer fee, white labeling included from $75/month, and a one to two week implementation timeline with no infrastructure to self-host or maintain. See the full Metabase alternatives for embedded analytics guide for a detailed comparison.
About the author

Ameena is the founder of Draxlr, a modern business intelligence platform focused on making data analysis simpler and faster. She writes about embedded analytics, databases, SQL, dashboards, and building scalable data products for modern teams.

