Microsoft SQL Server Database to Dashboards
Filter, sort, group, and create graphs and dashboards on your Microsoft SQL databases easily. Setup Slack and email alerts on your Microsoft SQL databases.

Across all domains, be it e-commerce, fintech, or any domain out there, analysing data and drawing conclusions from it is a crucial factor in the growth of any organization. To explore data in meaningful ways, we need to study and make business decisions based on it, not forgetting to do a periodic review of the progress to be in line with how far we have come. Through data analysis, you can be in touch with your customers’ preferences and track your performance against competitors.
Now that we have established how valuable data is as an asset to any organisation, let us dive deeper into how this data is stored and managed and how to make valuable derivations. Data is usually stored in databases, and what database you want for your organisation depends greatly on the kind of data you would be storing.
On a macroscopic level, databases can be relational or non-relational. A relational database consists of tables with rows and columns. For example, in an e-commerce business, a typical client order entry database would contain a table that defines a customer with columns for name, address, phone number, and all the other information needed.
Microsoft SQL is a relational database management system, or RDBMS, developed and marketed by Microsoft. With enhanced performance and low ownership costs, this is one of the favourites of organisations when choosing their database. Before you fret about not knowing how to work with databases, SQL queries, and Microsoft SQL dashboards, we need you to breathe. Sit back and relax, because Draxlr is here to do most of the work on your behalf.
Connecting a Microsoft SQL server with Draxlr
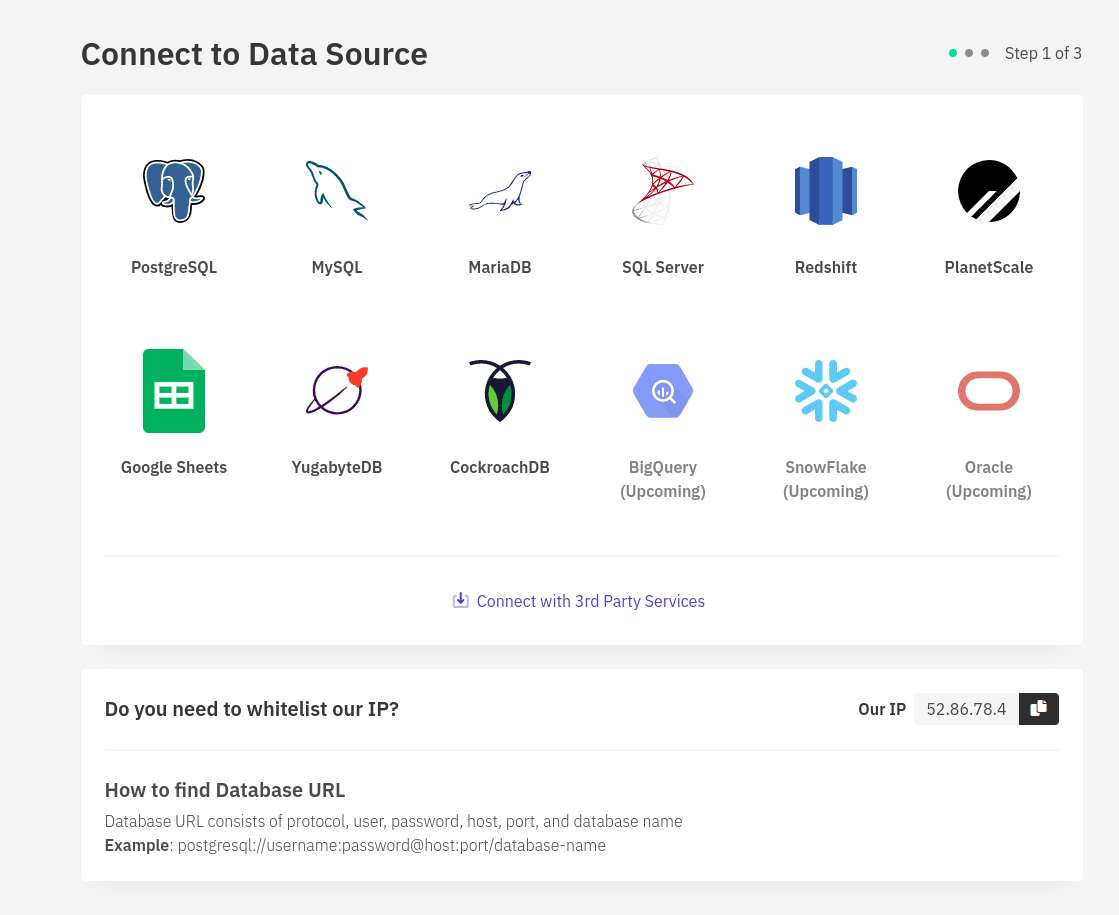
Before analysing data and creating Microsoft SQL dashboards, you would have to connect your database with Draxlr. The first step would be to register on the website here. Depending on the kind of database your organisation has, you can choose from a variety of database types, and you have to select a SQL server.
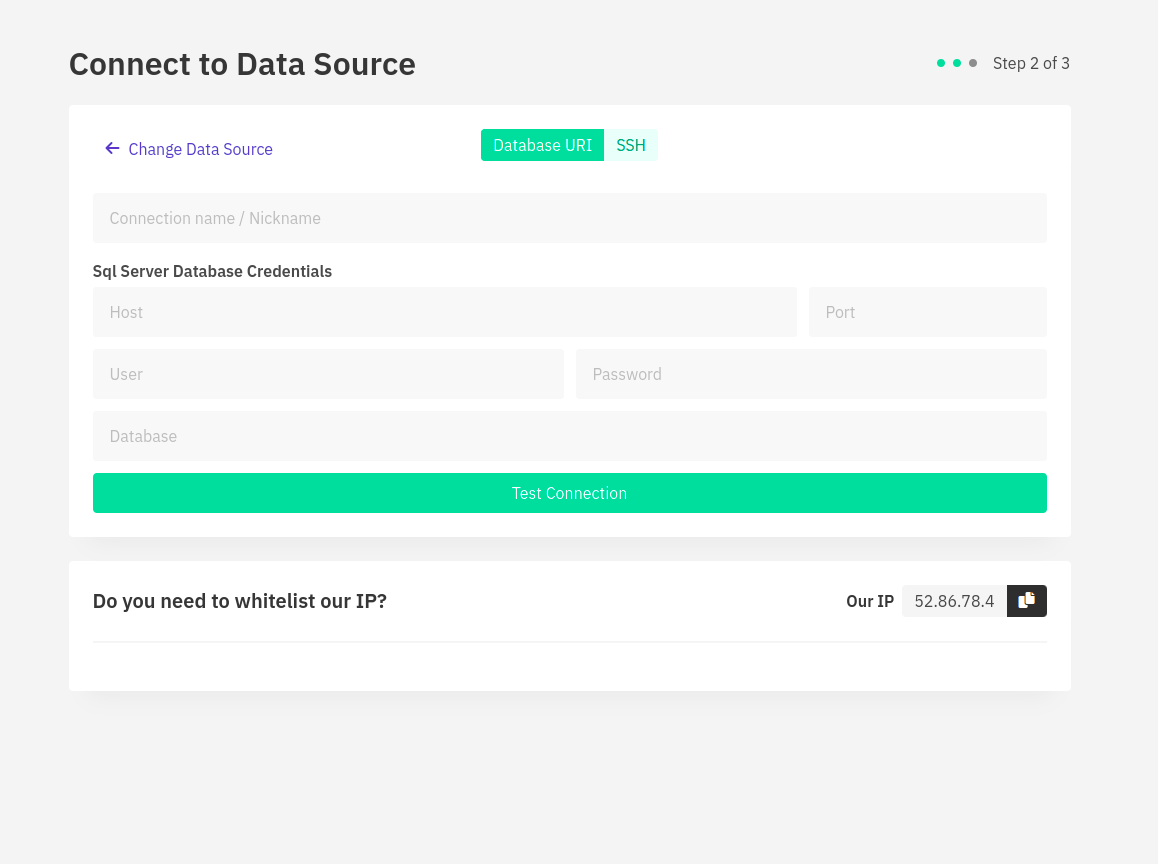
To connect your database with Draxlr, you can provide connection details like your host, port, username, password, and database name. In cases of doubt, you can reach out to your engineers to help you with the connection details. You could also schedule a free call with our team from the settings option on the top right corner, and we would be happy to resolve any queries you might have in the process. Once your connection is verified and ready to use, Draxlr will fetch the tables from your MS SQL database, and you can begin performing the operations listed below. A point to note here is that if your database is private, you will need to get Draxlr’s IP whitelisted so that it can connect to it.
The next step: deep diving into insights
Now that the MS SQL database connection is ready, we can use filters, joins, and other actions on the data to get insights from it. Let us briefly understand the various operations that can be performed on the data:
1. Filtering:
With the huge amount of data that organisations store, filtering comes in very handy because it separates out the necessary data and gives the required output. For example, in an e-commerce company that receives thousands of orders every month, we can simply apply a filter to the month and check how many new orders have come in for that particular month.
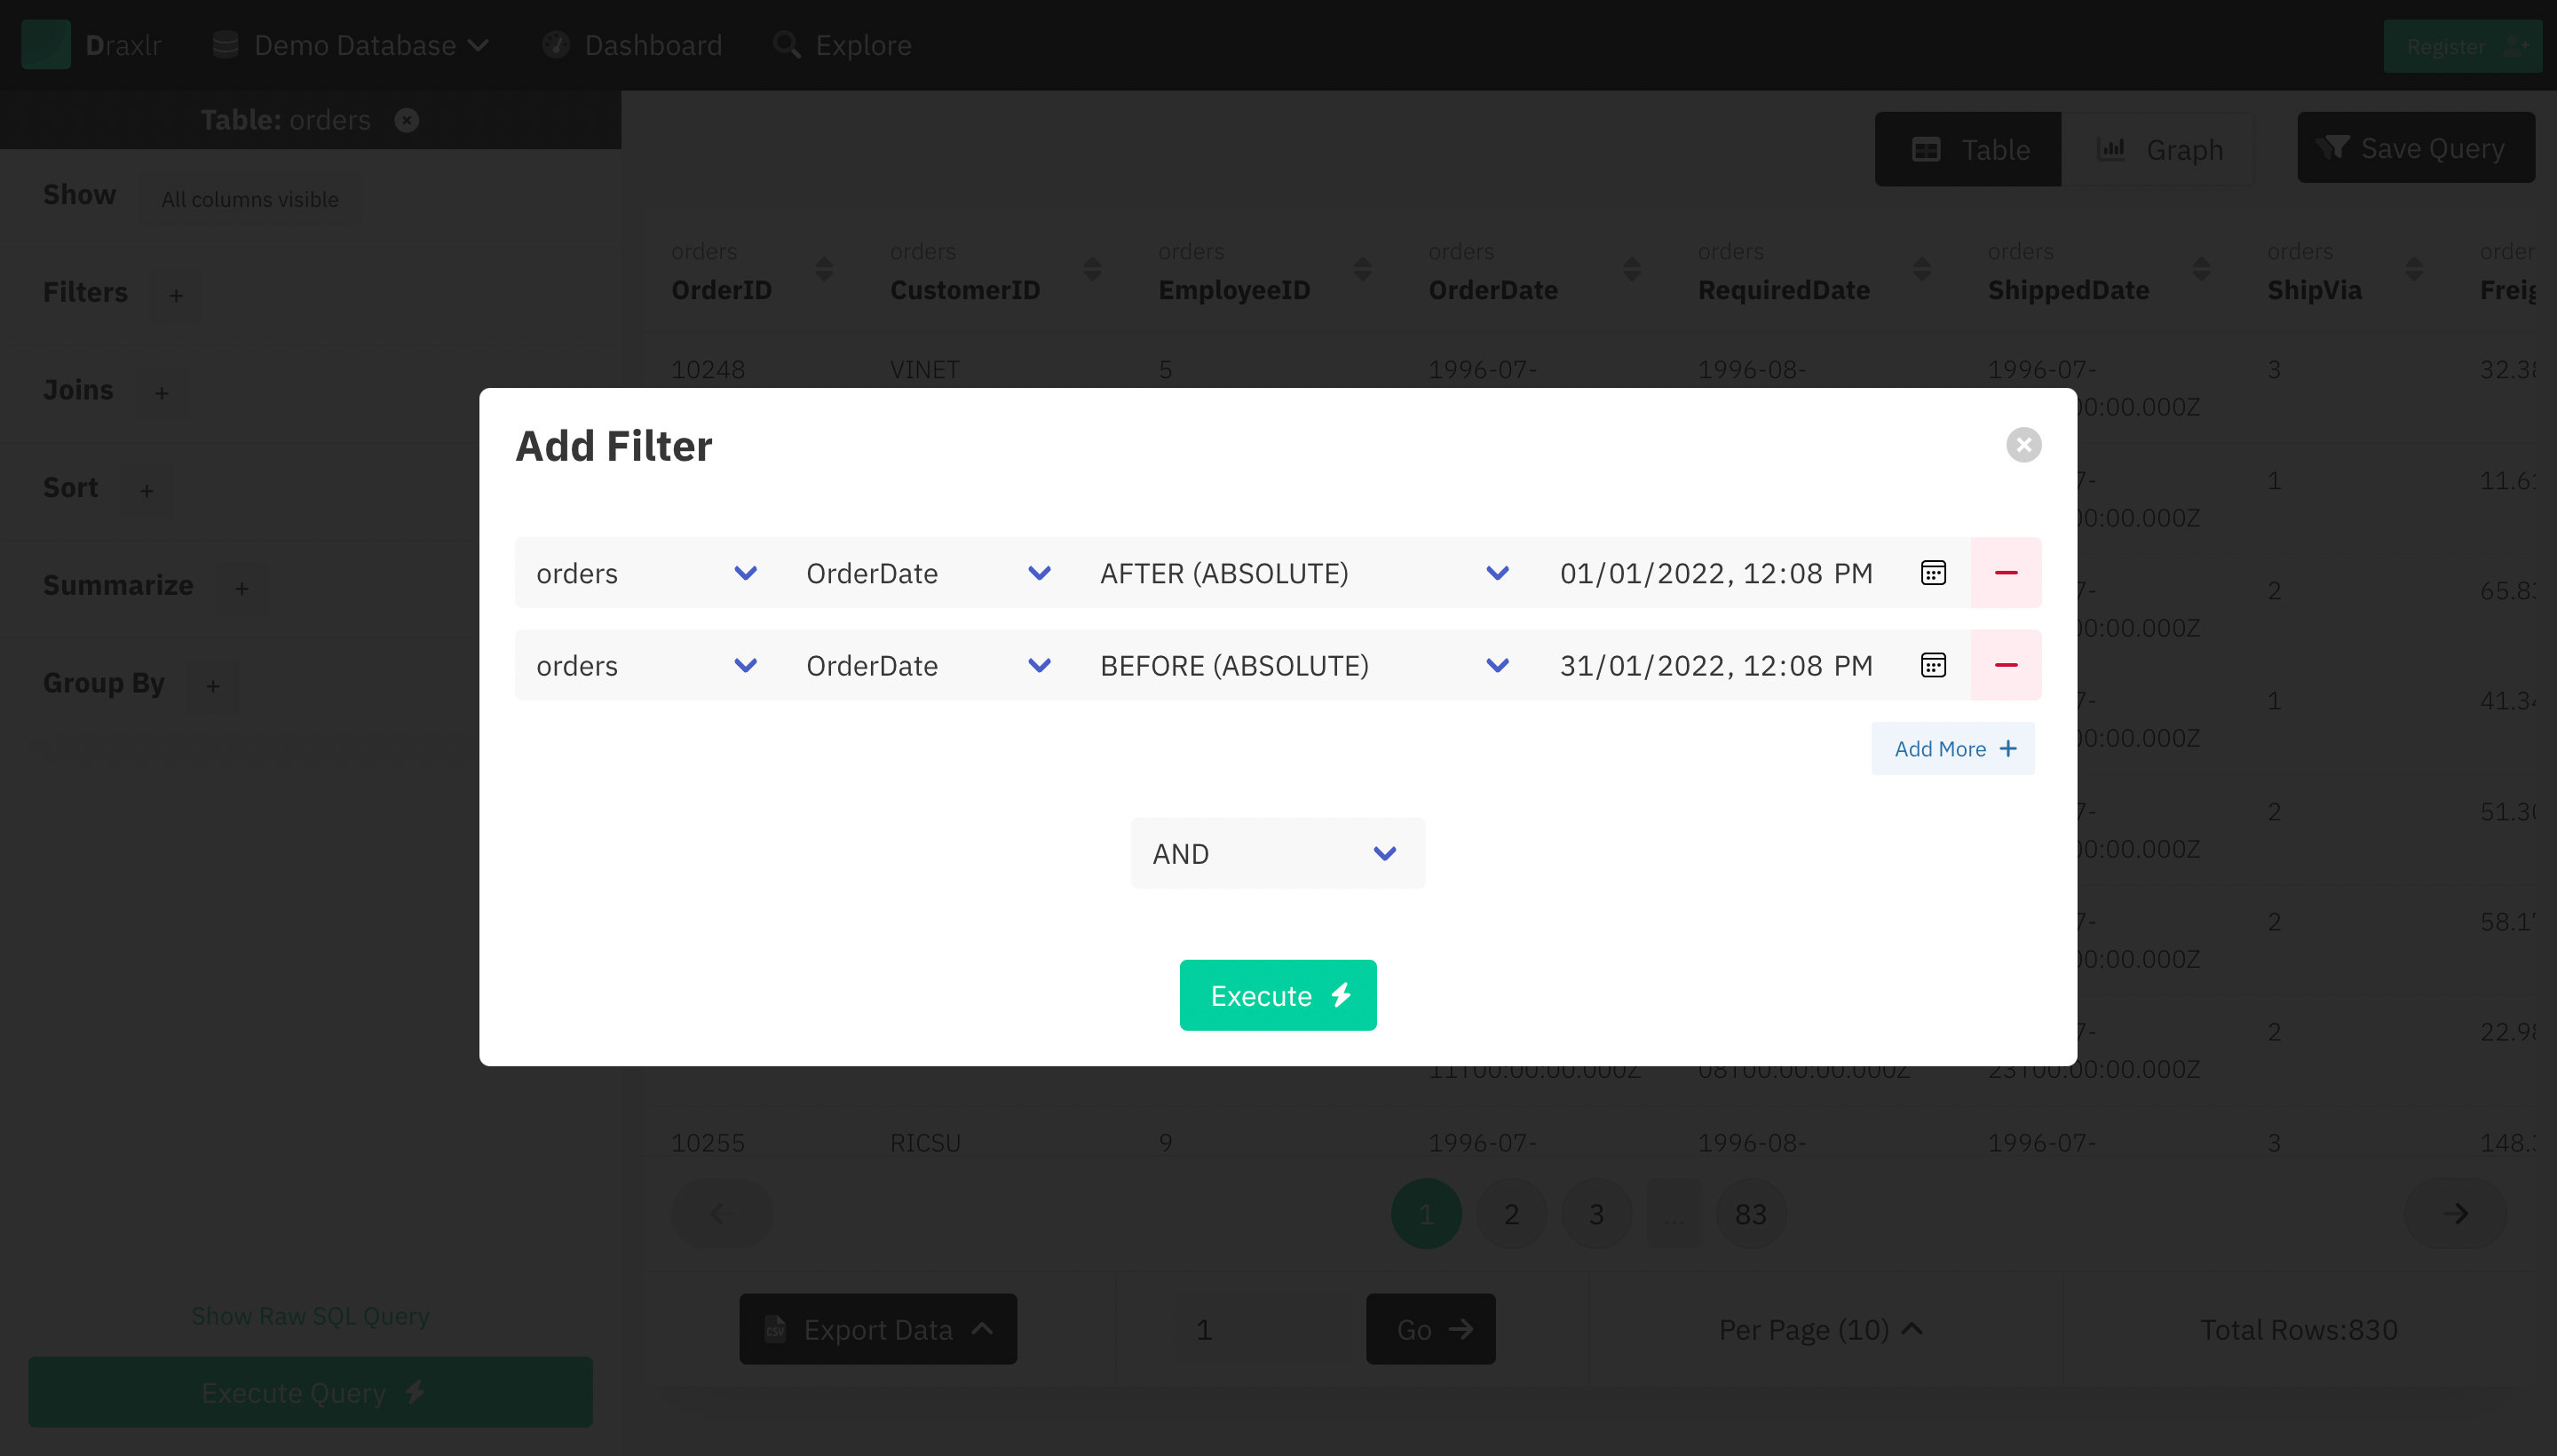
On Draxlr, you have to select the table on which you want to do the filter operation (which could be the orders table in the above example) and choose the column on the basis of which you need to filter. You can also save this query and use it along with other queries to build Microsoft SQL dashboards.
2. Sorting and ordering
To see the number of orders placed in an ascending or descending manner, you can use sorting. To do the same on Draxlr, all you need to do is select which column you want to sort and in which order you want to sort it, and hit execute.
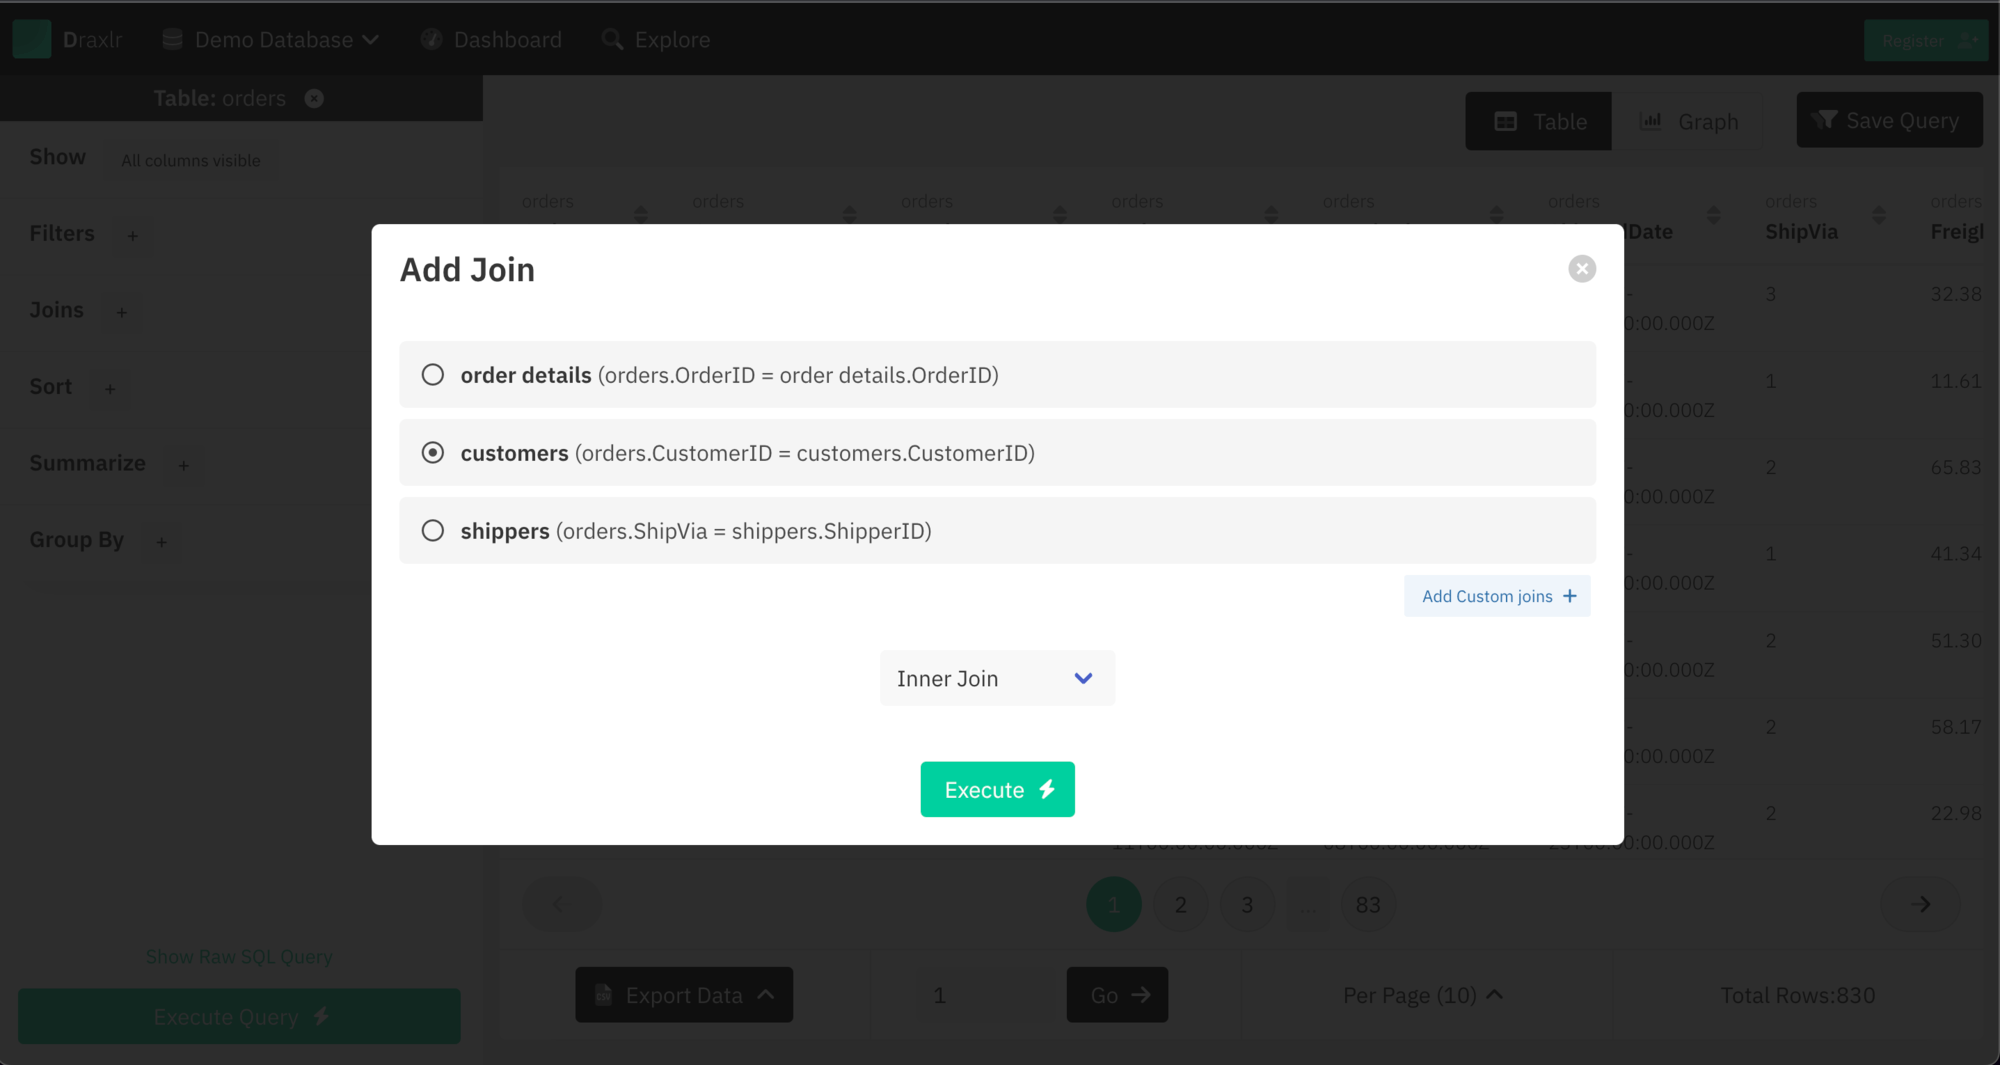
3. Joining
Databases have data spread over multiple tables to ensure consistency and reduce redundancy. Hence, we need to combine two or more tables in order to draw conclusions. For example, if you want to see which city placed the maximum number of orders in a day, you would have to join the customer table, which will fetch the city of the customer, and the order table, which will get the orders placed by the customers.
Joins might sound scary, but you need not worry, as with Draxlr, you don't have to worry about writing the correct SQL queries. There are seven kinds of joins, which you can read briefly about in the blog here. Now you just need to select the kind of join you want and the tables you want to join, and you're good to go!
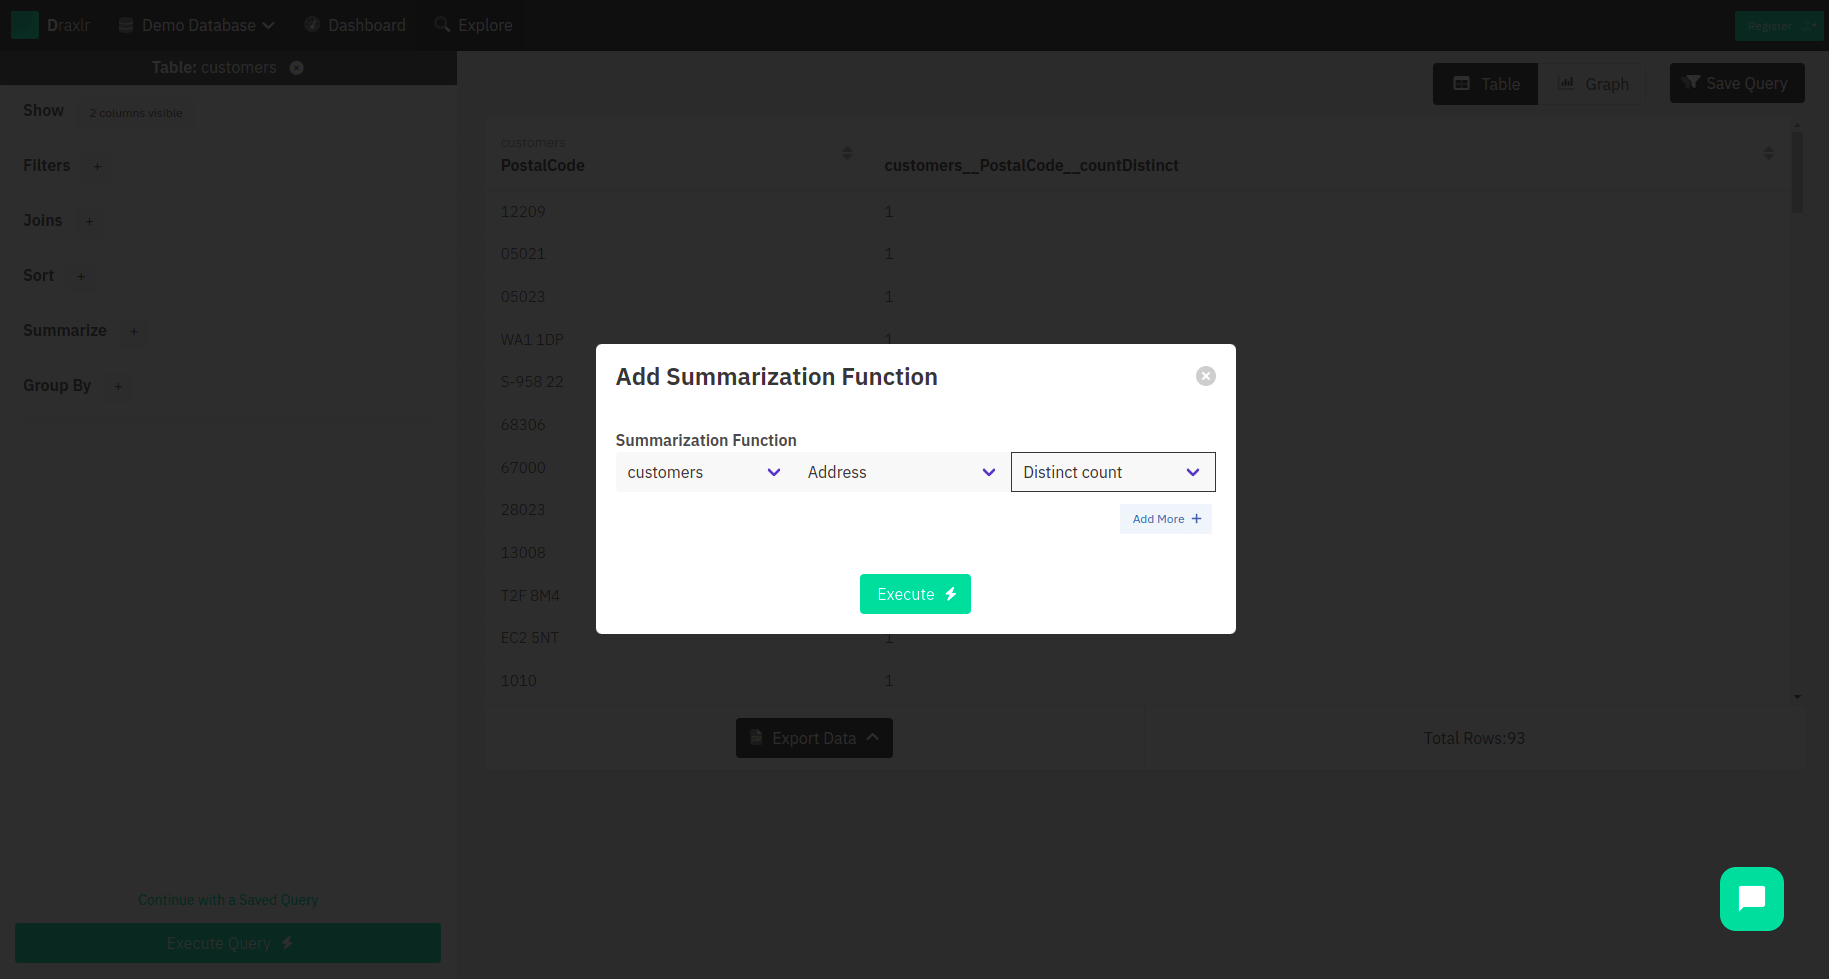
4. Summarising
If you are asked about the total customers your organisation has acquired to date, you can use the Summarise feature on Draxlr to get the count of any particular column in a table. Moreover, if it is a numeric field, like the amount of the order placed in the orders table, you can perform different mathematical functions like getting the average of a column, the minimum, the maximum, and the total sum of all the entries for any column.
5. Grouping
If you want to know how many customers placed an order for item X and how many placed an order for item Y, you can simply group them on the basis of the order. On the platform, choose the table along with the column on the basis of which you want to group the data, and the results will be shown to you.
Note: The best part about all the above queries is that they can be performed separately as well as together. You could apply sort and filter to your summarise and group queries, or you could join two tables and then summarise them.
Building Graphs
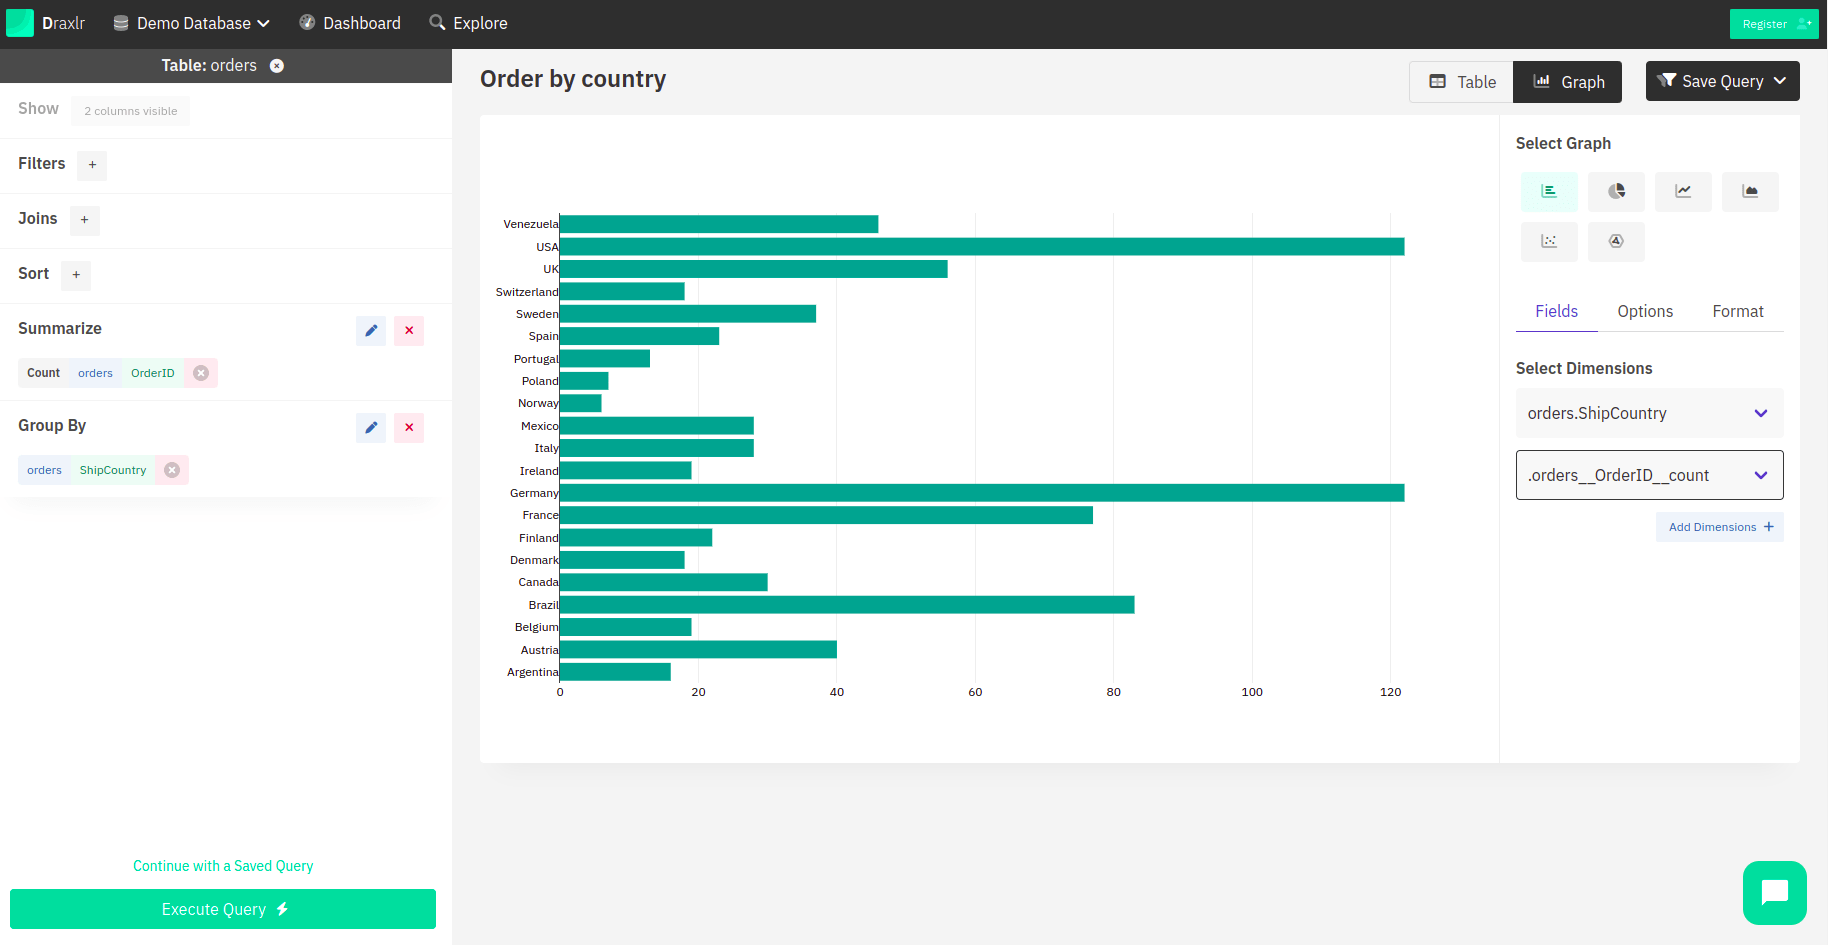
Database tables are easy and quick to store data, but to present—well, not so much. That is where the graphs come into the picture. They are a great pictorial representation of the data and are quite helpful in presentations and business analytics. If you select any of the above queries, then by default, the results are displayed in a tabular format, but right next to it, you can see a Graphs option. On selecting that, you get to pick from a variety of graphs.
The available types of graphs are bar charts, pie charts, line charts, area charts, scatter charts, and radar charts. To understand these charts better, you can learn more about them on this blog.
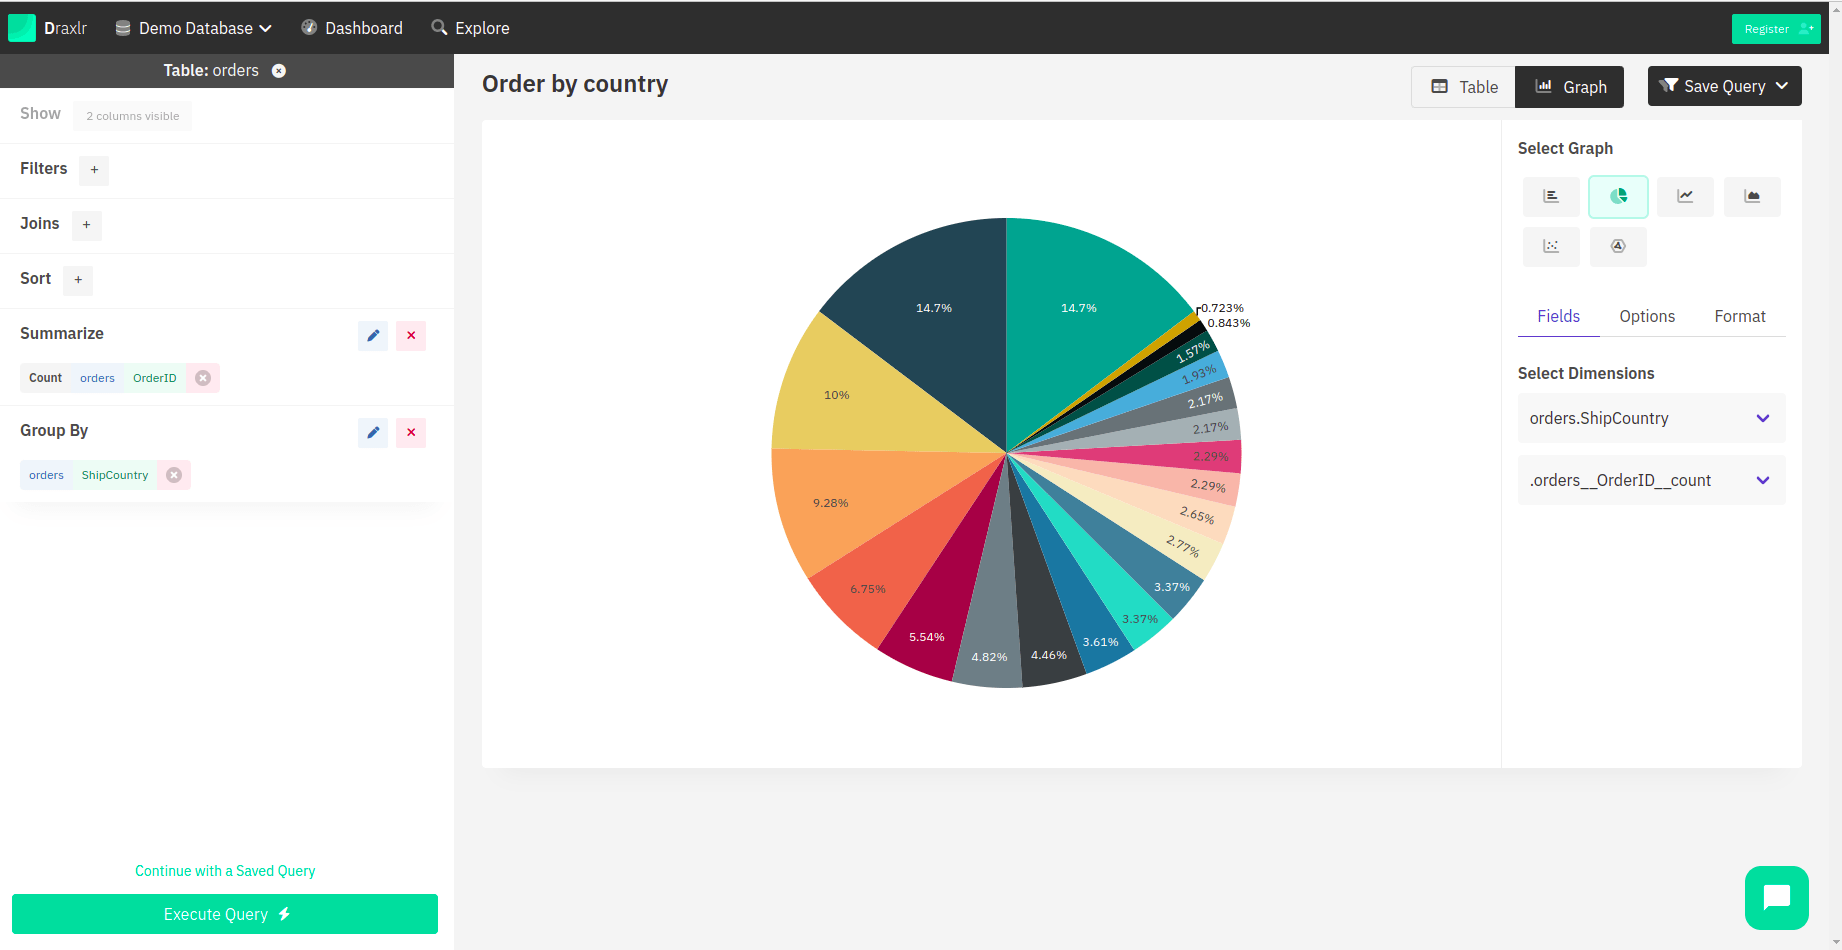
Graphs are great tools and come in handy in places where you need to represent data to a large number of people. They make understanding the data easier and are helpful in deriving conclusions based on the data. Not only can you represent data in graphs, but you can also give a title to your graphs, set precision, and in cases where any fields are monetary, you can format the values as currency where the currency type can be chosen.
Building Dashboards
A Microsoft SQL dashboard is basically a visual representation of multiple graphs. To create a dashboard, you have to navigate to the Dashboards section and select Add. On selecting the same, you will see all your saved queries listed, and you can choose from those to add to the dashboard. The visual of the dashboard is customizable into graphs, tables, or computed cards, and you can select the one that fits your requirements. You can do the same for multiple queries and create a dashboard. Not only that, but you can also create multiple dashboards if that is what you need.
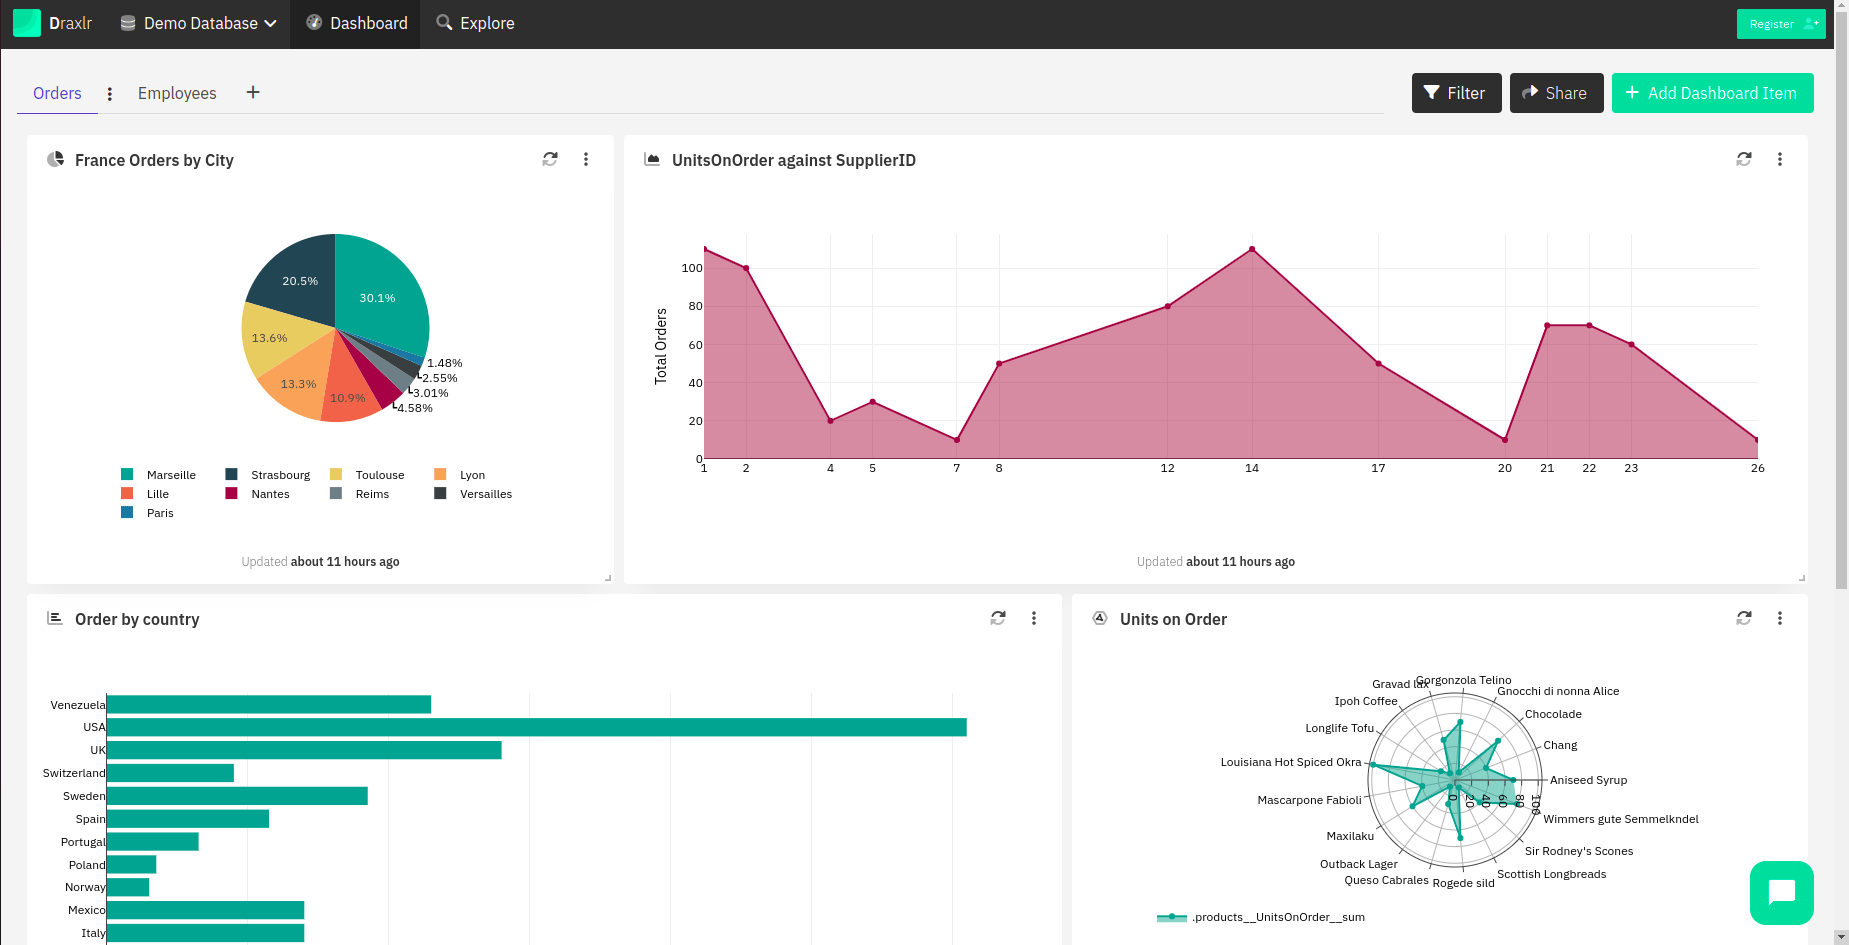
These queries are updated, and results are fetched from the database at certain intervals. However, if you want updated results at any time, you can refresh it manually to see the latest data.
Cool things to do with dashboards and data
Once you have added the items to the dashboard, you can share the dashboard with anyone in multiple ways. If the dashboard is private, it can be shared with a link that is PIN-protected. Not only that, but you can also embed the Microsoft SQL Dashboard on your website or application. The embeds are domain-protected, which means that only the domains you allow can embed your dashboard.
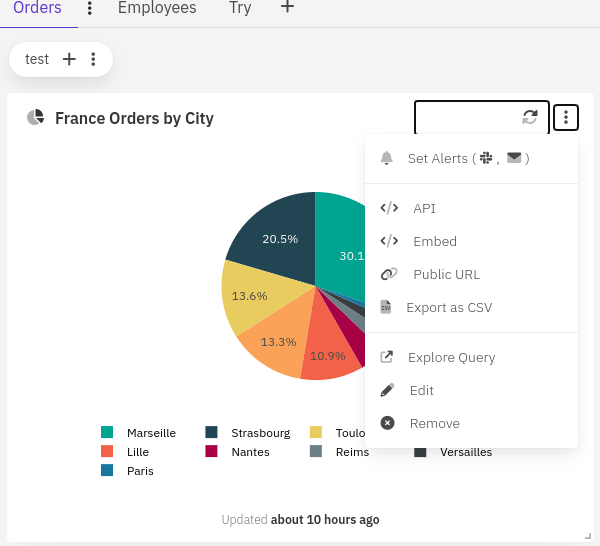
Moreover, you can also set up alerts on your data, which can be super helpful for monitoring data. In each dashboard item on the top right corner, there is a toggle to open a menu. It has all the options for a dashboard item, and from there, you can select Set Alerts.
To begin with, you will have two options, so you can decide whether you want the alerts via Slack or emails. For Slack, you can select a channel to get updates on your dashboard item. If you have a private Slack channel, you need to add Draxlr to that channel.
As for when you want to receive updates, there are two options. You can receive an alert when any value is changed, or you can receive updates on specific days at a specific time. The updates will be sent to you as a screenshot of the dashboard item. For computed cards without a target, you will receive the direct values in alerts. In the case of tables, you will receive the data in CSV format.
Working around databases can be overwhelming to start with, but with Draxlr, the task becomes an easy nut to crack. You can write SQL queries as effortlessly as selecting the correct operation and hitting execute, and not only that, if your curious mind wants to dig deeper and see and modify raw queries, that is possible as well. Building and managing Microsoft SQL dashboards was never this easy, was it? Head over to Draxlr and explore the innumerable things you can do with your data!
Working around databases can be overwhelming to start with, but with Draxlr, the task becomes an easy nut to crack. You can write SQL queries as effortlessly as selecting the correct operation and hitting execute, and not only that, if your curious mind wants to dig deeper and see and modify raw queries, that is possible as well. Building and managing Microsoft SQL dashboards was never this easy, was it? Head over to Draxlr and explore the innumerable things you can do with your data!
