How to Use an SQL Dashboard Tool to Monitor Key Performance Indicators(KPIs)
Use an SQL dashboard tool to monitor KPIs with Draxlr. Build dashboards, visualize data, and share insights instantly with your team.
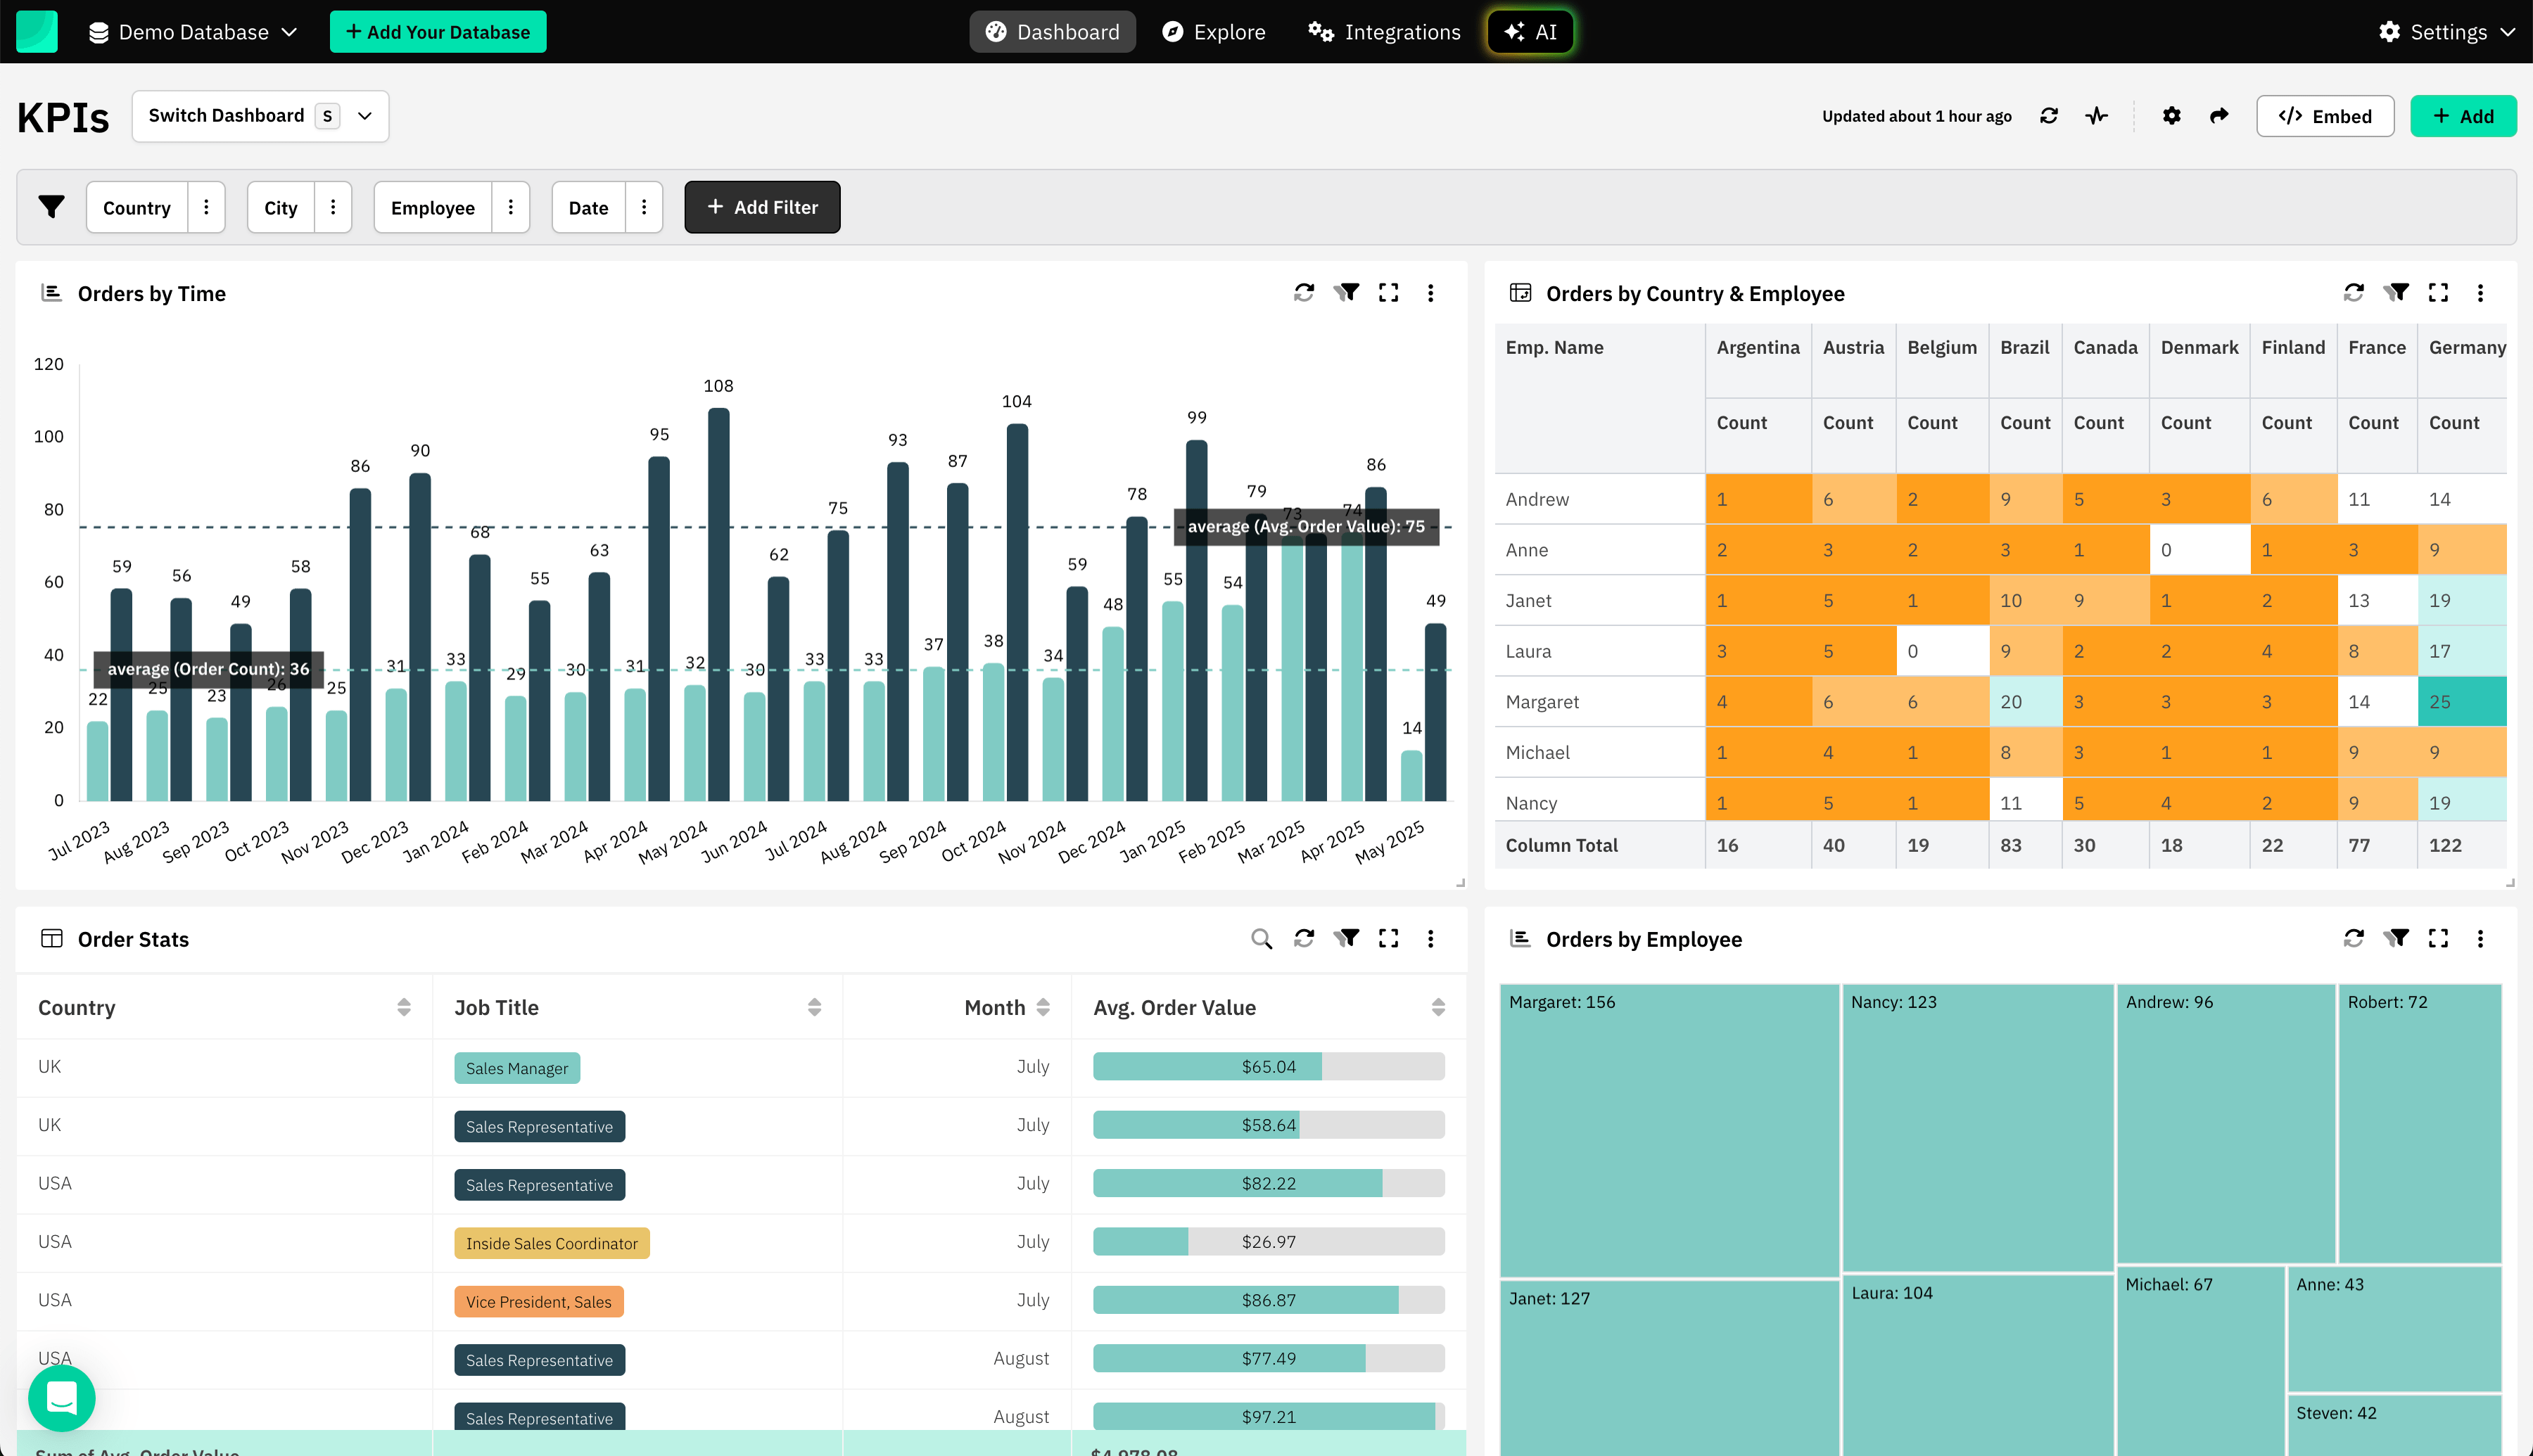
An SQL dashboard tool helps businesses monitor their Key Performance Indicators (KPIs) in real time by connecting directly to their database. Instead of juggling spreadsheets or static reports, teams can use live dashboards to track performance, spot issues early, and make better decisions. With Draxlr, you can build powerful dashboards quickly and monitor your most important KPIs without needing technical expertise.
What is an SQL Dashboard Tool?
An SQL dashboard tool isn’t just about charts—it’s about creating a live window into your business data. By connecting directly to your database, it replaces static reports with interactive dashboards that update as your data changes. This means finance, sales, and operations teams no longer have to wait for exports or manual updates—they can see KPIs as they happen.
Draxlr takes this one step further by making dashboards accessible to everyone on the team. You can:
- Build visually with a drag-and-drop Query Builder.
- Ask in plain English and let AI generate the SQL for you.
- Write your own SQL when you want complete control.
Whether you’re a founder checking revenue growth or an analyst diving deep into customer churn, Draxlr adapts to your workflow and keeps KPIs at your fingertips.
Why KPIs Work Better with an SQL Dashboard Tool
Traditional KPI tracking often breaks down because:
- Spreadsheets require manual updates.
- Teams rely on multiple versions of the truth.
- Reports lag behind real performance.
An SQL dashboard tool solves these problems by working directly on your live database. This means:
- Always current – Dashboards refresh with the latest data.
- Single source of truth – Everyone sees the same numbers.
- Less overhead – No exporting, cleaning, or emailing files.
Draxlr goes one step further by making this process accessible to both technical and non-technical users. Whether you’re a founder checking growth metrics or an operations lead monitoring delivery times, you can set up dashboards without needing a data engineer.
Connect your DatabaseHow an SQL Dashboard Tool Fits Into Daily Business Use
Using an SQL dashboard tool isn’t complicated. In practice, the flow looks like this:
- Connect your database — Draxlr supports PostgreSQL, MySQL, MSSQL, MariaDB, Supabase, PlanetScale, Databricks, and more.
- Choose your KPIs — Whether it’s churn, MRR, average order value, or campaign ROI.
- Build your dashboard — Use Draxlr’s Visual Query Builder, AI SQL Assistant, or write raw SQL if you prefer.
- Share insights instantly — Create links, embed dashboards in your tools, or set Slack and Email alerts for KPI changes.
Examples of KPI Dashboards You Can Build
Different teams care about different KPIs. An SQL dashboard tool makes it possible to serve everyone from a single database:
- SaaS Teams – Track Monthly Recurring Revenue (MRR), churn rate, and daily active users.
- Ecommerce Teams – Monitor average order value, repeat purchase rate, and cart abandonment.
- Operations Teams – Keep an eye on delivery times, stock availability, and vendor SLAs.
- Marketing Teams – Measure campaign ROI, website traffic, and conversion rates.
Making KPI Dashboards Actionable
A dashboard should do more than display KPIs—it should guide decisions. Here’s how to make dashboards actionable:
- Add context, not just numbers → Show trends, targets, or comparisons alongside each KPI.
- Use filters to personalize views → Let teams slice data by campaign, region, or customer type.
- Set alerts and notifications → Get notified in Slack or email when KPIs cross a threshold.
- Enable drill-downs → Move from high-level metrics (e.g., “Conversion = 12%”) into specific campaigns or user segments.
- Share where work happens → Embed dashboards in your CRM, internal portal, or client dashboard.
With Draxlr, these features are built in, so dashboards become part of everyday workflows—not just monthly check-ins.
Why Choose Draxlr as Your SQL Dashboard Tool
There are many BI platforms out there, but Draxlr focuses on making KPI tracking simple and fast:
- AI-first querying → Type a question, get SQL instantly.
- Easy dashboard filters and drill-downs → Let teams interact with the data without editing queries.
- Real-time monitoring → Dashboards always reflect the latest numbers in your database.
- Flexible sharing → Share links, embed dashboards, or assign role-based access.
- Deployment options → Cloud or self-hosted, depending on your compliance needs.
Instead of adding another layer of complexity, Draxlr removes the friction between data and decision-making.
Conclusion
Monitoring KPIs is essential—but it’s only effective when the data is live, centralized, and easy to act on. An SQL dashboard tool like Draxlr gives your team a real-time view of the metrics that matter most, without manual work or technical bottlenecks.
If you’re ready to replace spreadsheets with live dashboards, try Draxlr today and start building your KPI dashboard in minutes.
FAQs
1. What is an SQL dashboard tool used for?
An SQL dashboard tool connects directly to your database and helps you build live dashboards to track KPIs. It allows teams to monitor business performance in real time without relying on static reports or spreadsheets.
2. Which KPIs can I track with an SQL dashboard tool?
You can track almost any KPI stored in your database, including:
- Revenue and MRR for SaaS
- Conversion rates and average order value for ecommerce
- Customer churn and retention metrics
- Operational data like delivery times or inventory levels
3. How do SQL dashboards stay up to date?
Unlike spreadsheets, SQL dashboards pull data directly from your live database. This means KPIs refresh automatically, so you always see the latest numbers without manual updates.
4. Can I share KPI dashboards with my team or clients?
Yes. Tools like Draxlr let you generate shareable links, embed dashboards in apps or portals, and even apply role-based access so each user sees only what’s relevant to them.
5. Do I need to know SQL to use a SQL Dashboard tool like Draxlr?
Not necessarily. Draxlr offers a Visual Query Builder and an AI SQL Assistant for non-technical users, while still allowing analysts and developers to write raw SQL if they prefer.

