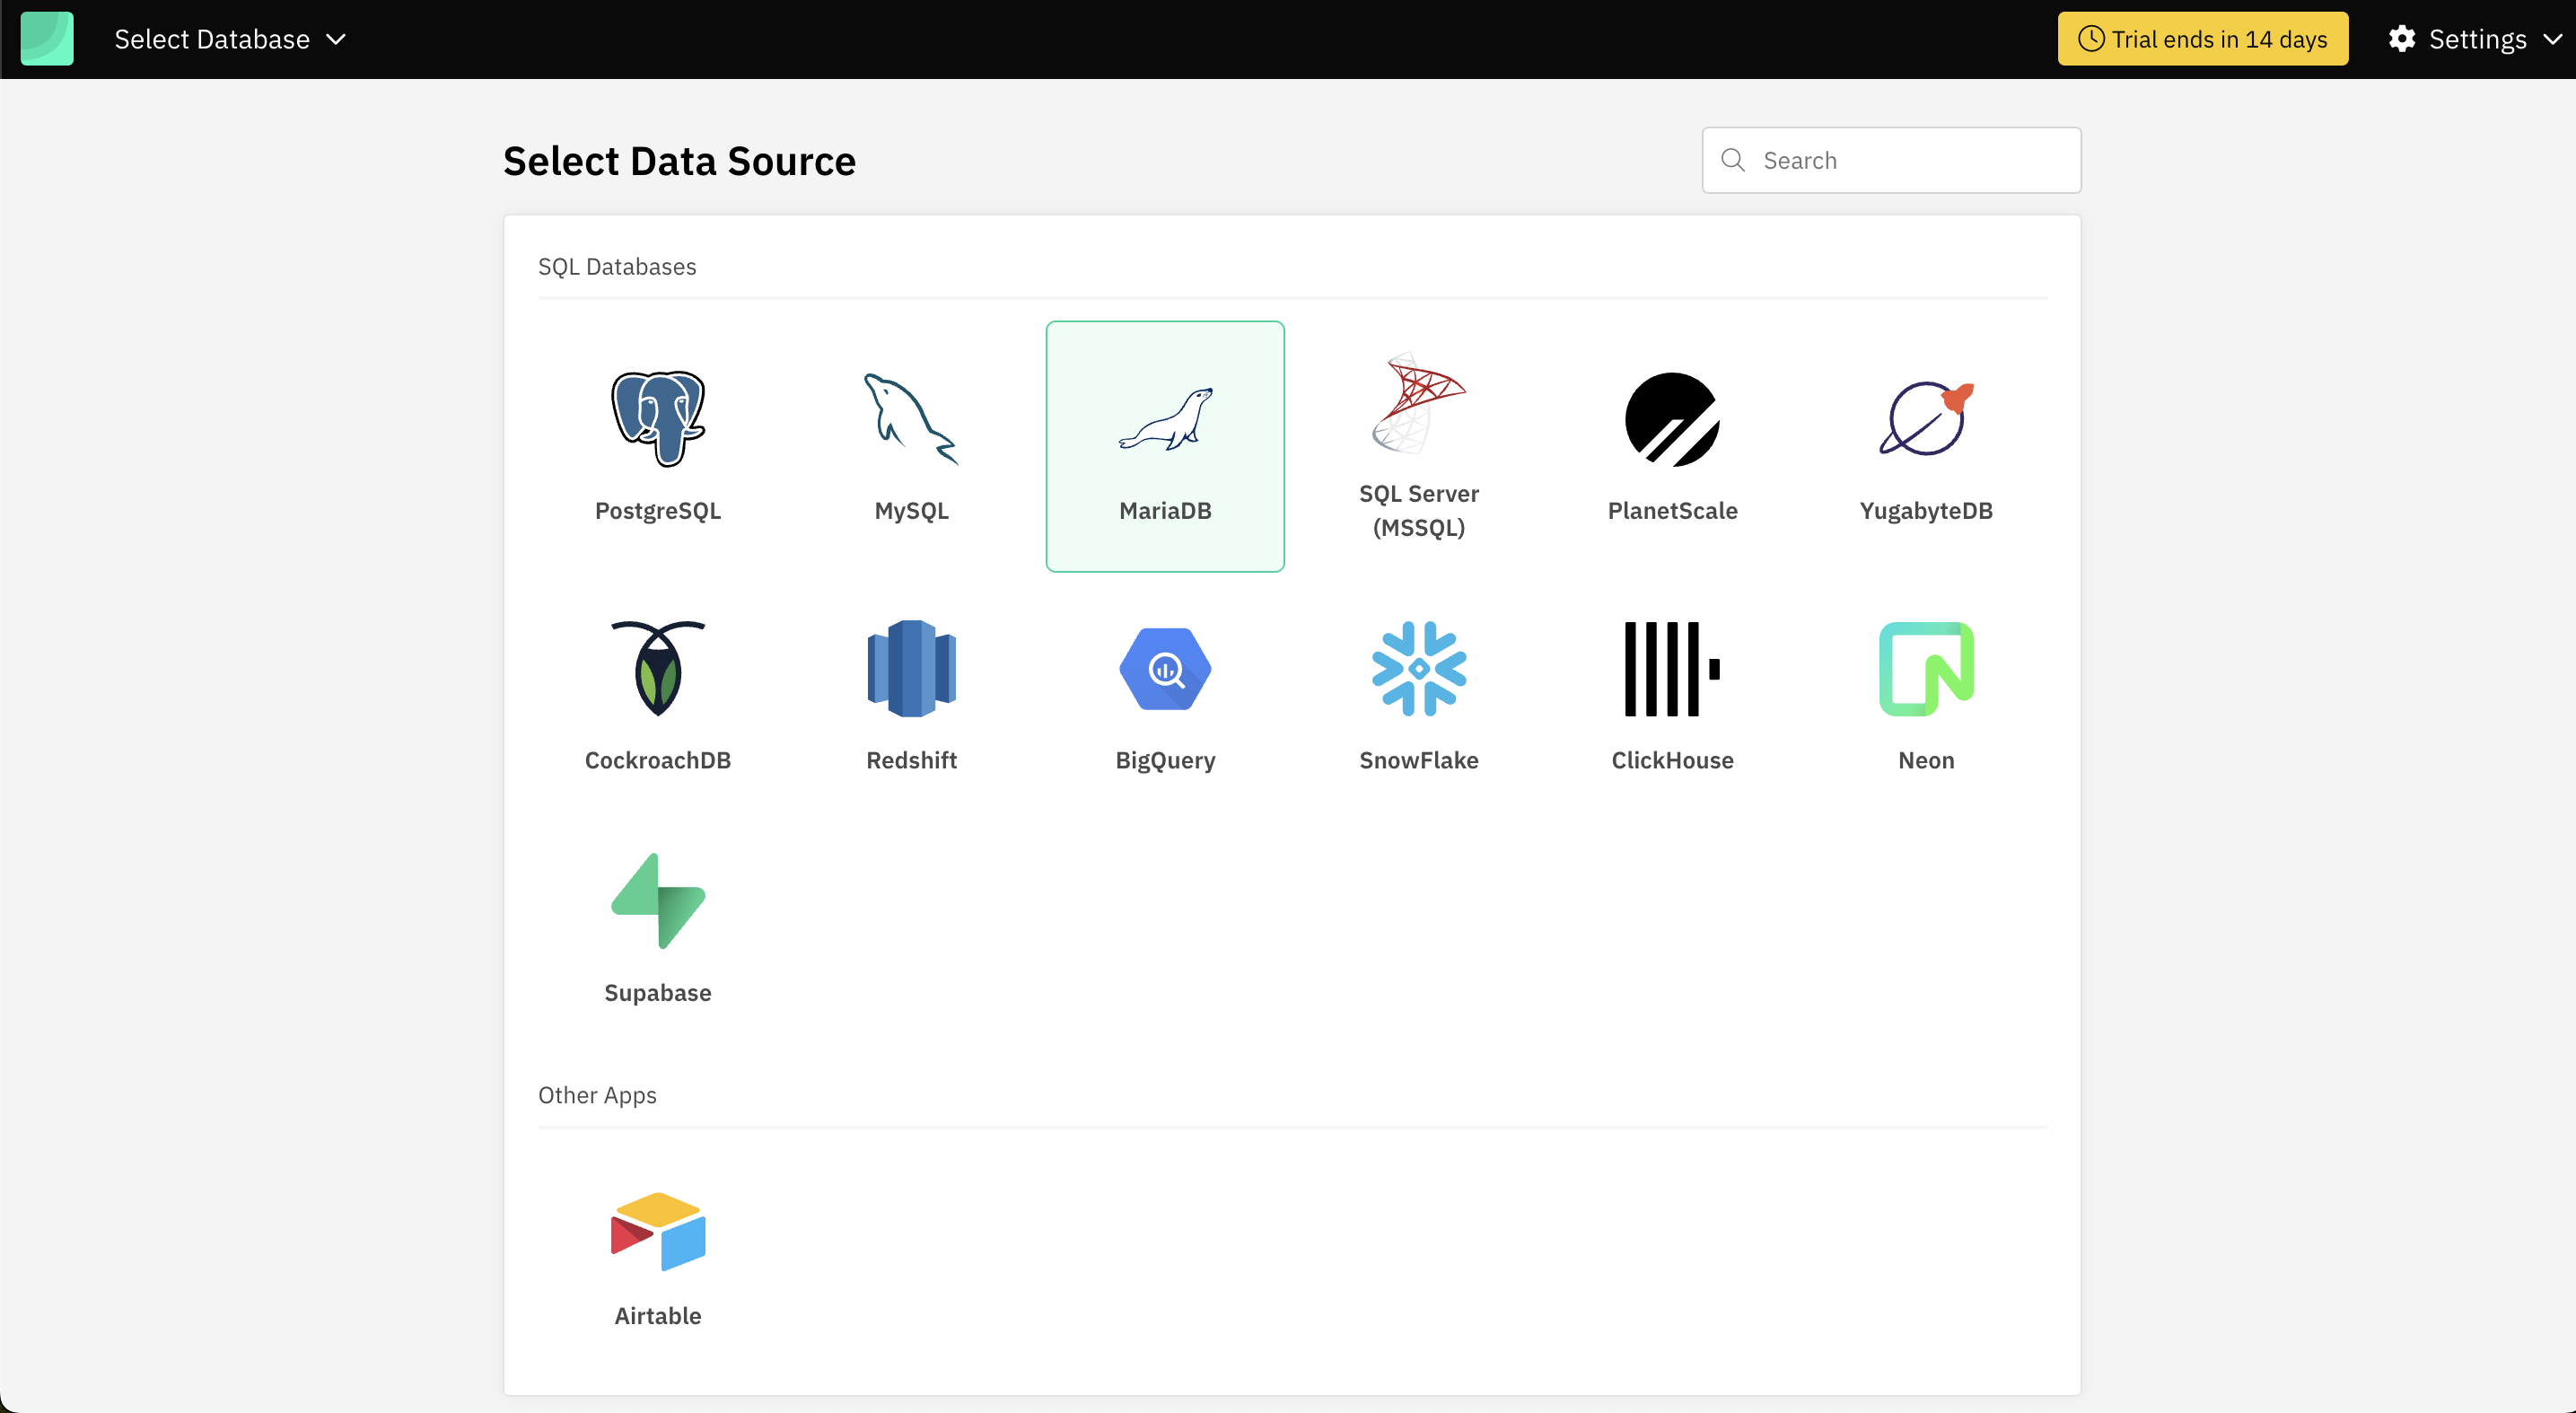
How to build Dashboards from MariaDB data
Learn how to build MariaDB dashboards with a SQL dashboard tool. Connect your database, create queries, and share interactive dashboards.

MariaDB is great for shipping product fast. But once users start signing up, you’ll eventually need a clear way to track what’s happening like signups, usage, revenue, orders, errors, subscriptions, anything that matters to your SaaS.
That’s the real gap not the data itself, but the lack of a clear, accessible way to build MariaDB dashboards that everyone on your team can read and understand without touching SQL.
What you need is a simple, repeatable path from raw MariaDB tables to decision-ready dashboards. And that’s exactly what this guide gives you.
What you need before you start building MariaDB dashboards
Before you start building MariaDB dashboards, it’s worth taking a moment to make sure your MariaDB setup is ready for analytical workloads. These small adjustments help dashboards load faster, keep queries consistent, and prevent unnecessary load on your production environment. A bit of preparation upfront makes it much easier to build MariaDB dashboards that stay accurate as your data grows.
Your quick setup checklist:
-
Use a read replica or reporting instance
Offload dashboard queries from your primary database to avoid performance impact on live users. -
Index frequently filtered columns
Fields like dates, user IDs, statuses, and product identifiers should have indexes to keep analytical queries fast. -
Standardize time zones across tables
Using a consistent time zone (preferably UTC) prevents mismatched results when visualizing trends over time. -
Ensure primary keys are consistent and reliable
Clean, unique, predictable primary keys make joins easier and dashboards more stable. -
Review table naming and relationships
Consistent naming helps both your team and your SQL dashboard tool understand the schema more intuitively.
You don’t need a full data warehouse to build MariaDB dashboards, but preparing your database with these basics will save you significant effort later especially as dashboards become a core part of how your team reads data.
Choose the right SQL dashboard tool for building MariaDB dashboards
Once your database is ready, the most important decision is selecting the SQL dashboard tool that will sit on top of MariaDB. The right tool determines how quickly you can build MariaDB dashboards, how easily your team can explore data, and how much ongoing engineering effort you’re committing to. To build MariaDB dashboards efficiently, you need a SQL dashboard tool that works with your schema as it is, respects SQL logic, and keeps your reporting fast and maintainable.
What to look for in a MariaDB dashboard building tool:
-
Native MariaDB connectivity
The tool should connect directly using secure credentials with no complicated middleware or sync processes. -
Support for SQL-first workflows
MariaDB data is often best accessed through SQL. A tool that supports writing, editing, and previewing SQL gives you full control without workarounds. -
Multiple ways to build queries
Teams need flexibility. Look for:- A Visual Query Builder for non-technical users
- AI text-to-SQL for quick exploration
- A full SQL editor for deeper analysis
-
Fast, flexible visualization options
Line charts, bar charts, KPIs, tables, and filters should be easy to create and rearrange. -
Secure sharing and access control
The tool should let you share dashboards without exposing your database or allowing unintended access. -
Embedding capabilities
If you ever want customer-facing dashboards, embedding should be available.
A SQL dashboard tool that offers these capabilities will give you a clean, scalable foundation for building MariaDB dashboards your entire team can rely on.
Build dashboards from MariaDB data using Draxlr
Once you’re ready to analyze your data, Draxlr gives you a complete workflow starting from connecting your MariaDB instance, all the way to building, sharing, and automating dashboards. Everything lives in one place, making it easy to build MariaDB dashboards without maintaining any reporting infrastructure yourself.
1. Connect your MariaDB database
Add your database credentials (host, port, username, password, and database name) to connect. Draxlr instantly detects your tables and schema, so you can start exploring data without any additional setup.
2. Create queries using the method that suits you
Draxlr offers three flexible ways to build queries, depending on your comfort with SQL:
- Visual Query Builder for selecting tables, joining data, filtering, and aggregating with few clicks. No SQL needed.
- AI Chat (text to SQL) to describe your requirement in plain English and let Draxlr generate the SQL.
- Full SQL Editor for maximum control when you want to fine-tune advanced queries.
Every query you save becomes a reusable building block for future dashboards.
3. Convert your queries into dashboards
Turn your saved queries into visual insights by mapping them to:
- Line, bar, donut charts, and more advanced charts
- KPI widgets and number blocks
- Tables for detailed views
- Time-series charts for trends and comparisons
You can freely arrange widgets to design dashboards that match your team’s workflow.
4. Add filters and drilldowns for deeper exploration
Draxlr makes dashboards interactive by allowing you to:
- Add global filters like date range, region, or customer segment
- Drill into charts to view the underlying query results
- Enable dynamic filtering without modifying the SQL
This makes dashboards explorable rather than static snapshots.
5. Share and Embed insights securely
Draxlr ensures dashboards can be shared without exposing your database:
- Invite teammates with controlled access
- Share private dashboard links
- Embed dashboards inside your SaaS product with full white-label options
Everyone gets access to insights, while your data stays protected.
6. Automate alerts and scheduled reports
Set up email or Slack summaries and KPI-based alerts so your team gets updates automatically. This ensures key metrics are monitored even when no one is checking the dashboard.
With Draxlr, you go from a raw MariaDB connection to fully interactive dashboards in just a few steps—fast, simple, and designed for real-world teams.
Common mistakes to avoid when building MariaDB dashboards
When teams start building dashboards from MariaDB, the challenges usually aren’t technical they come from small decisions that slowly create inconsistencies or performance bottlenecks. Keeping these mistakes in check ensures your dashboards stay clean, dependable, and easy to manage.
-
Treating every dashboard as a standalone project When each dashboard uses its own version of a metric, teams end up with conflicting numbers. Centralizing logic in reusable queries prevents this fragmentation.
-
Connecting with accounts that have overly broad permissions Dashboards don’t need write access or full admin rights. Using a minimal, read-only user protects your production environment and reduces risk.
-
Building dashboards before agreeing on metric definitions If “active user,” “MRR,” or “conversion” mean different things to different teams, no dashboard can fix that. Define key metrics before visualizing them.
-
Ignoring how data will grow over time A query that works today may not scale when the table has 50 million rows. Designing with growth in mind (proper filters, date ranges, pagination) keeps dashboards fast long-term.
-
Hardcoding time filters, statuses, or segments inside SQL This forces you to edit queries every time business logic changes. Using dynamic filters in your BI tool keeps dashboards flexible and reduces maintenance.
These are the types of issues that quietly undermine analytics workflows. Avoiding them makes it far easier to build MariaDB dashboards that stay accurate, scalable, and consistent as your organization grows.
Conclusion
Building dashboards from MariaDB doesn’t need a complex data pipeline or a dedicated analytics team. With a few preparations, the right SQL dashboard tool, and a simple workflow, you can turn your existing tables into interactive dashboards your team actually understands. From connecting your database to creating reusable queries, adding filters, sharing insights, and automating updates, the entire process becomes straightforward once everything lives in one place.
If your goal is to build MariaDB dashboards that are live, consistent, and easy for everyone to explore, Draxlr gives you a clean path from raw tables to decision-ready insights without adding engineering overhead or maintaining internal reporting tools.
Connect your MariaDB DatabaseFAQs
1. Do I need a data warehouse to build MariaDB dashboards?
No. You can build MariaDB dashboards directly on your live database as long as you use a read-only user or a read replica. A data warehouse is only necessary when your dataset becomes too large or your reporting logic becomes heavily aggregated.
2. Can non-technical users build dashboards from MariaDB data?
Yes. Tools like Draxlr provide visual query builders, filters, and drag-and-drop dashboards so users can explore data without writing SQL.
3. How do I keep my MariaDB dashboards accurate over time?
Define metrics clearly, reuse saved queries instead of duplicating SQL, and standardize timestamps across tables. These small steps prevent inconsistencies as your data grows.
4. Can I embed MariaDB dashboards inside my product or internal tools?
If your SQL dashboard tool supports embedding, you can publish dashboards directly inside your SaaS app or admin panel while keeping your database secure.
5. What’s the easiest way to start building MariaDB dashboards?
Prepare your database (indexes, read-only access), connect it to a SQL dashboard tool like Draxlr, create reusable queries, and turn them into interactive dashboards with filters and drilldowns.

