How to build dashboards from Nhost database
Explore the seamless integration of Draxlr Analytics with Nhost. Draxlr's is perfect for businesses seeking to leverage advanced data analytics and visualization tools for informed decision-making.

In today's data-driven world, the ability to effectively analyse and glean insights from your data is crucial. For users of Nhost, integrating with Draxlr, a user-friendly drag-and-drop query builder and data visualisation tool, can be a game-changer. This blog post will guide you through connecting your Nhost database to Draxlr and performing analytics on it.
Why integrate Nhost with Draxlr?
Nhost: It offers a secure and scalable backend with GraphQL, making it a preferred choice for developers looking for an efficient database solution.
Draxlr: This is an easy-to-use, self-service BI tool. It provides an intuitive interface for running queries, creating dashboards, and sharing insights with your team.
Integrating Nhost with Draxlr allows you and your team to make informed decisions with data stored on Nhost's and Draxlr's robust analytics capabilities.
Here is a quick video walkthrough of how to connect and build a dashboard from Nhost database data in Draxlr:
Step-by-Step Guide to Integration
Preparing Your Nhost Database
Before connecting to Draxlr, ensure that your Nhost database is properly set up and accessible.
- Make sure your Nhost database is operational and can be accessed externally.
-
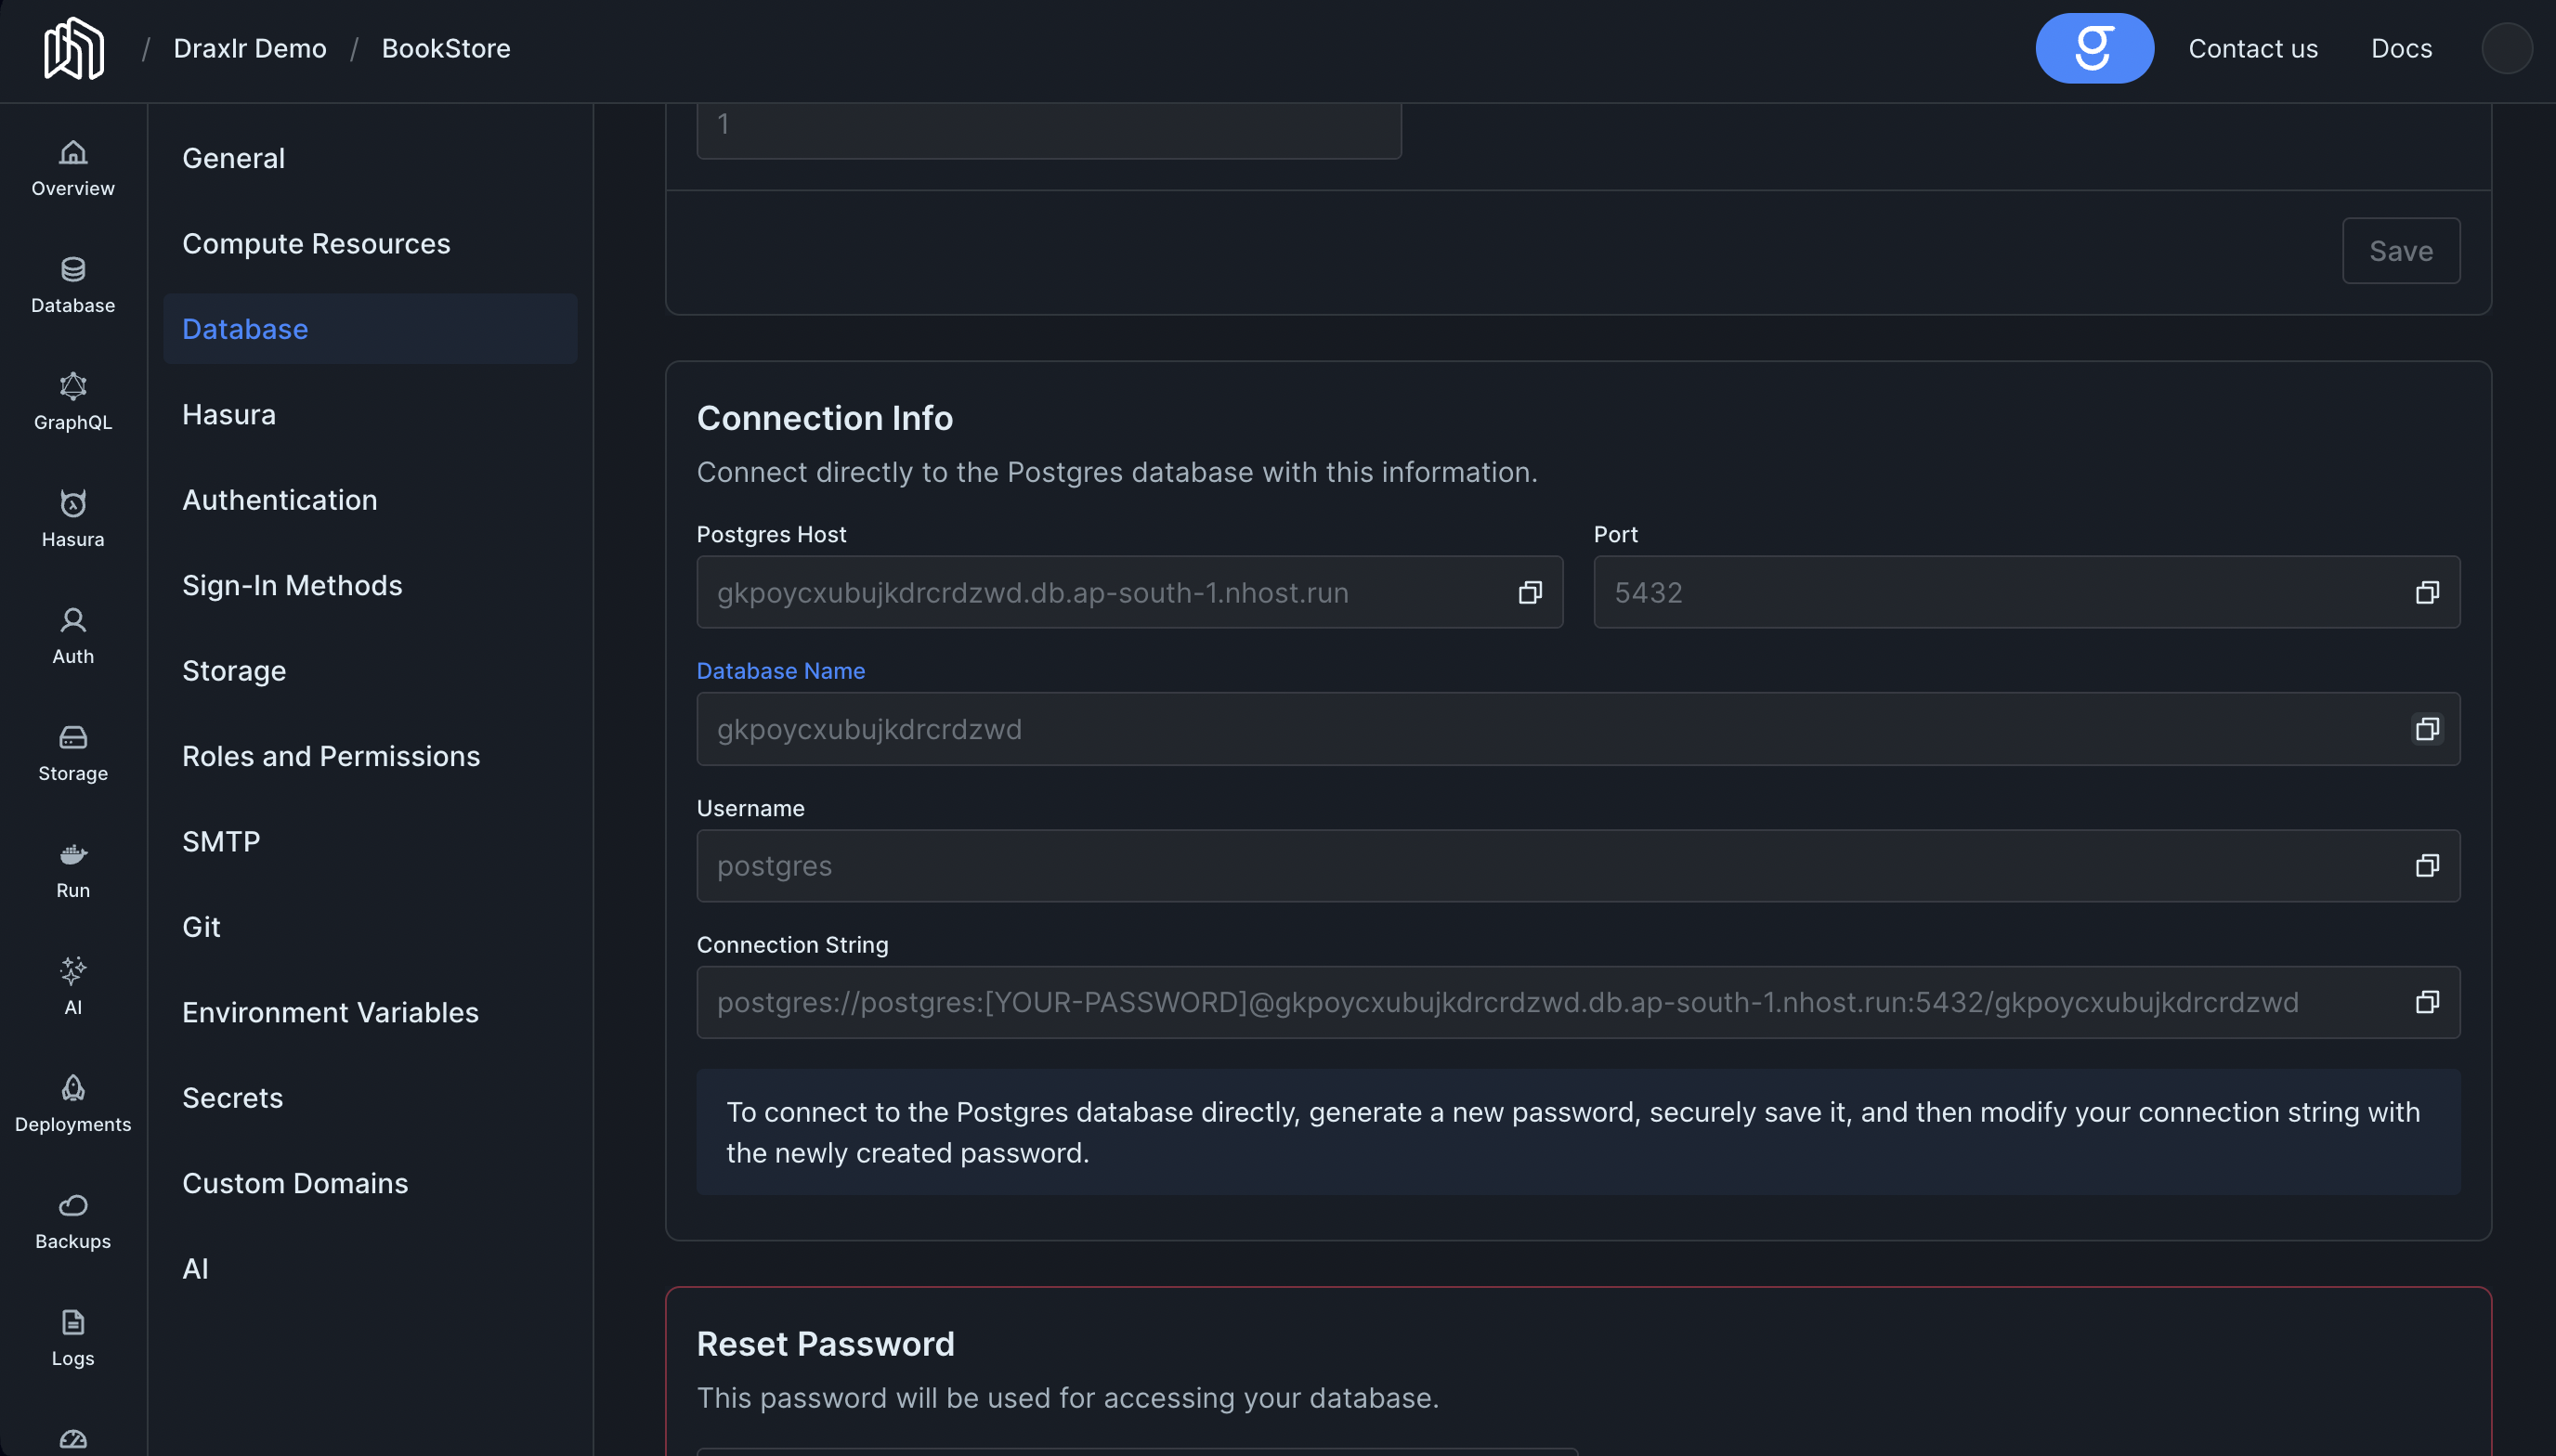
Note down your database's host, port, username, and password. You'll need these for Draxlr. These can be found in your Nhost dashboard settings under the Database > Connection info section.
Connecting to Draxlr
With your Nhost details in hand, it's time to set up Draxlr:
- If you’re new to Draxlr, create an account or log in if you already have one.
- If you have a new account, you'll be on the connect database page. If not, click on the Select database > + Connect a Database button on the navbar. Select PostgreSQL as the database type and click next.
- Fill in the connection form with your Nhost database details (host, port, username, password, and database name), then click next.
- Next, select the schema you want to connect to. If you have a single schema, it will be selected by default. Click next.
Exploring your data
With the connection established, you’re ready to dive into analytics:
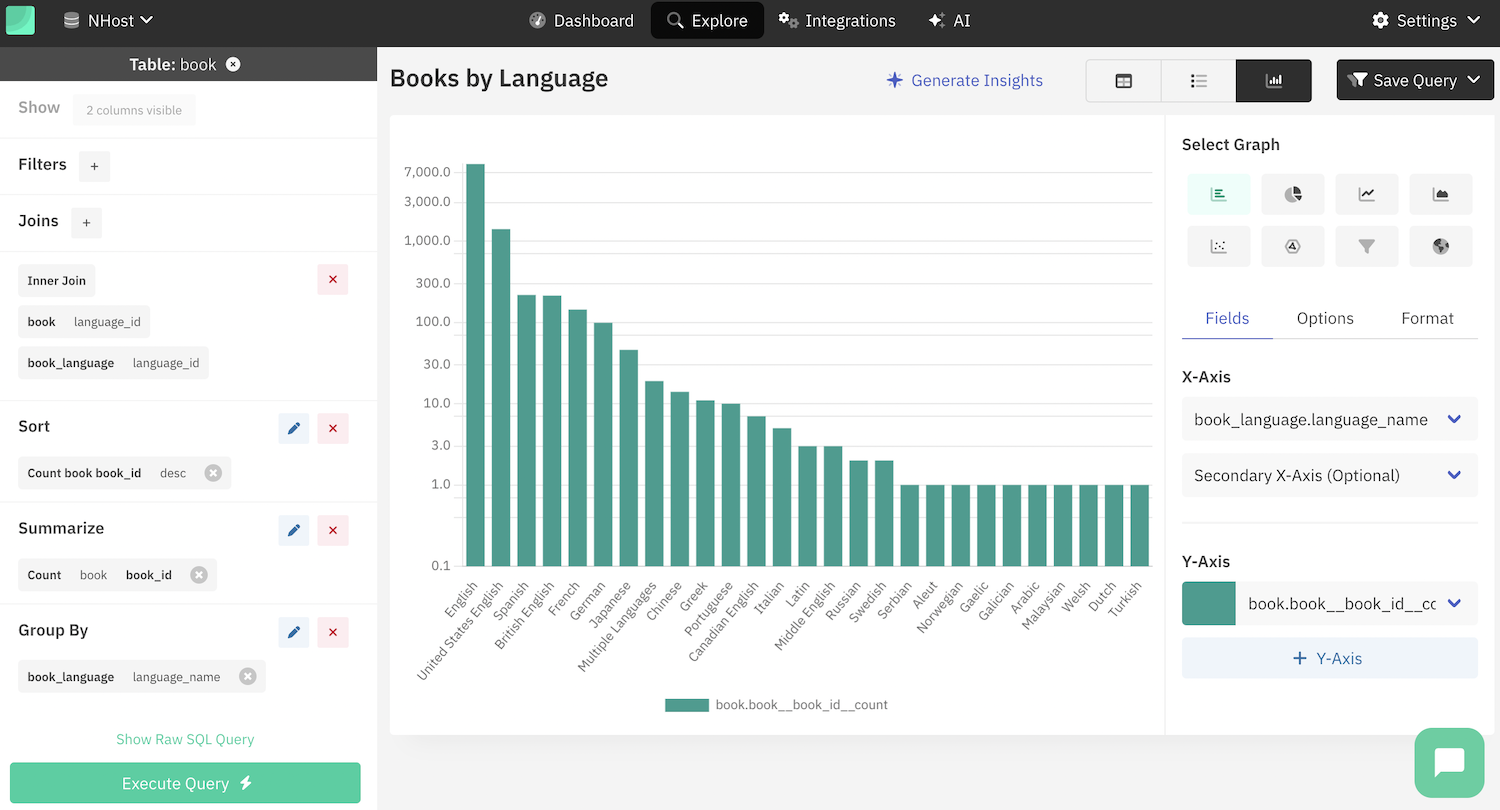
- Go to the Explore section on the navbar, then click on any of the tables on the left-hand side to open the no-code query builder. You can filter, group, and aggregate your data using the query builder.
- You can also click on the raw query button to start writing SQL queries to explore your data. Draxlr's SQL editor has a built-in autocomplete feature that makes writing queries a breeze.
Data Visualisation and Dashboards
Draxlr provides powerful visualisation and dashboard capabilities.
- After you've gotten the result of your exploration, you can click on the Graph button to visualise your data. Draxlr supports a wide range of visualisations, including bar charts, line charts, pie charts, and more.
-
Once you've created a visualisation, you can save your query using the Save query button. You can use the Add to Dashboard button to add your visualisation to a dashboard.
Monitoring Your Data
Monitoring allows you to make data-driven decisions quickly and steer your business in the right direction. You can use Draxlr's Slack and email alert systems to get alerts on your data's key metrics.
Remember, while technology provides the tools, it's your curiosity and questions that will drive real insights. Happy data exploring!
- Jaskaran Singh