How to Analyze Google Sheets Using BigQuery and Draxlr
Learn how to analyze Google Sheets data using BigQuery and Draxlr. Visualize your data, gain insights, and create interactive dashboards effortlessly.
For businesses, data-driven decisions are essential for steering growth and strategy in the right direction. Google Sheets is an excellent tool for collecting and sharing information, but when your data grows or you need deeper analysis, it can quickly hit its limits. BigQuery changes that by letting you run fast, complex queries on massive datasets without performance issues. Paired with Draxlr, you can turn that data into clear, interactive dashboards in minutes (no technical skills required).
In this guide, you’ll learn how to:
- Connect Google Sheets to BigQuery.
- Connect BigQuery to Draxlr.
- Analyze and visualize your data using Draxlr’s AI and visual tools.
Connect Google Sheets to BigQuery
Connecting Google Sheets to BigQuery allows you to scale your spreadsheet-based workflows. Instead of working within the limits of Google Sheets, you can use BigQuery’s analytical power to query large datasets, join multiple sheets, and use SQL to find insights faster and more reliably.
Step 1:
- Prepare Your Google Sheet
- Ensure your data has a clear header row with proper column names.
Step 2:
- Visit Google BigQuery Console.
- Select an existing project or create a new one and then create/select the dataset.
Step 3:
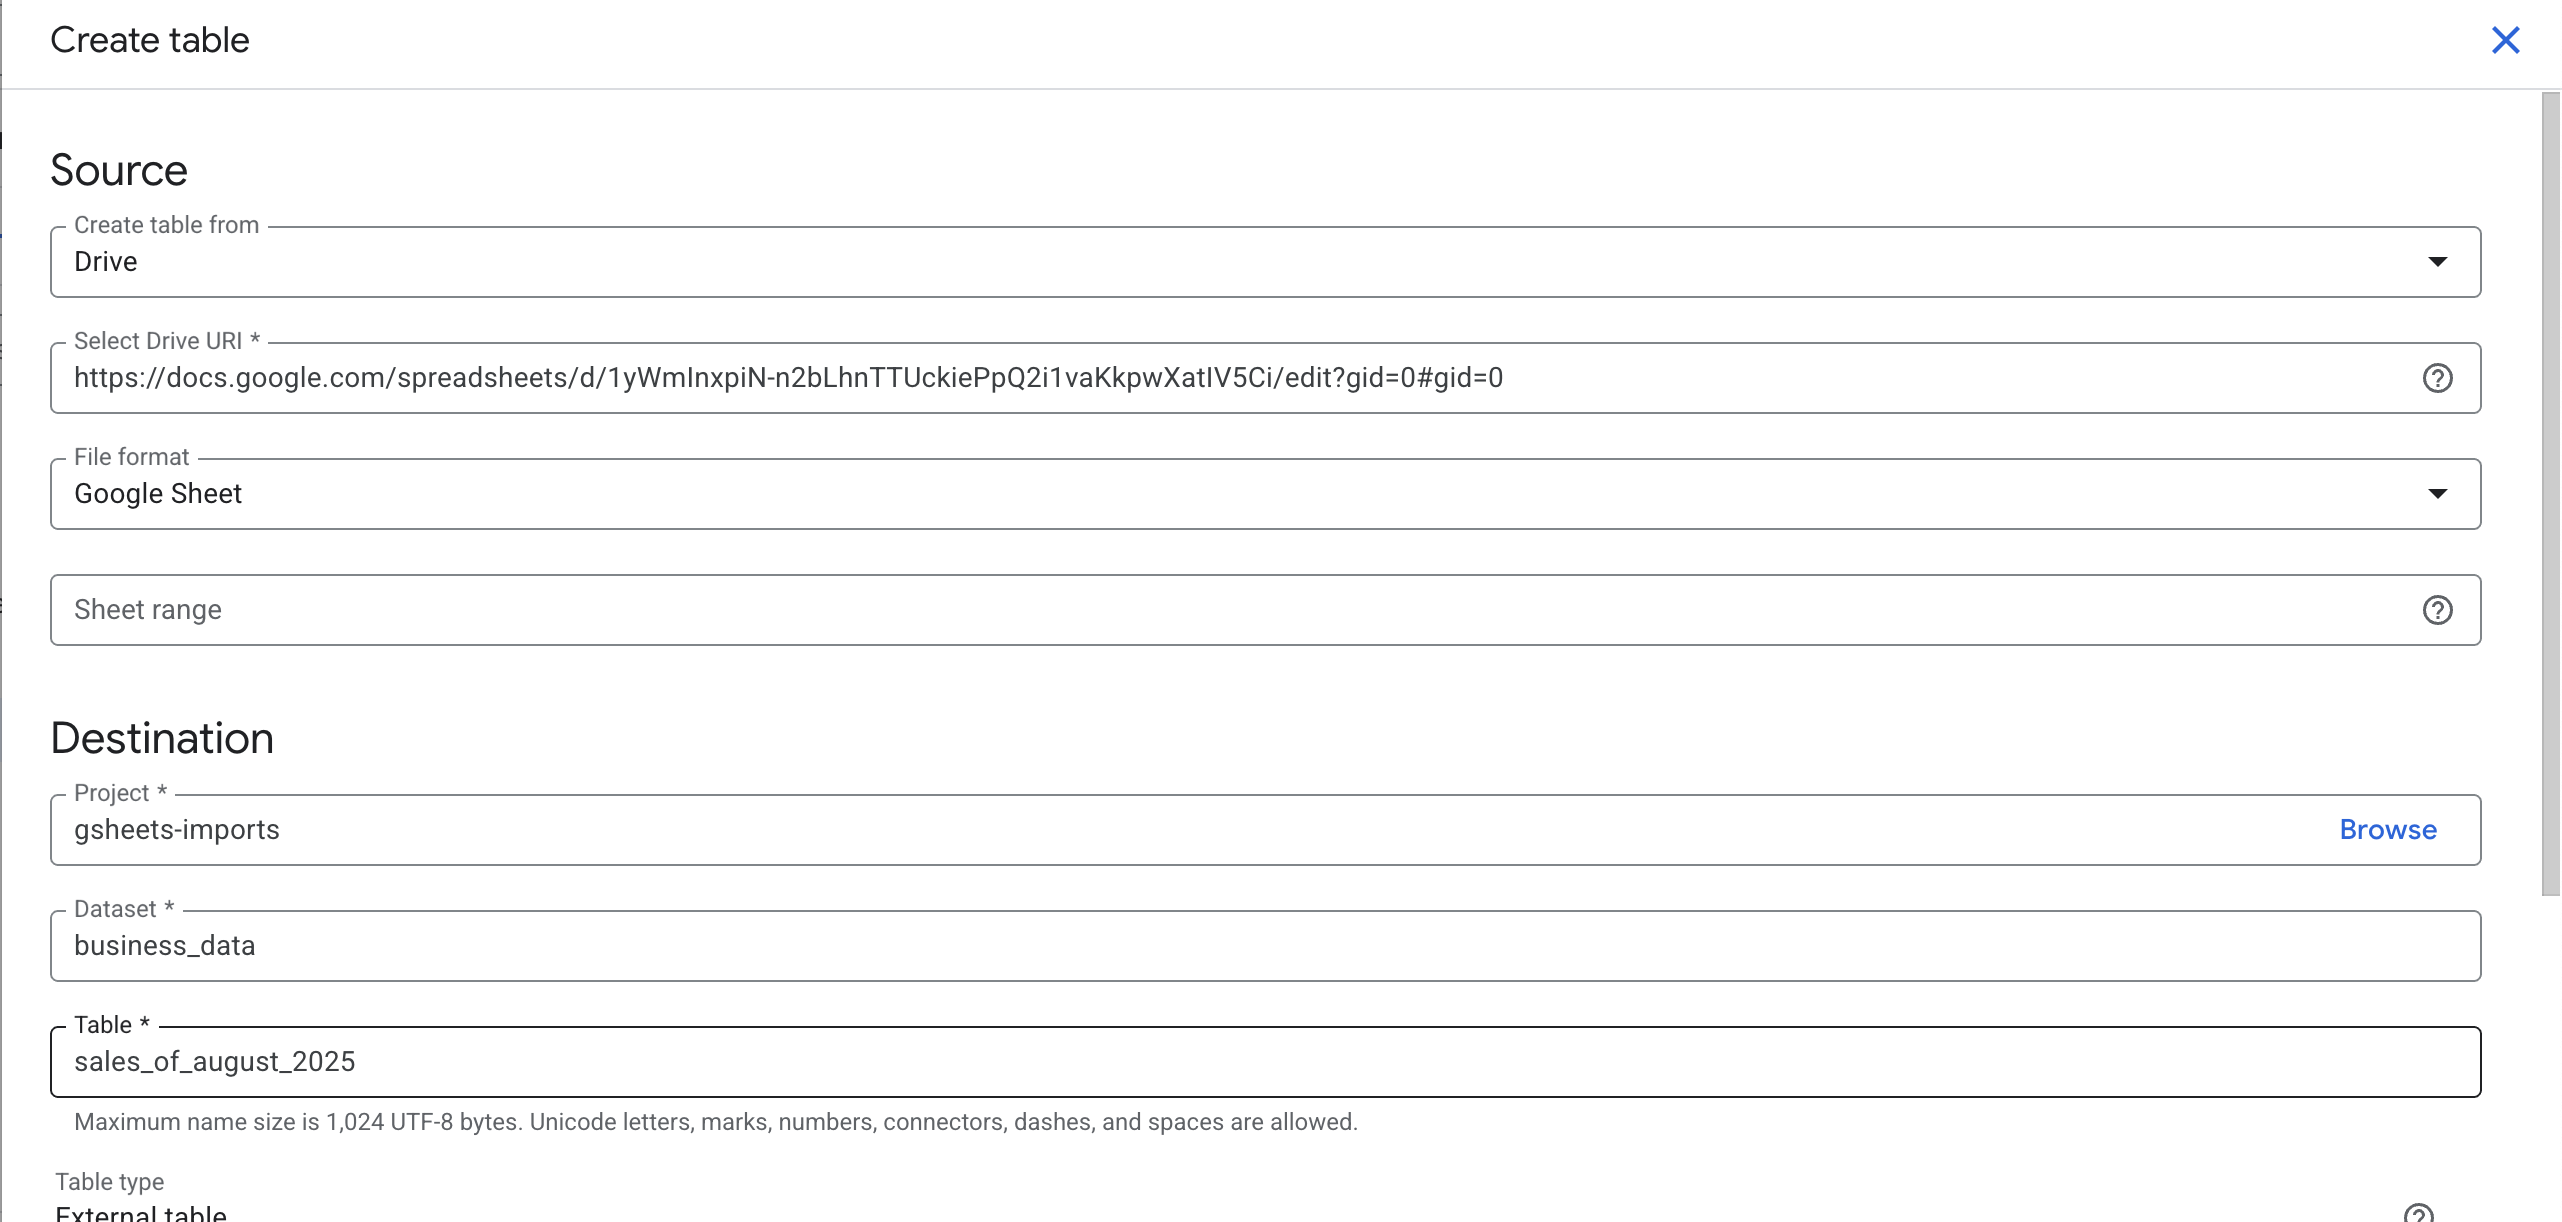
- Clicking on Create table and Choose Google Drive as Create table from option.
- Paste your shareable Google Sheets URL.
- Select Google Sheets as the format.
- Confirm header row and configure column types.
- Save and your Google Sheet is now available as a BigQuery table ready for analysis.
Make sure to share the google sheet with the service account email of your BigQuery project.
Connect BigQuery to Draxlr
Once your data is in BigQuery, Draxlr helps you explore and understand it using AI-generated queries or SQL queries. This connection enables businesses to gain valuable insights without relying heavily on technical teams, making it easier to drive decisions across teams.
- Go to Draxlr and sign in
- From your dashboard, click on "+ Connect a Database"
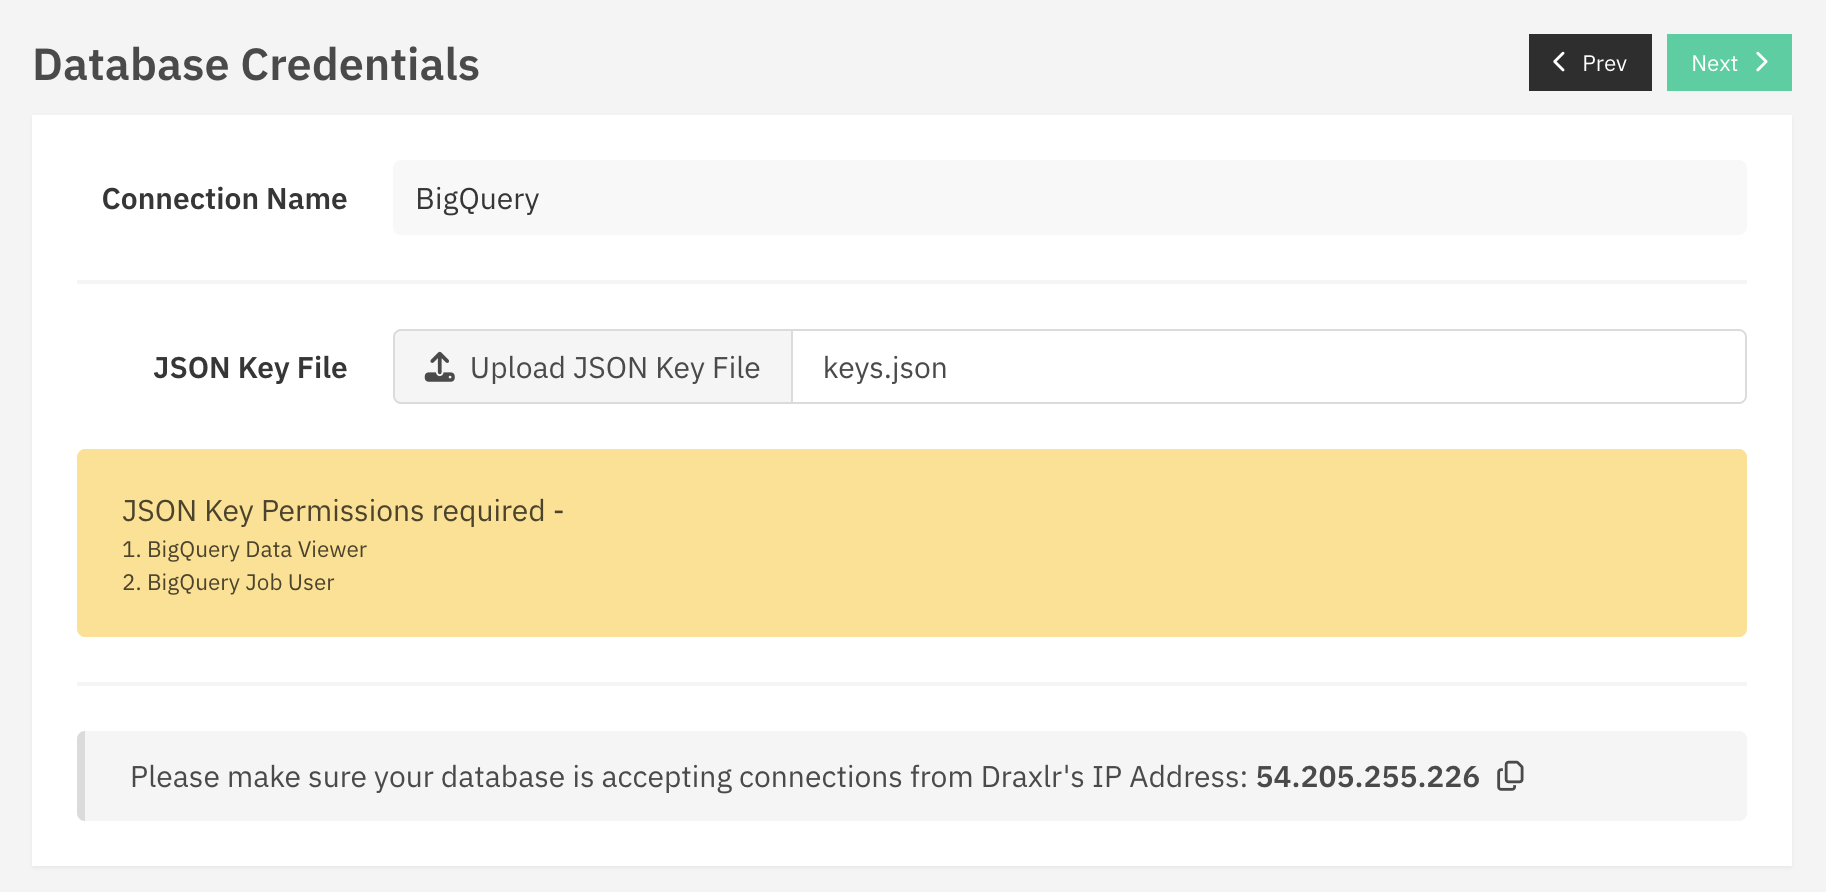
- Select BigQuery and provide the required details:
- Connection Name
- Service Account JSON Key
- Click on "Next" and Draxlr will connect to your BigQuery project and sync your tables.
Analyze Your Sheet Data in Draxlr
With the connection set up, you can now explore and analyze your spreadsheet data in depth. Draxlr currently supports two methods for working with BigQuery data: the AI Query Builder and SQL editor. These tools help uncover trends, segment data, and extract key business metrics quickly and efficiently.
AI Query Builder
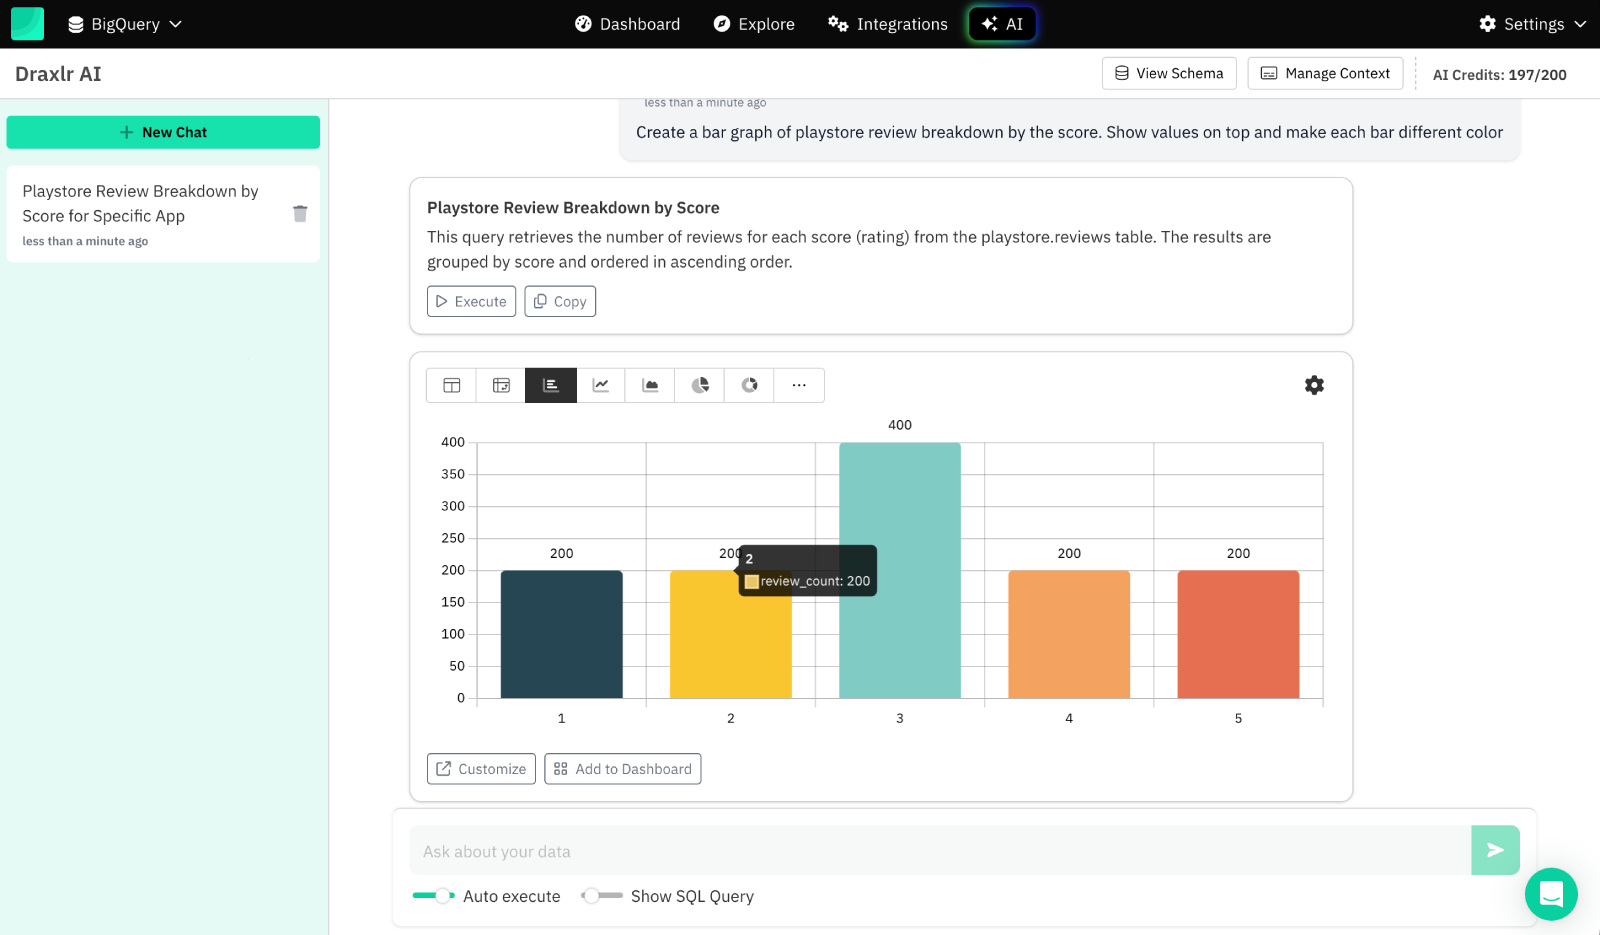
- Type your request in plain language (e.g., "Show revenue growth by quarter").
- Draxlr generates the SQL and runs the query for you, making analysis accessible to non-technical users.
- Draxlr will automatically generate Graphs and Charts based on the query results, allowing you to visualize your data instantly.
SQL Editor
- Use standard SQL to run advanced analytics, join datasets, or filter records.
- You can visualize the results using table, dashboard table or charts.
- Ideal for users comfortable with writing custom queries.
Note: Query Builder for BigQuery is coming soon.
Visualize and Share Insights
Turning data into action requires clear communication. Draxlr helps you create interactive dashboards and reports, making insights easy to digest and share with your team, stakeholders, or clients - all without leaving your browser.
- Once you have saved your queries, you can visualize the results using Draxlr's built-in charting tools.
- You can use these saved queries to build interactive dashboards that update automatically as your data changes.
- You can share these insights with your team or stakeholders by inviting them to Draxlr, sharing the public link or embedding them in your own application.
Conclusion
For businesses, the ability to quickly transform raw data into actionable insights is critical. By combining Google Sheets, BigQuery, and Draxlr, you get the flexibility of spreadsheets, the speed and scale of enterprise-grade SQL, and the clarity of visual analytics - enabling informed, data-driven decisions.
Start analyzing your Sheets data with Draxlr today
Connect your BigQuery Database- Jaskaran Singh

