Supabase Business Intelligence: The Complete Guide
Supabase business intelligence guide featuring Draxlr with AI SQL, dashboards, automations, and embedded analytics for fast-moving SaaS teams.

Business intelligence (BI) has become essential for SaaS teams working with Supabase. While Supabase gives you a powerful Postgres backend, managing analytics, dashboards, and insights at scale requires more than ad-hoc SQL queries.
In this extensive guide, we explore why BI matters for Supabase teams, what challenges developers face as their data grows, and how Draxlr provides a modern, AI-powered, SQL-centric BI layer built specifically for fast-moving engineering teams.
Why Supabase Needs Business Intelligence?
Supabase gives developers:
- A managed Postgres database
- Authentication
- Storage
- Edge functions
- Realtime APIs
While this makes it an excellent backend for SaaS teams, analytics quickly become a bottleneck:
- Product teams need user metrics.
- Sales teams want customer reports.
- Founders want dashboards.
- Finance teams need revenue insights.
Supabase’s built-in SQL editor is powerful but not meant for ongoing BI. As data grows, teams need:
- Repeatable dashboards
- Shared queries
- Visualization tools
- Access controls
- Embedded analytics
This is where a BI layer becomes essential.
Common BI Challenges for Supabase Teams
a. Rewriting the same queries again and again
Teams often duplicate SQL or maintain scripts in Notion, GitHub, or documents.
b. Building internal dashboards consumes engineering time
Creating custom charts, UIs, performance layers, and API endpoints turns into a multi-sprint effort.
c. No streamlined role-based access
Not everyone should see production data.
d. Ad-hoc SQL is not scalable
One-off queries slow down or produce inconsistent insights.
e. No customer-facing analytics
Building embedded dashboards from scratch is expensive.
What to Look for in a Supabase BI Tool
A strong BI tool should:
- Connect directly to Supabase Postgres
- Provide a fast query layer
- Support SQL, AI SQL, and visualizations
- Enable embedded dashboards
- Offer SDKs, APIs, and exports
Draxlr checks all these boxes.
Introducing Draxlr: BI Designed for Supabase
Draxlr is a modern business intelligence platform built for engineering-led teams who want simple, SQL-friendly analytics.
Why Supabase developers prefer Draxlr?
- Connects directly to Supabase Postgres
- No ETL
- Setup in under 2 minutes
- SQL-first with AI assistance
- React/Vue embeds
- Multi-tenant support
- Clean UI for technical and non-technical users
Draxlr turns raw Supabase tables into dashboards within minutes.
Key Draxlr Features for Supabase Analytics
1. AI Chat for SQL (text-to-SQL)
Draxlr generates SQL queries + charts from natural language prompts such as:
- “Weekly active users for last 6 months”
- “Group orders by status”
- “Monthly revenue in 2024”
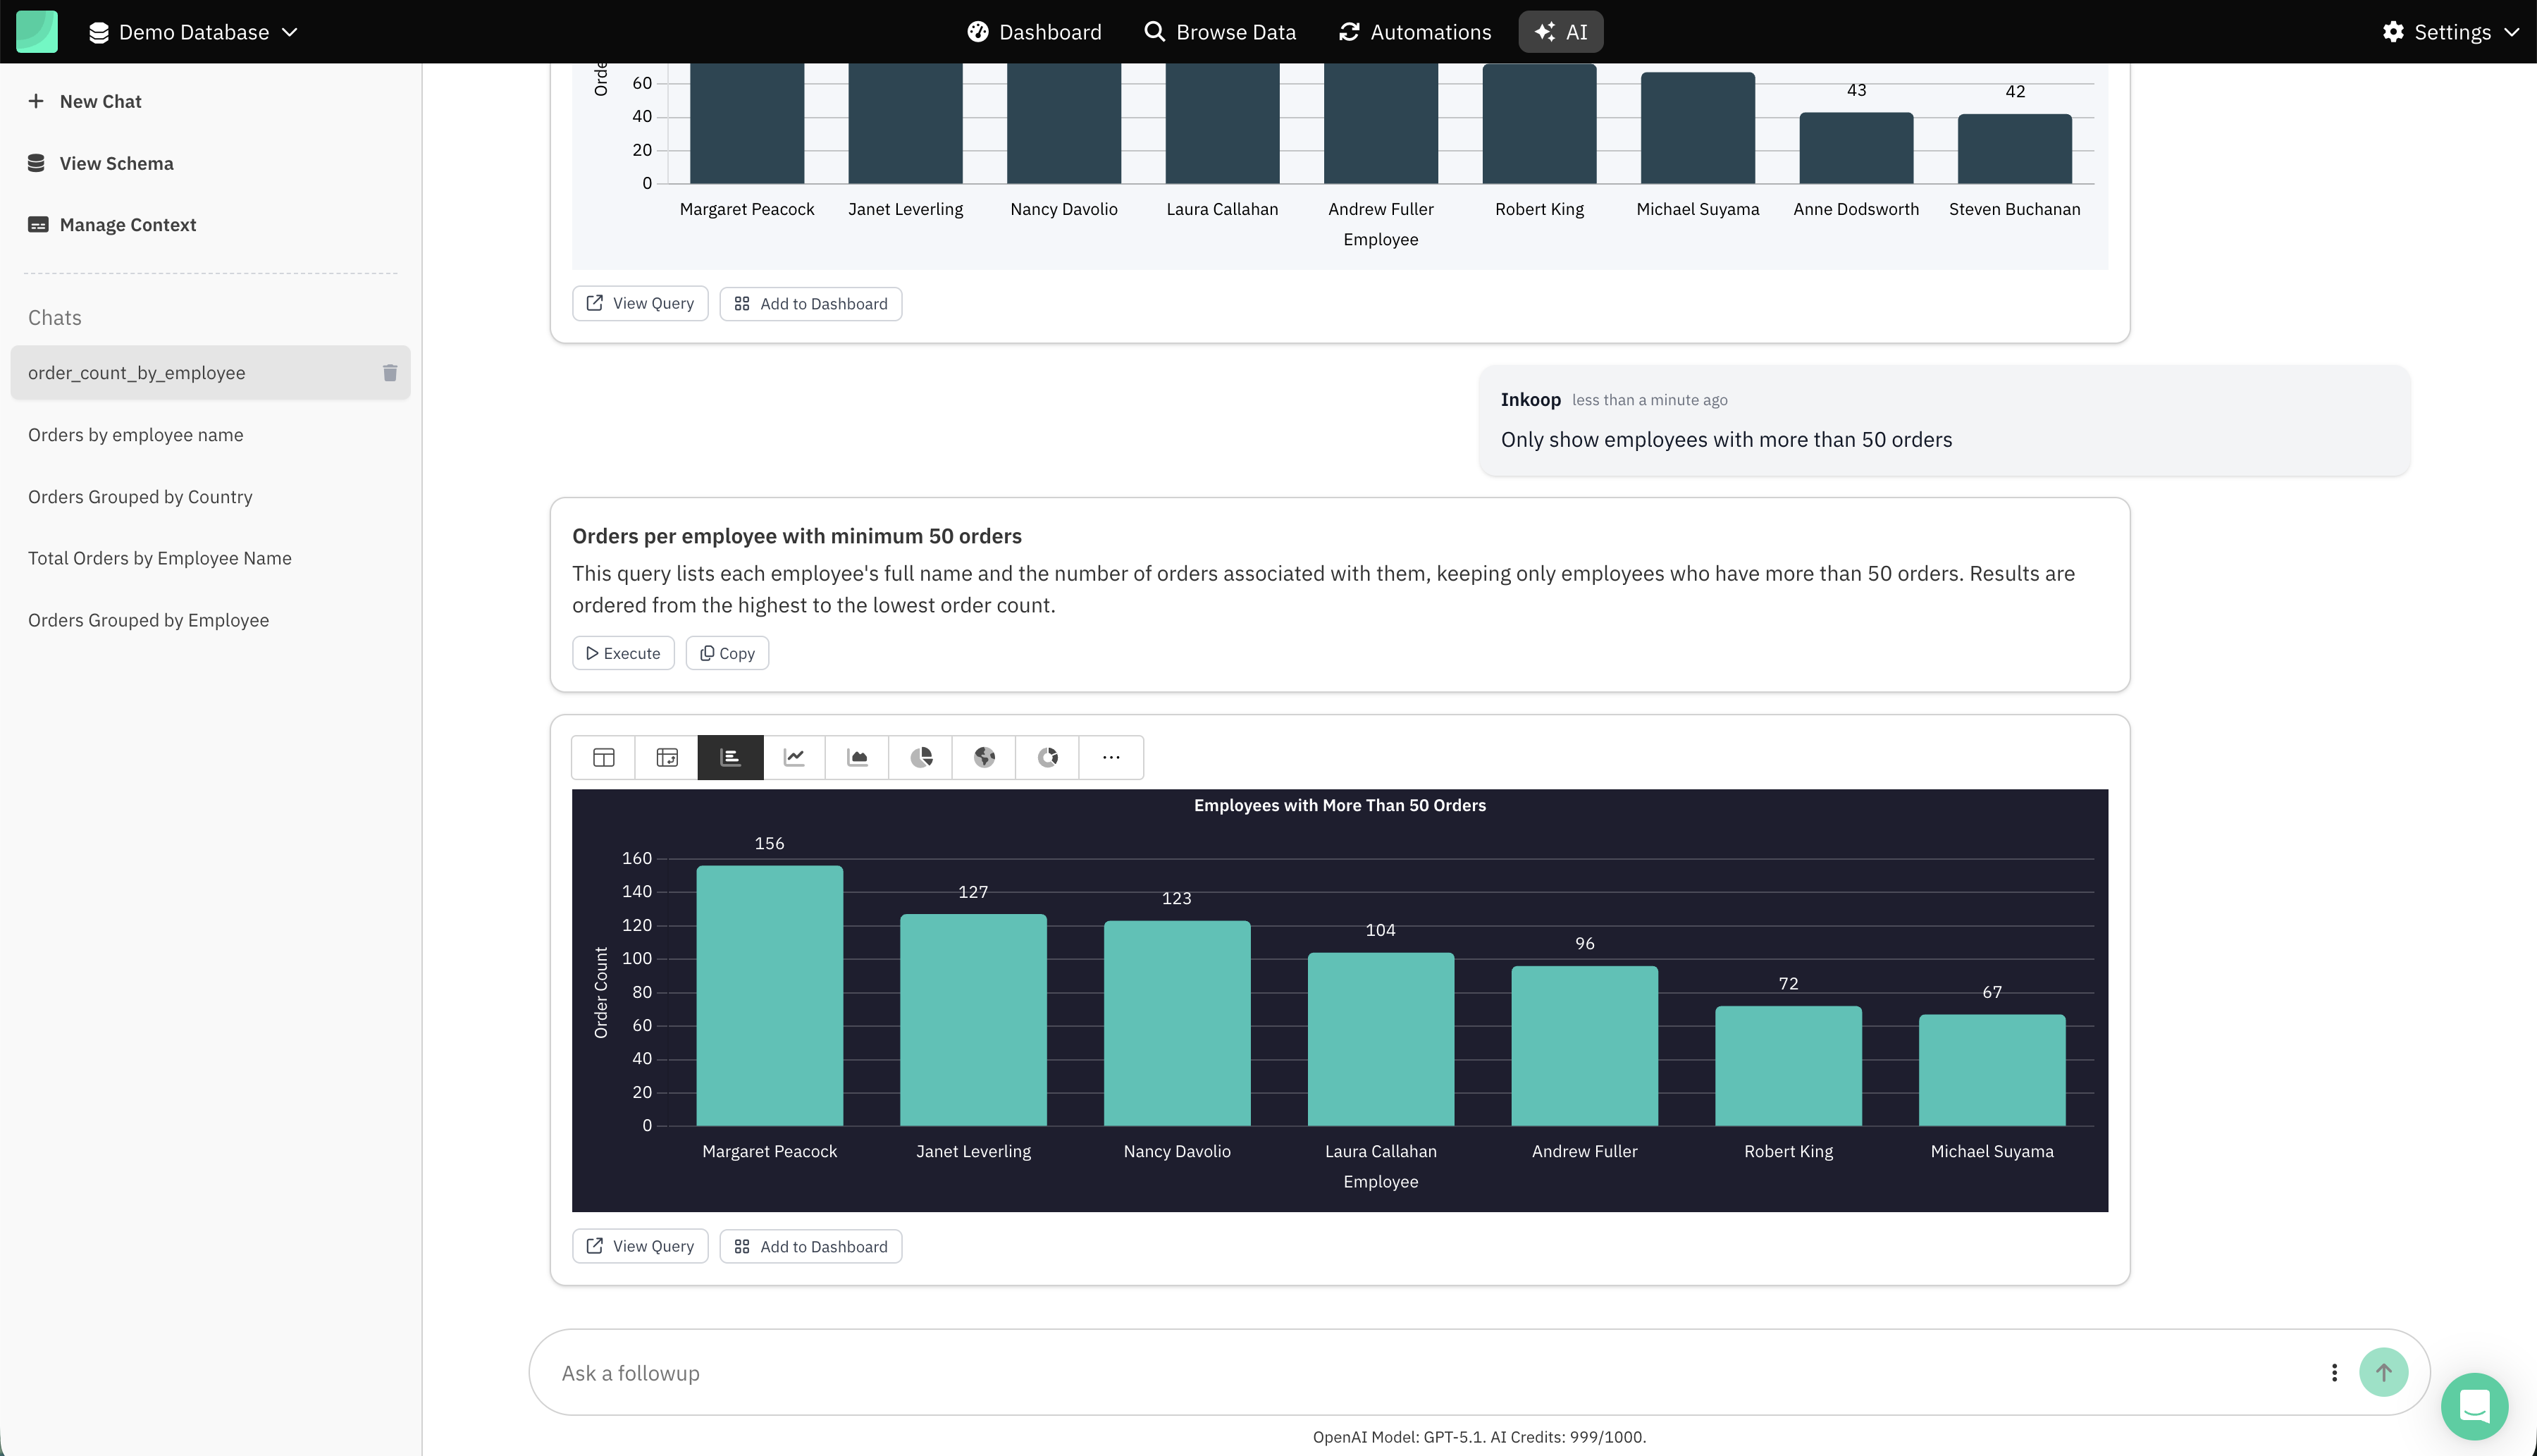
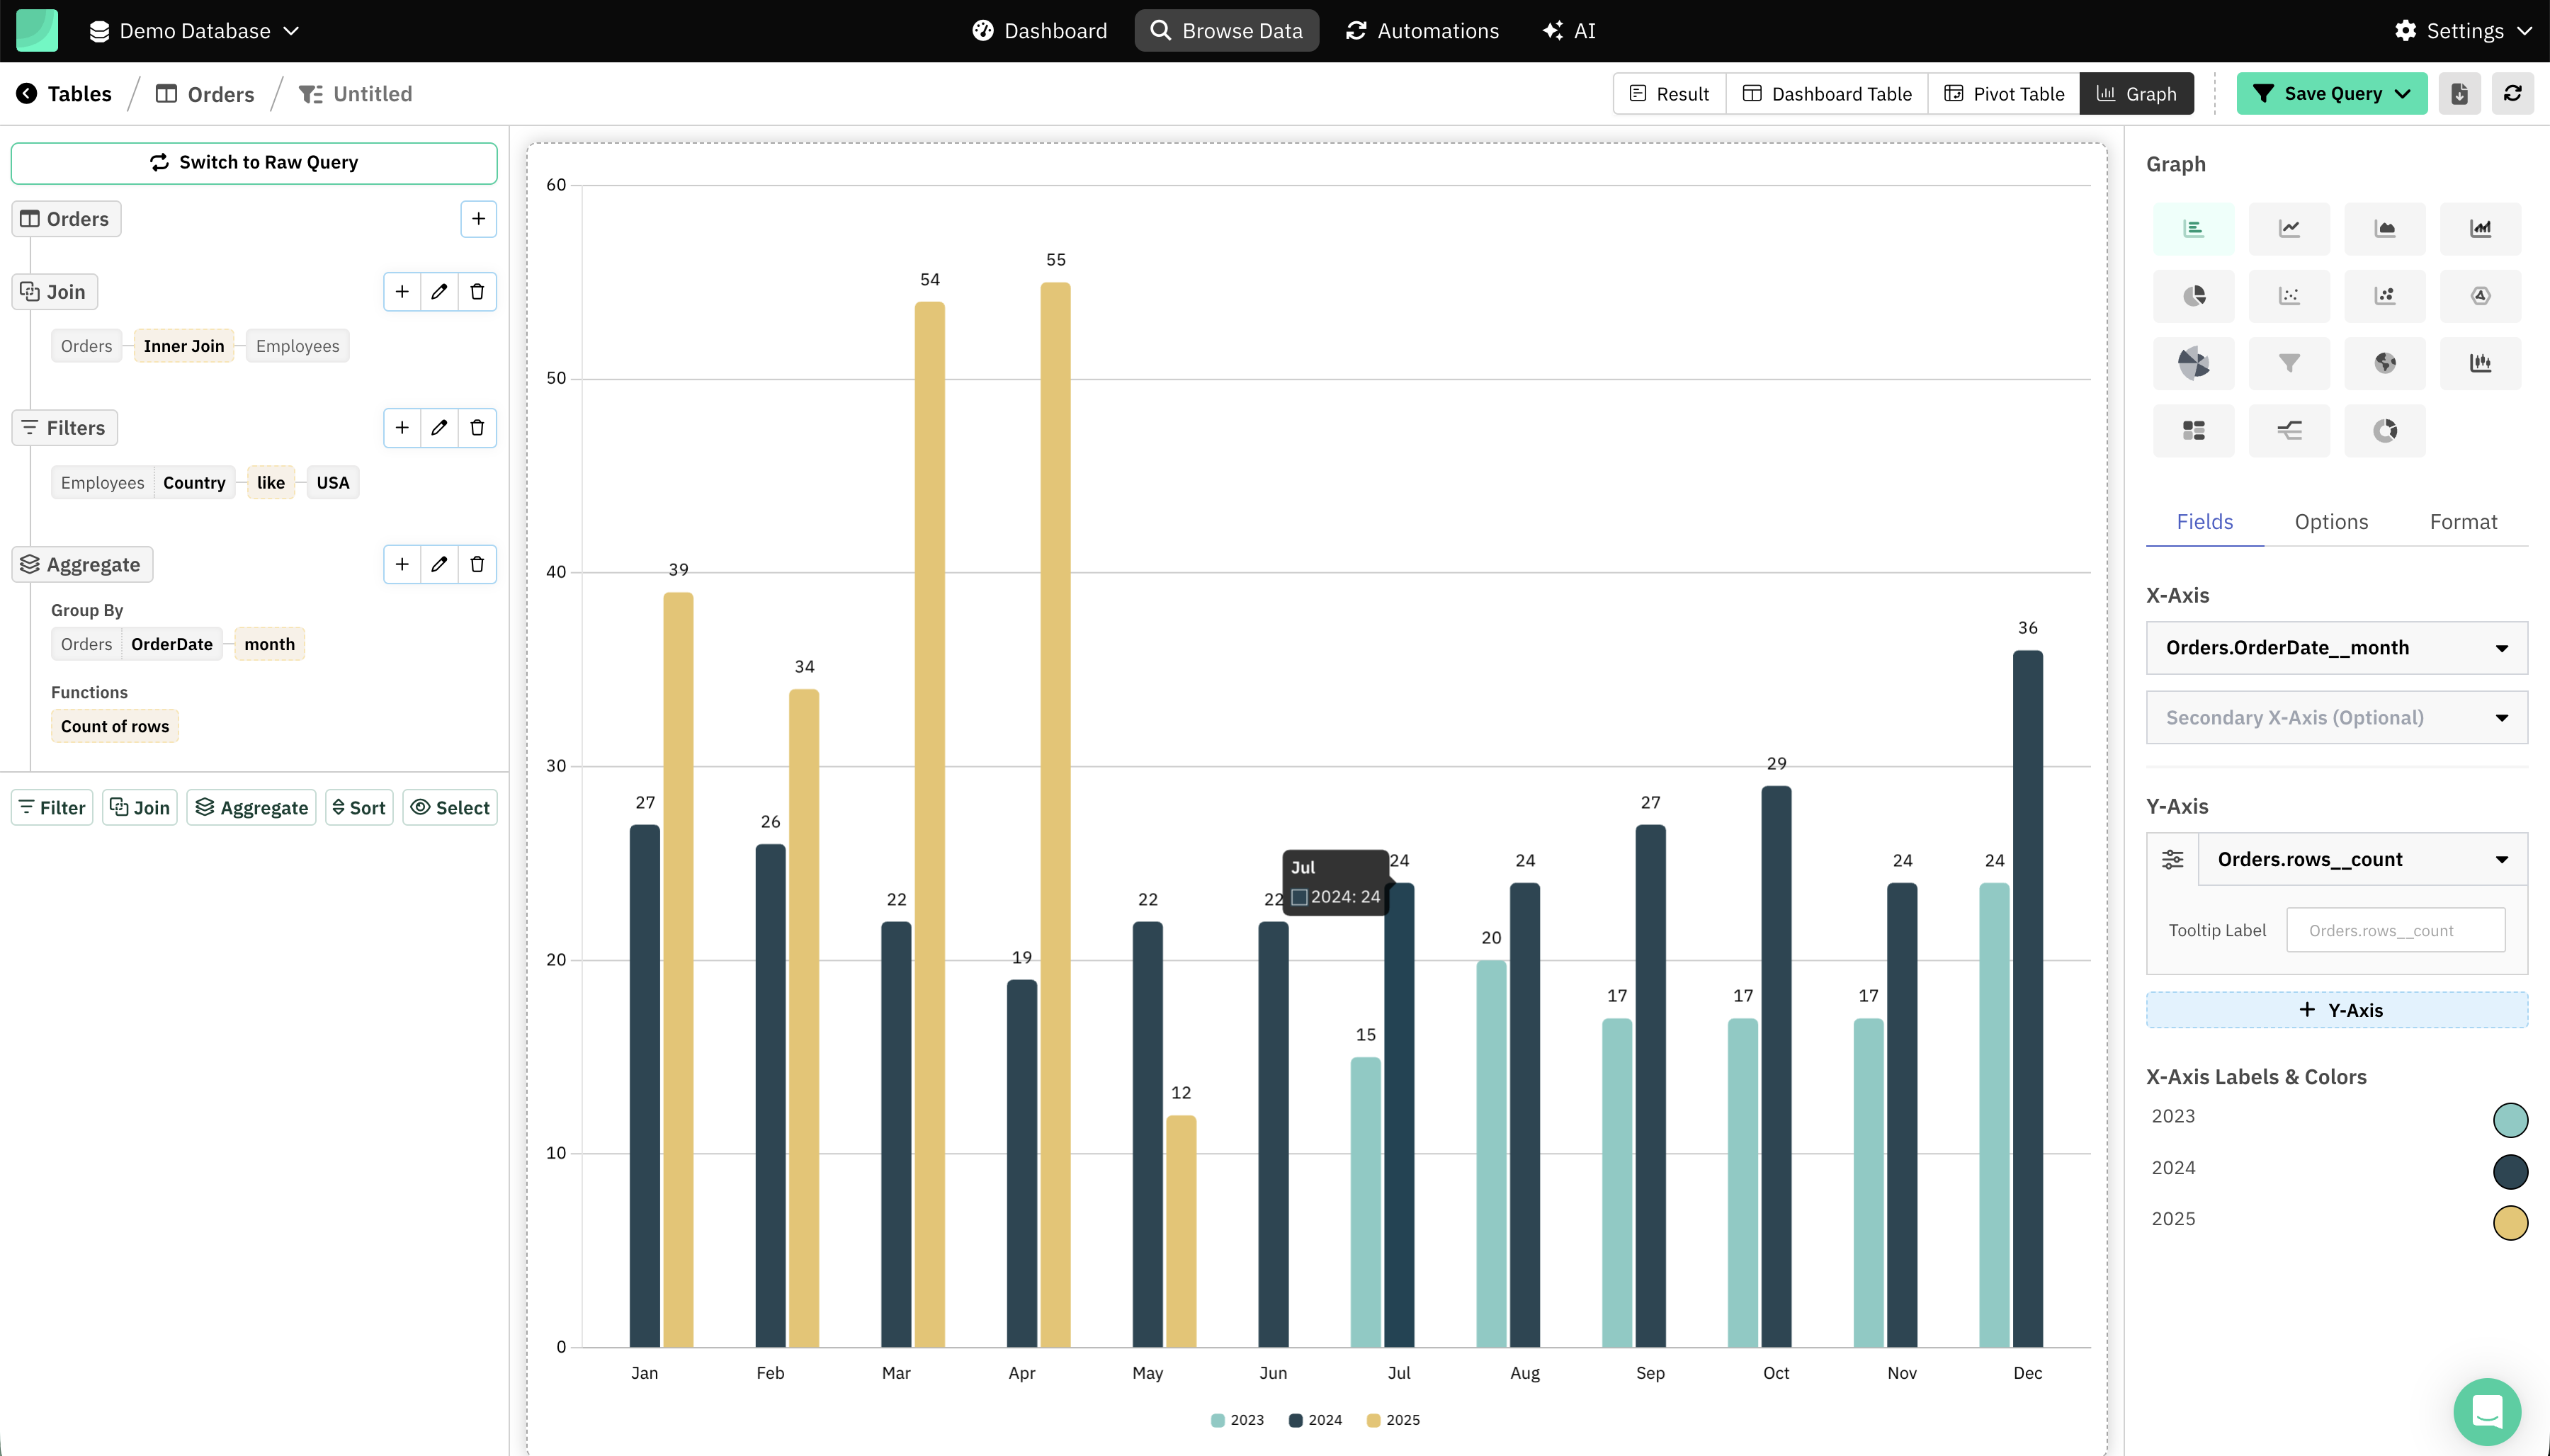
2. Visual Query Builder
A no-code builder with:
- Filters
- Aggregations
- Joins
- Sorting
- Grouping
Great for non-technical teammates.
3. Full SQL Editor
Developers get:
- Schema autocomplete
- Syntax highlighting
- Saved query library
- Query variables like
{{country}}
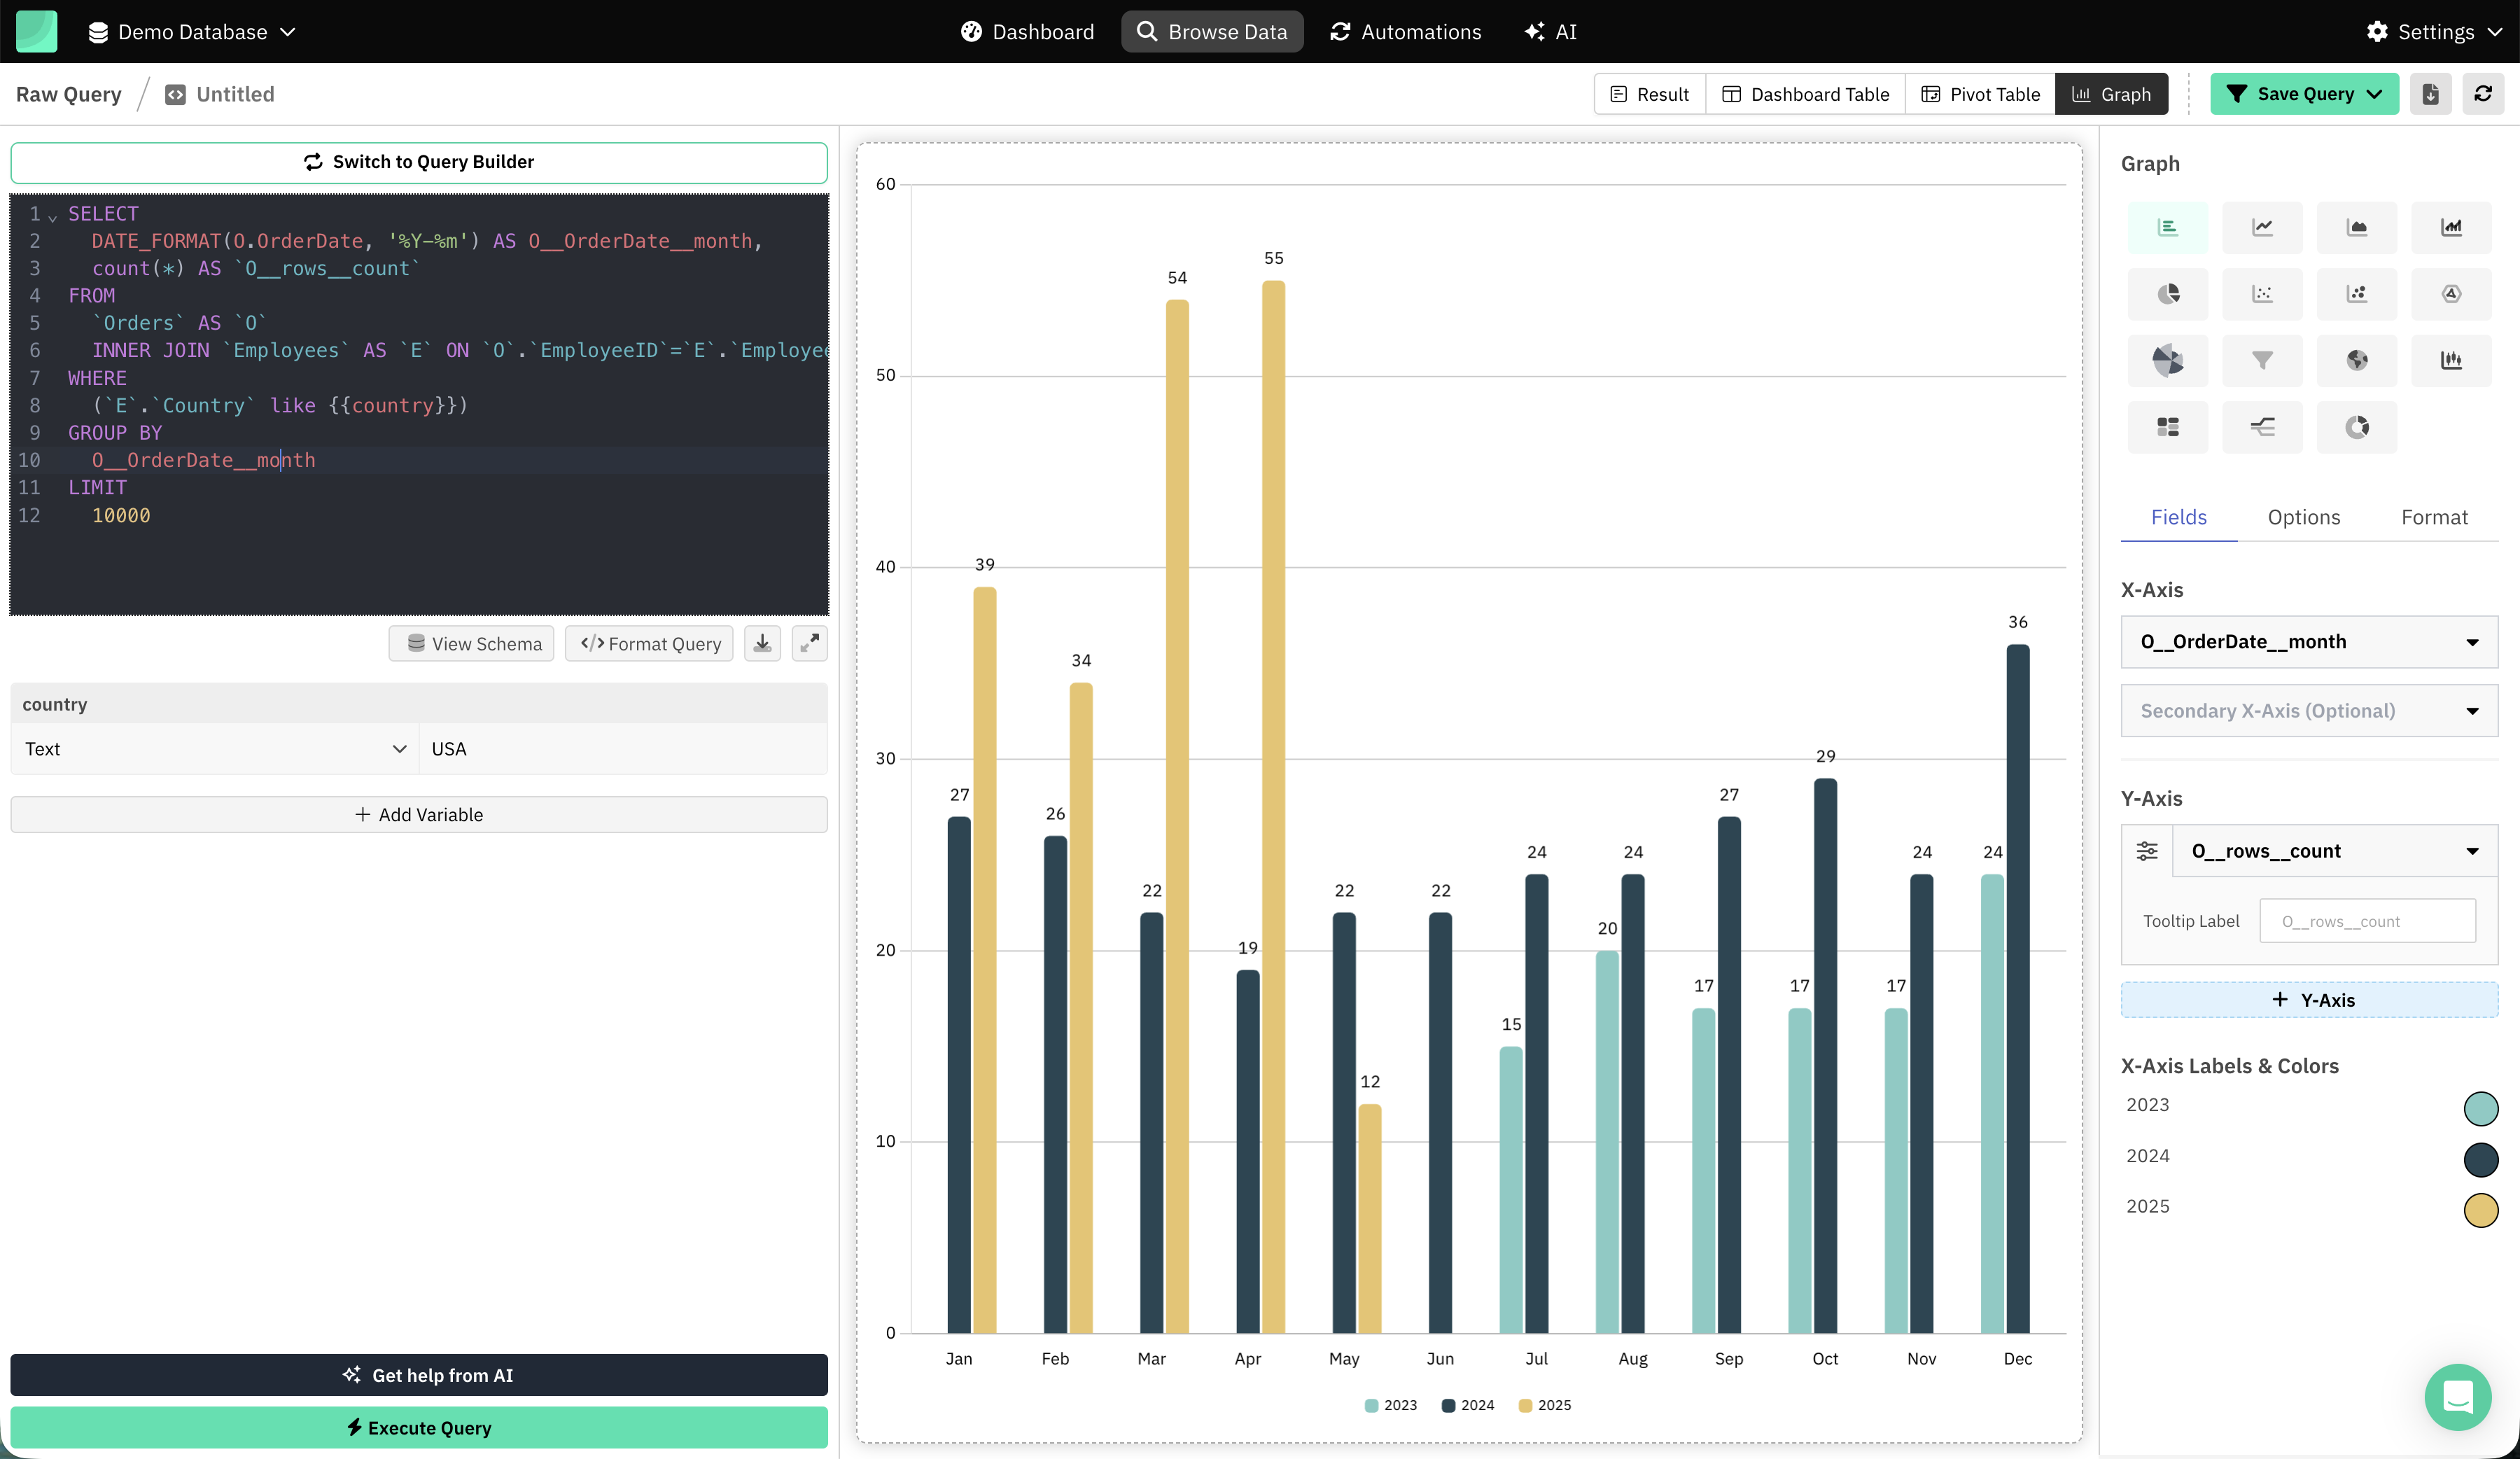
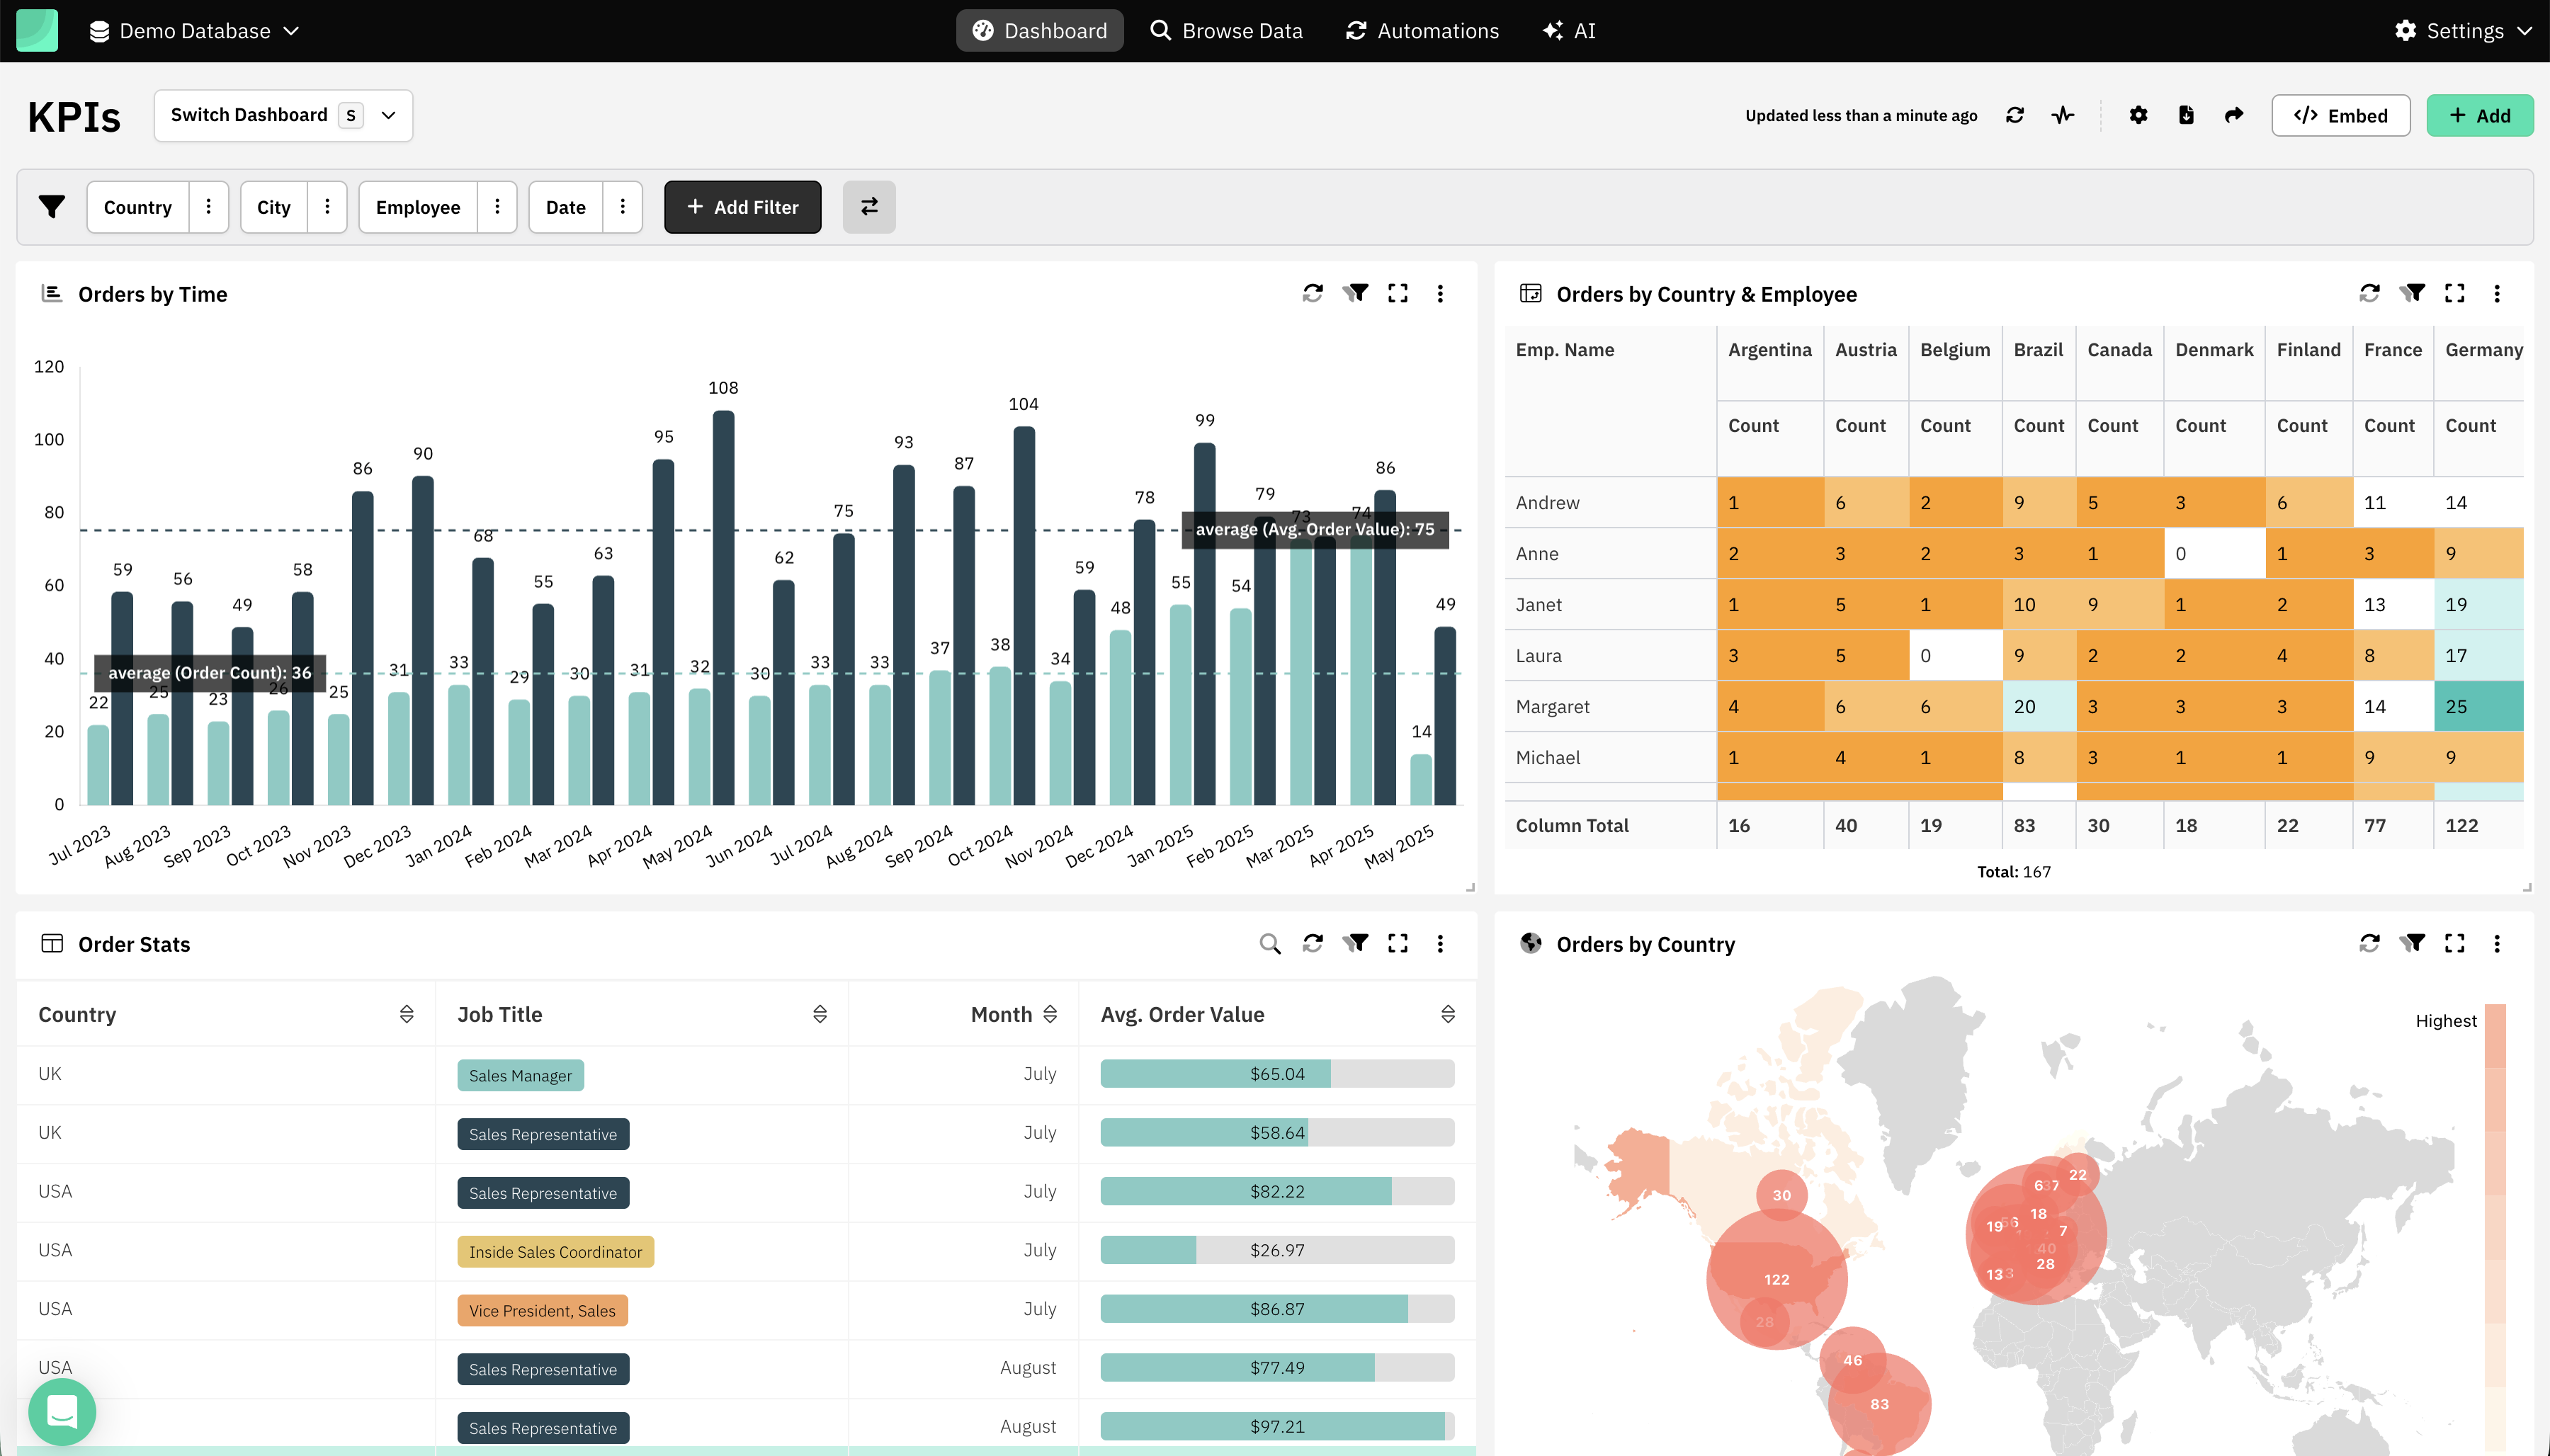
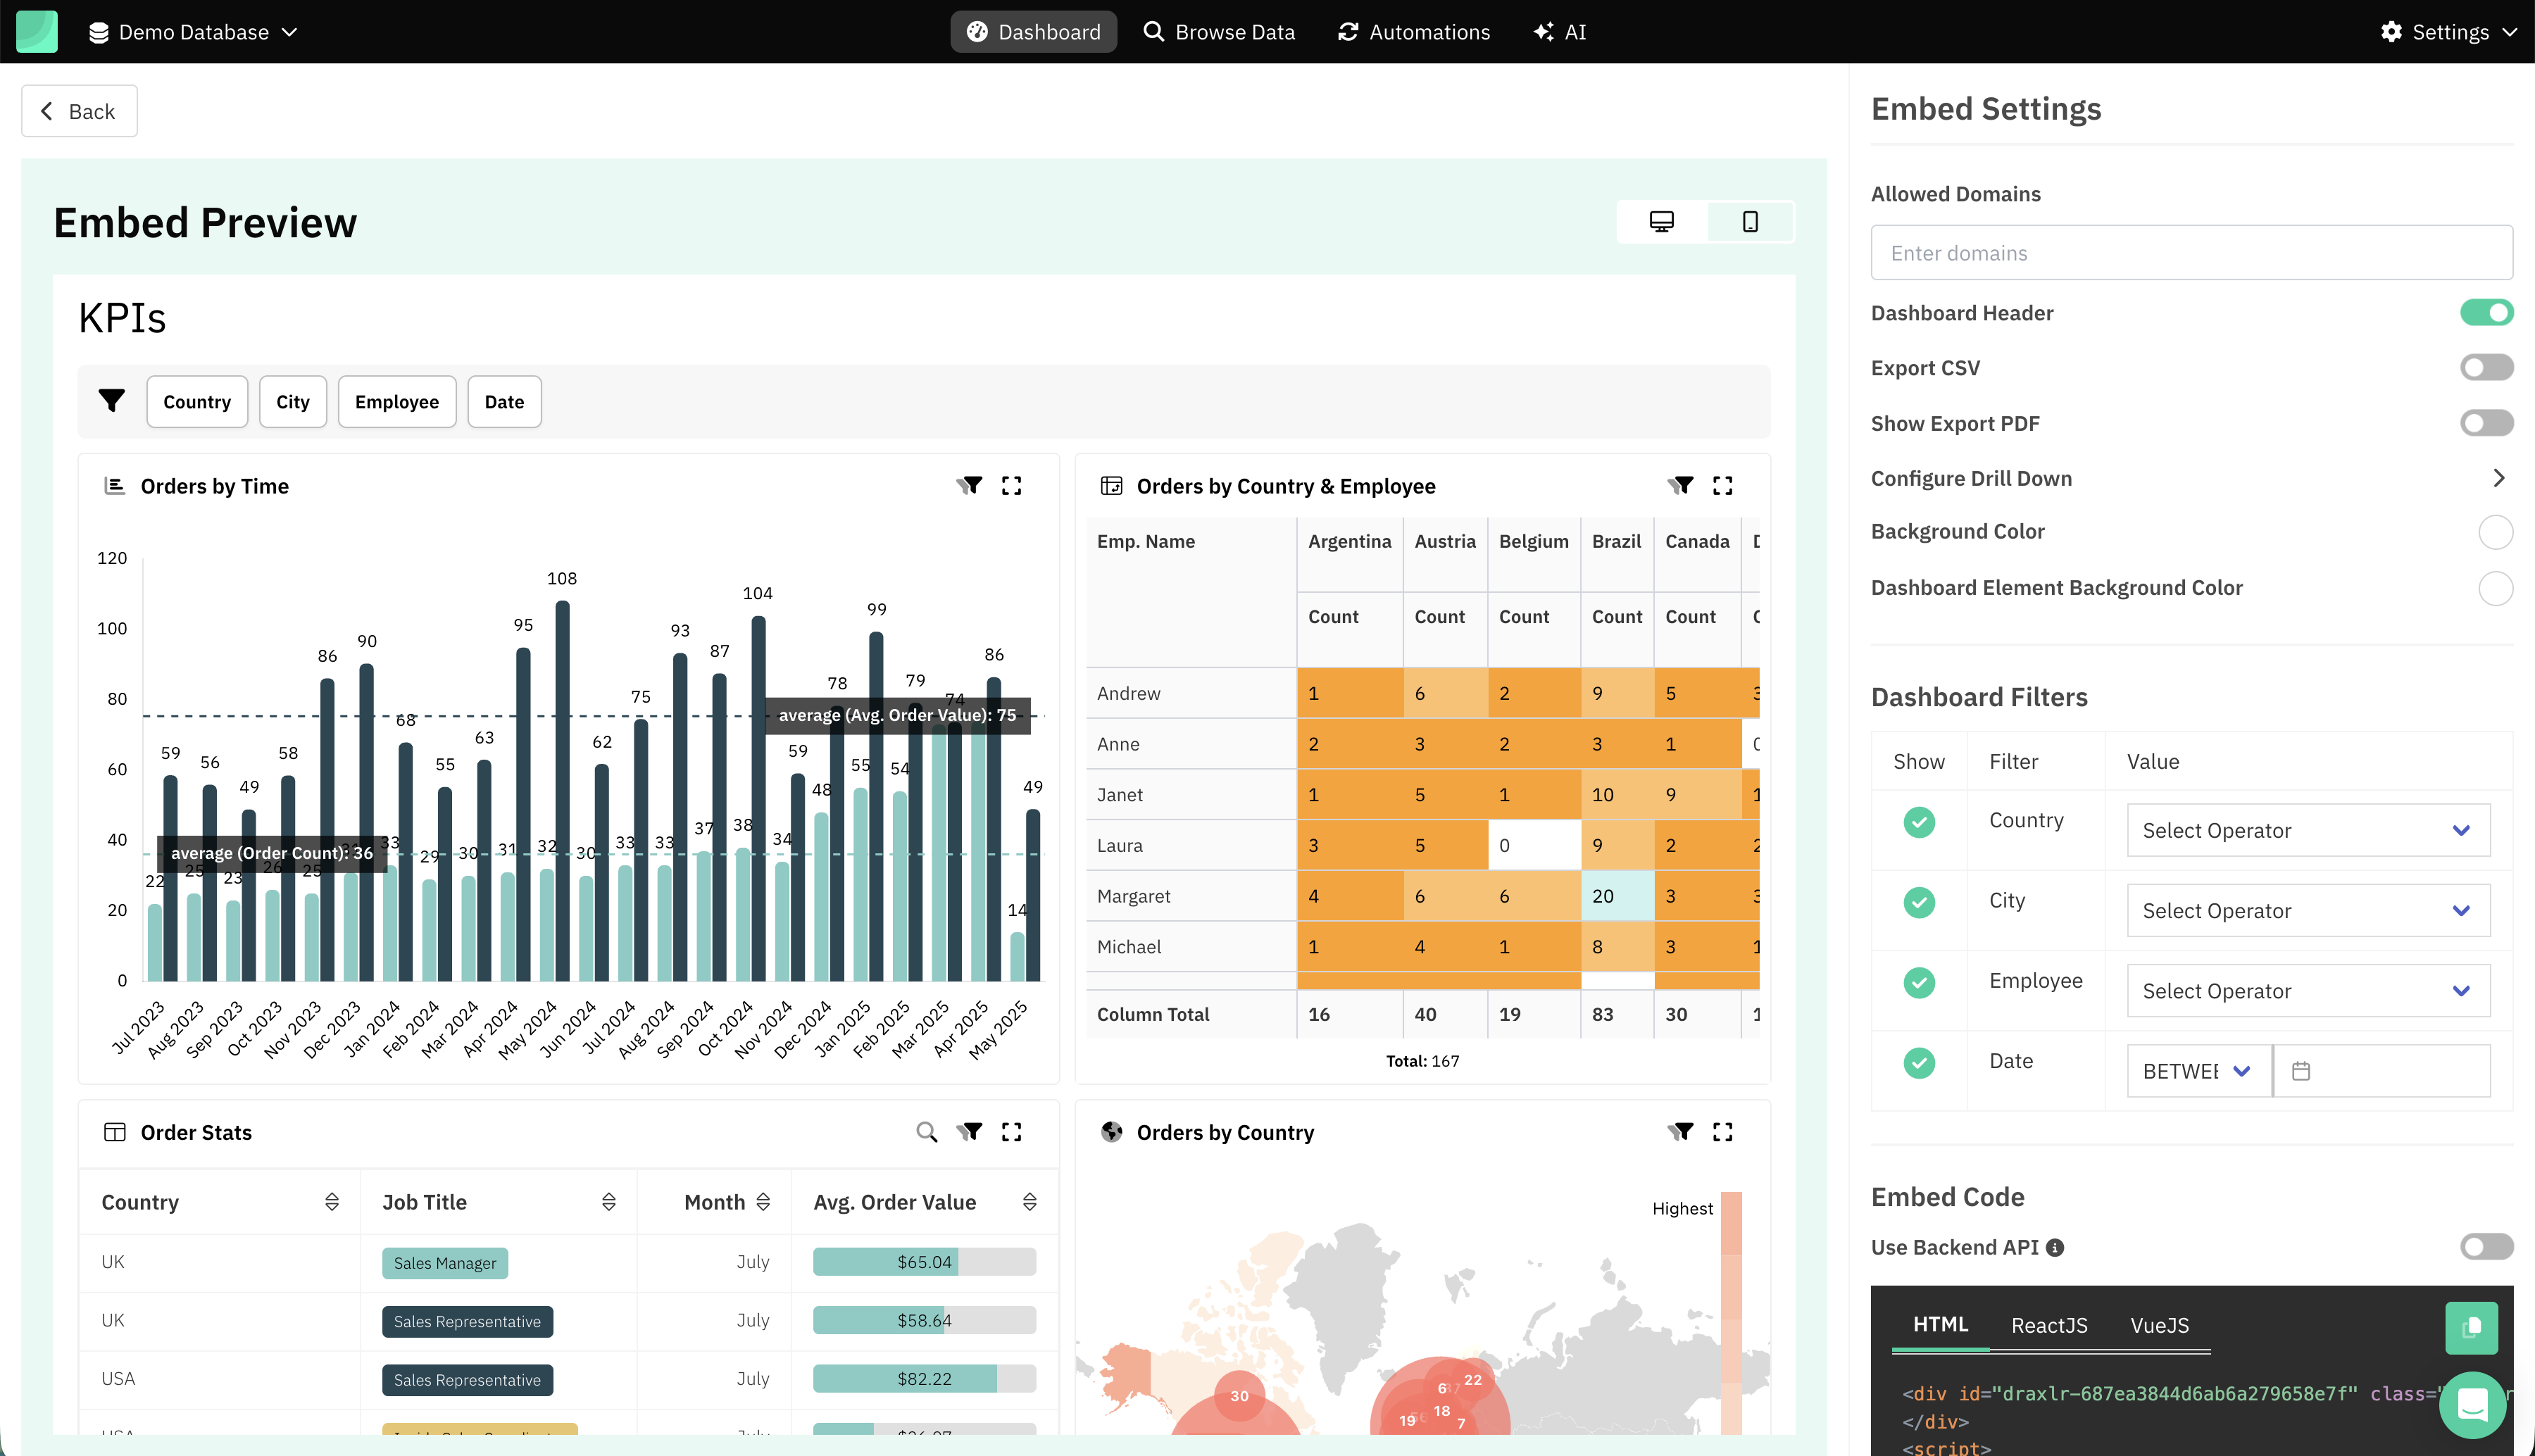
4. Dashboards & Visualizations
Supports:
- Line, bar, area, pie charts
- KPI cards
- Tables
- Pivot tables
- Drill-through
- Filters
Dashboards are shareable and embeddable.
5. Embedded Analytics
Draxlr offers:
- React & Vue SDKs
- iFrame embeds
- Row-level filters
- Multi-tenant views
- Secure embed tokens
Ideal for SaaS customer analytics.
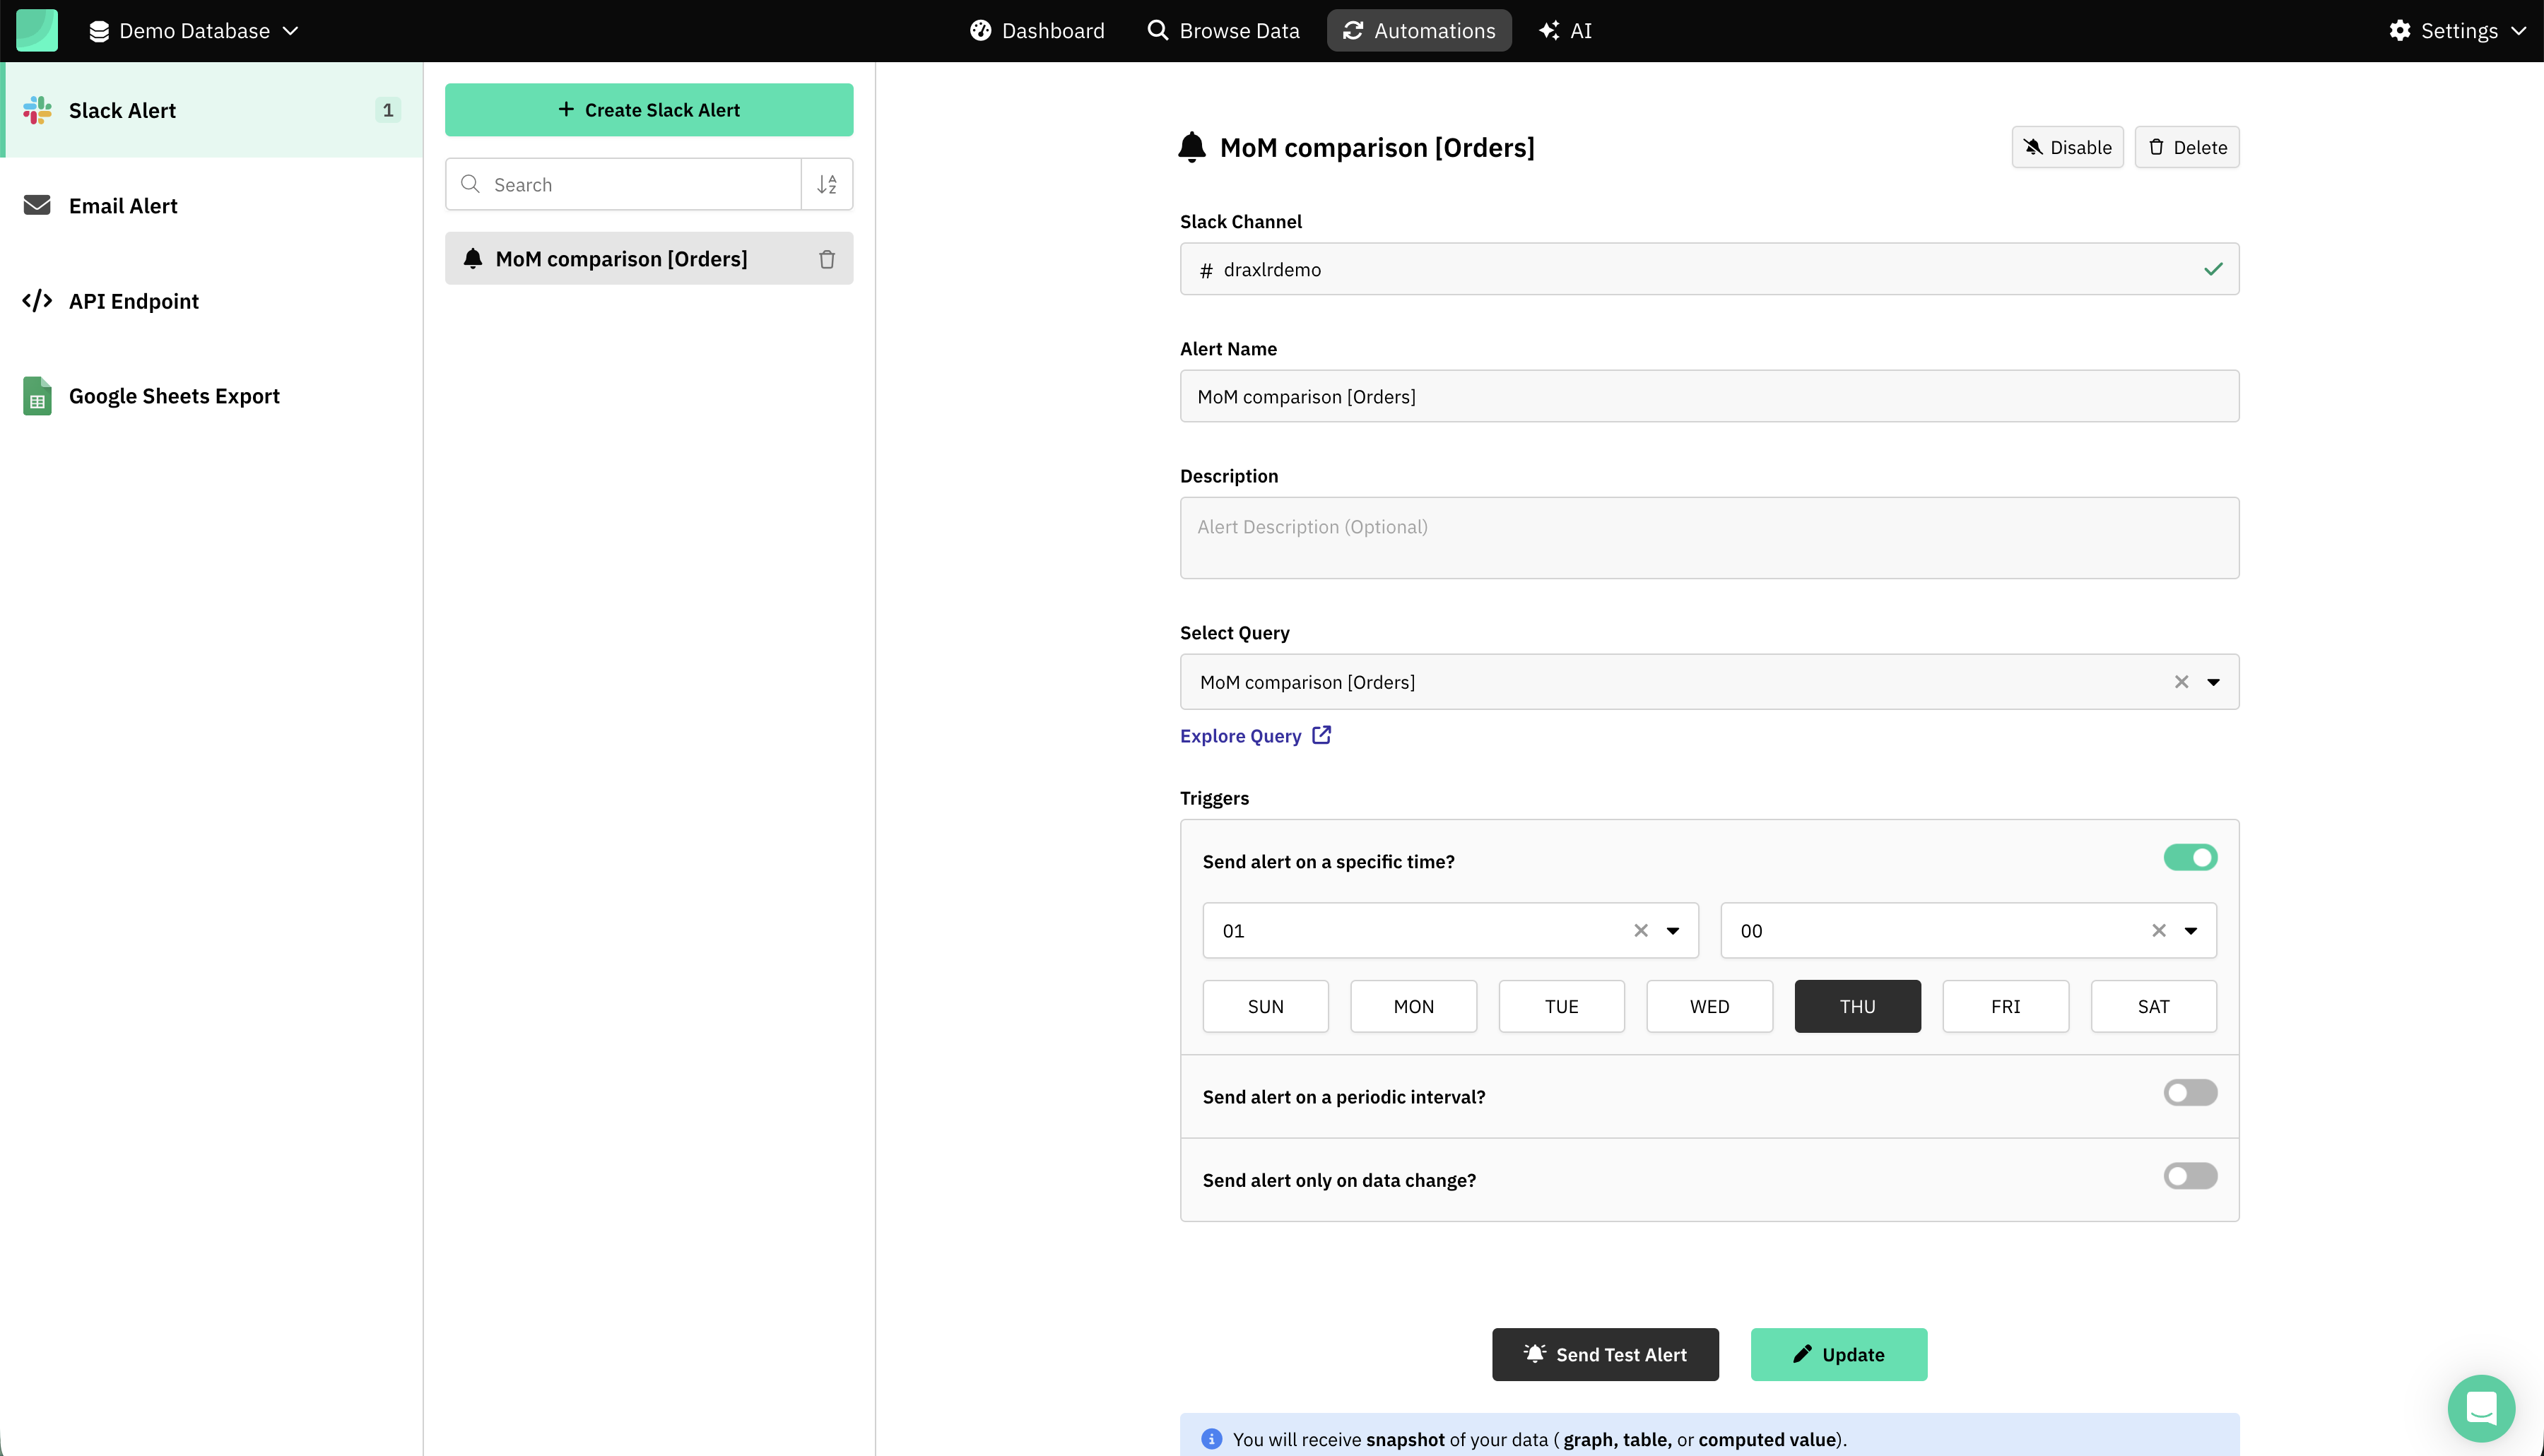
6. Automations
- Slack Alert
- Email Alert
- Google Sheets Export
- API Endpoint
Useful for signup trends, revenue reports, churn alerts, etc.
Real-World Use Cases
Supabase teams across SaaS, marketplaces, internal tools, and B2B platforms often reach a point where analytics becomes critical. Below is an expanded look at the most valuable use cases—showcasing how Draxlr turns raw Supabase data into clear, decision-ready insights.
1. Product Analytics
- Feature usage: Track which features users engage with the most.
- Retention: Measure how often users return over time.
- Cohorts: Compare user groups based on signup date or behavior.
2. Sales Analytics
- Pipeline: Monitor deals across each sales stage.
- Conversions: Analyze drop-offs at every step of your funnel.
- Customer activity: Identify active, inactive, and at-risk accounts.
3. Revenue Analytics
- MRR: View recurring revenue growth over time.
- Churn: Detect when and why customers stop using your product.
- Subscription health: Track trends across plans, upgrades, and renewals.
4. Operational Metrics
- Support data: Measure ticket volume, response time, and resolution quality.
- Error logs: Spot error spikes and frequently failing actions.
- API usage: Understand endpoint activity, latency, and failures.
5. Customer-Facing Dashboards
- Embedded dashboards: Offer your customers real-time insights directly inside your SaaS UI.
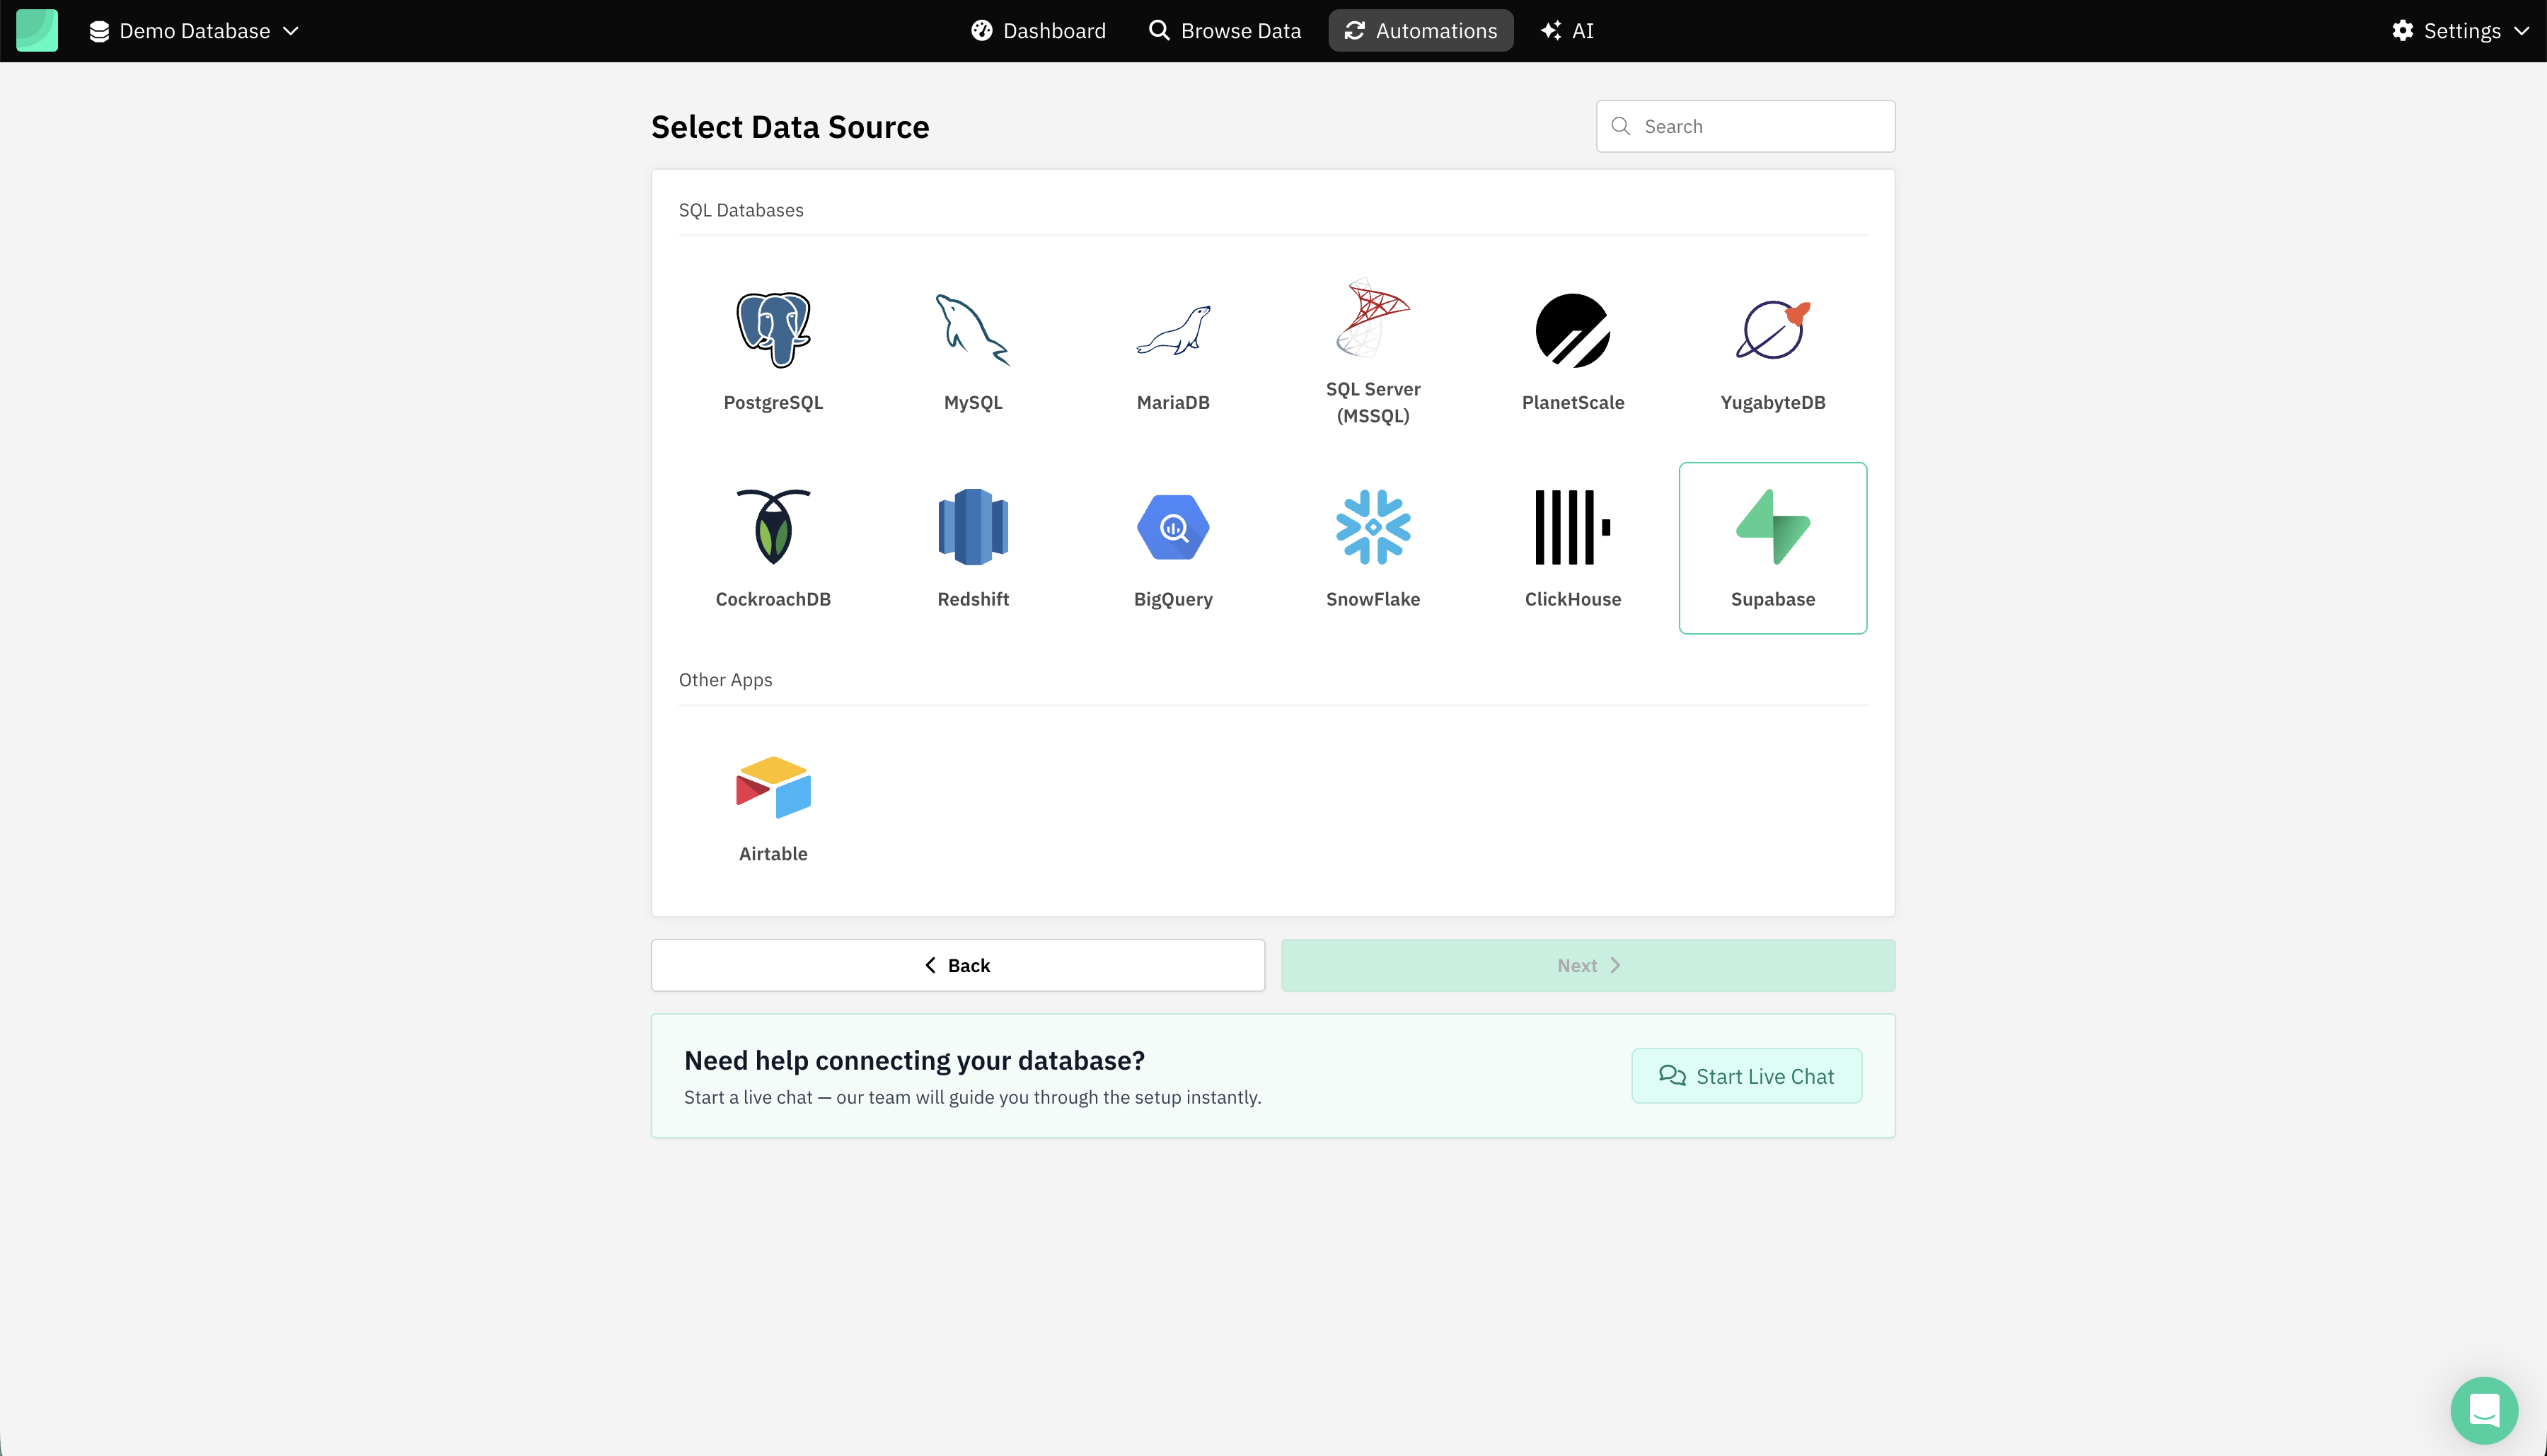
How to Connect Supabase to Draxlr
Step 1: Go to Add Database and select Supabase
Visit: https://app.draxlr.com/add-database
Step 2: Login via Supabase and select Supabase Project
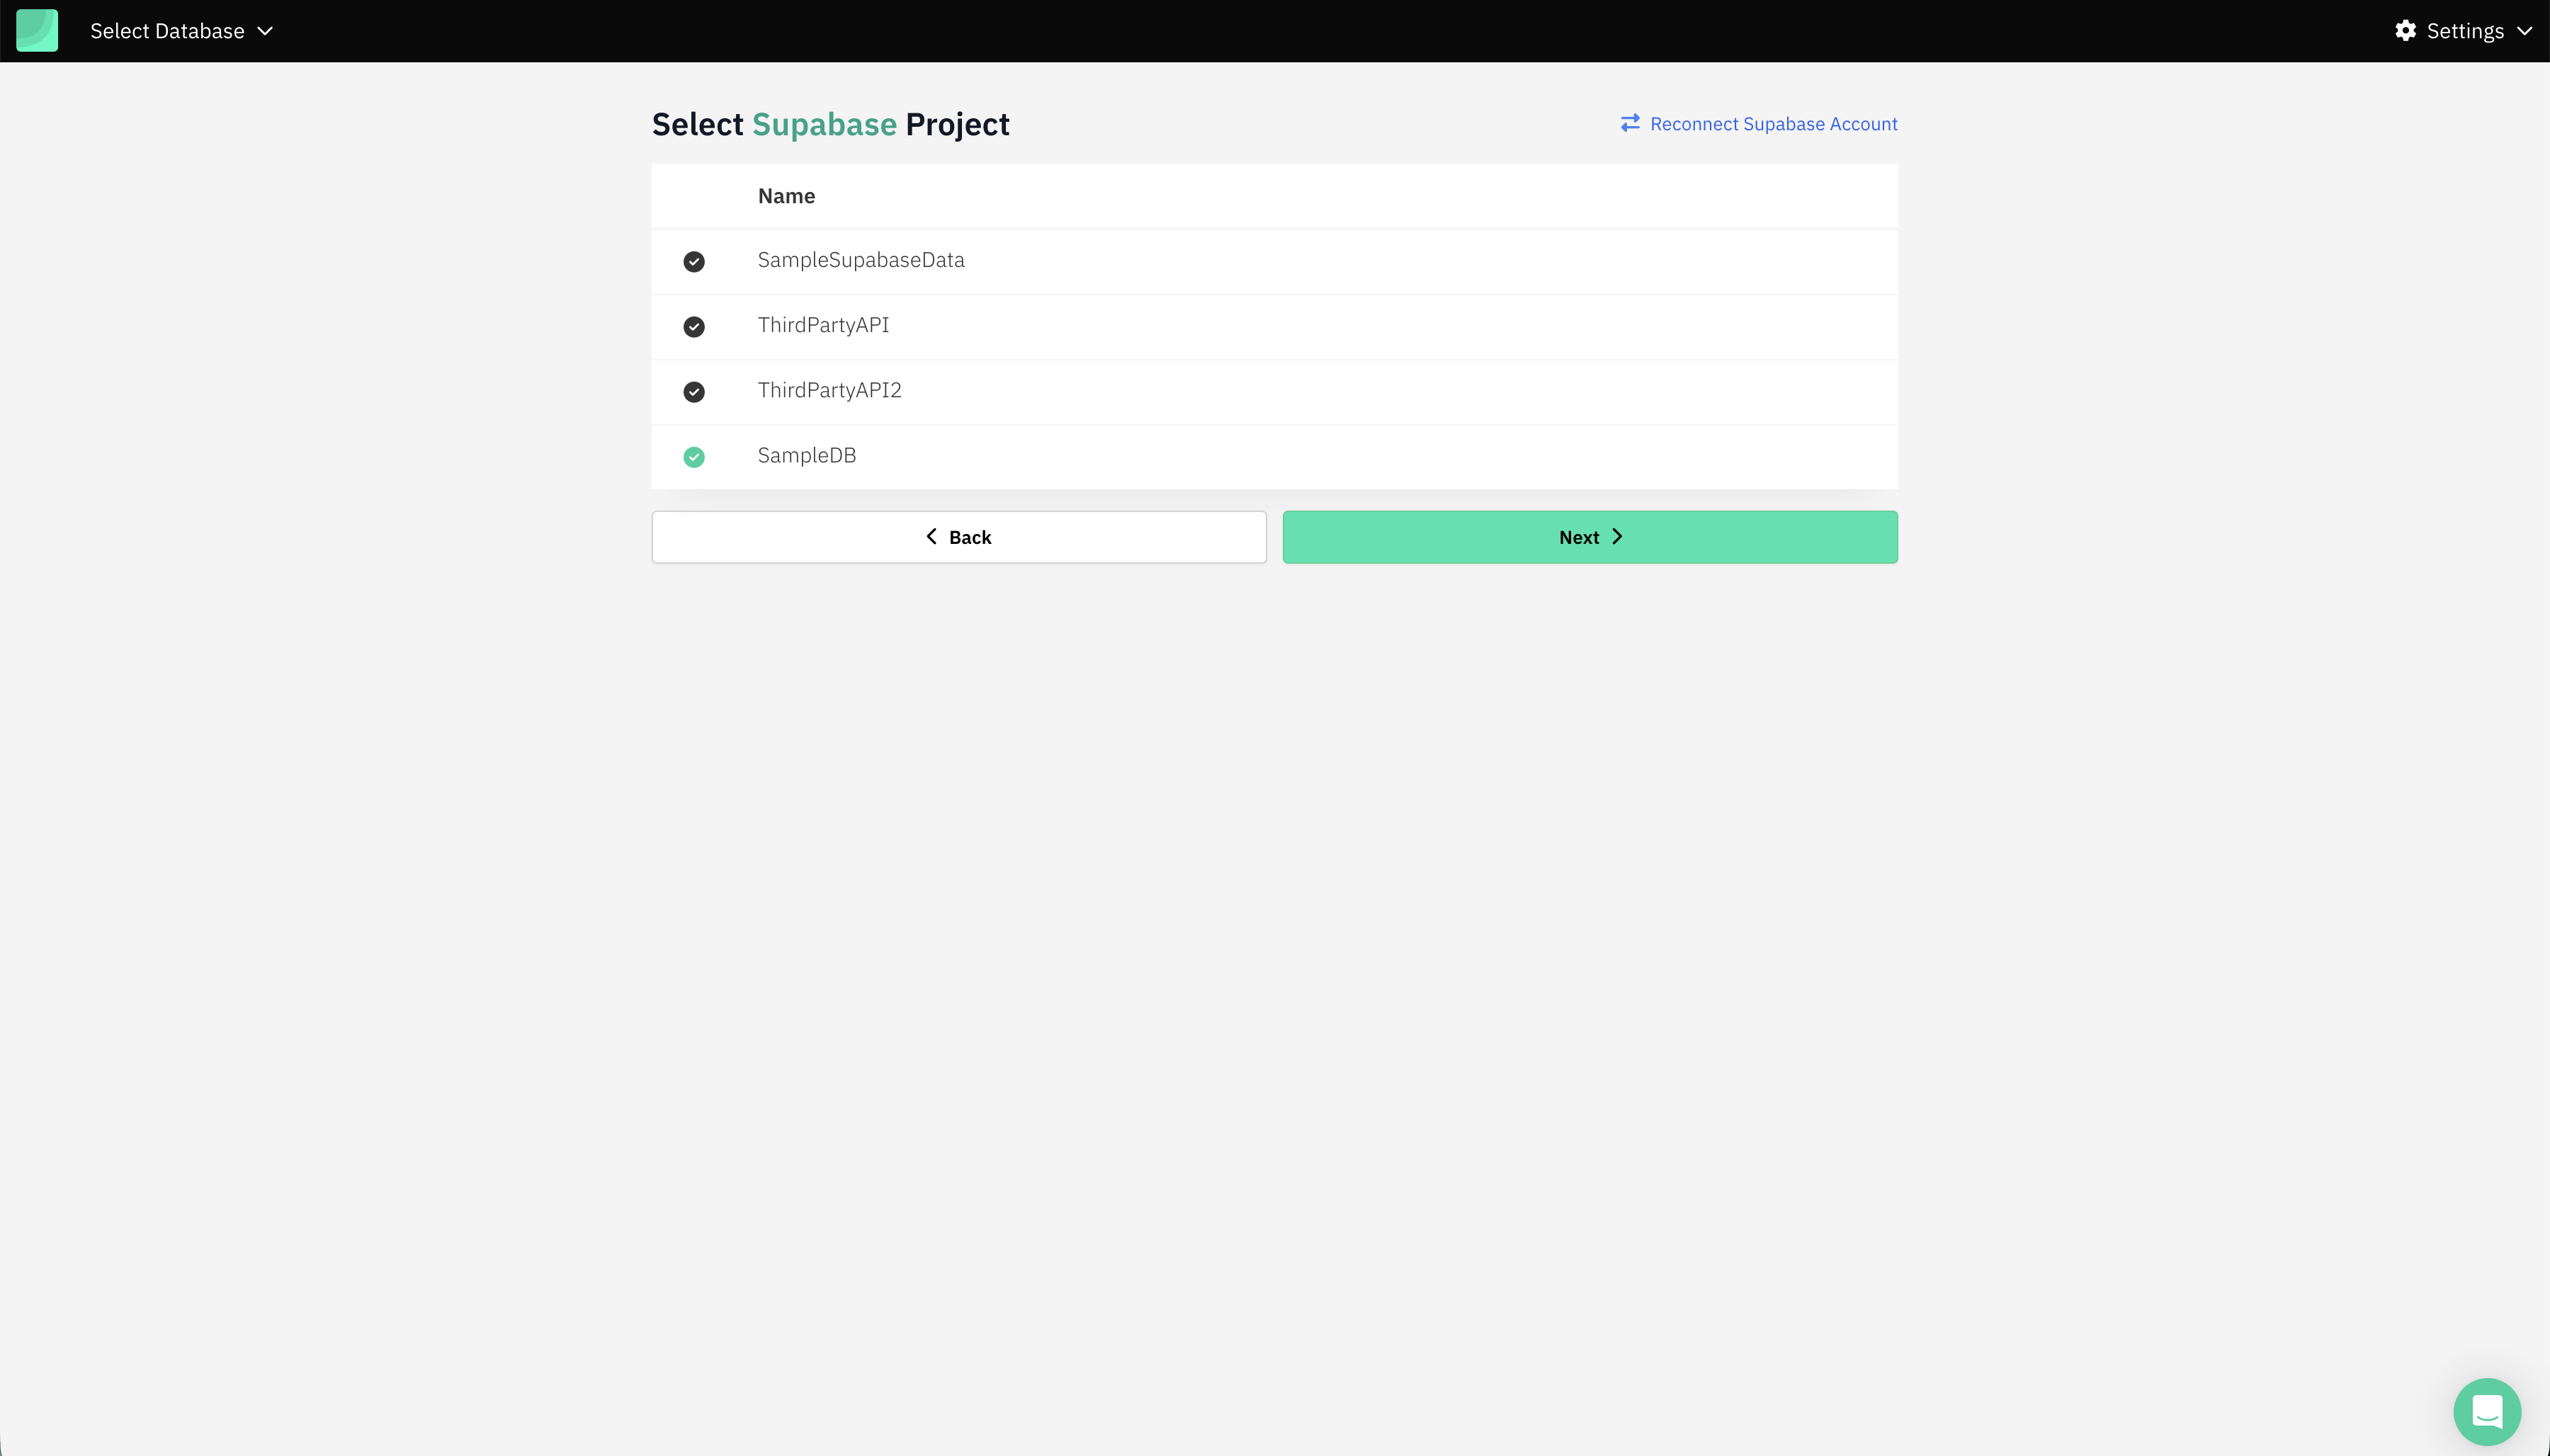
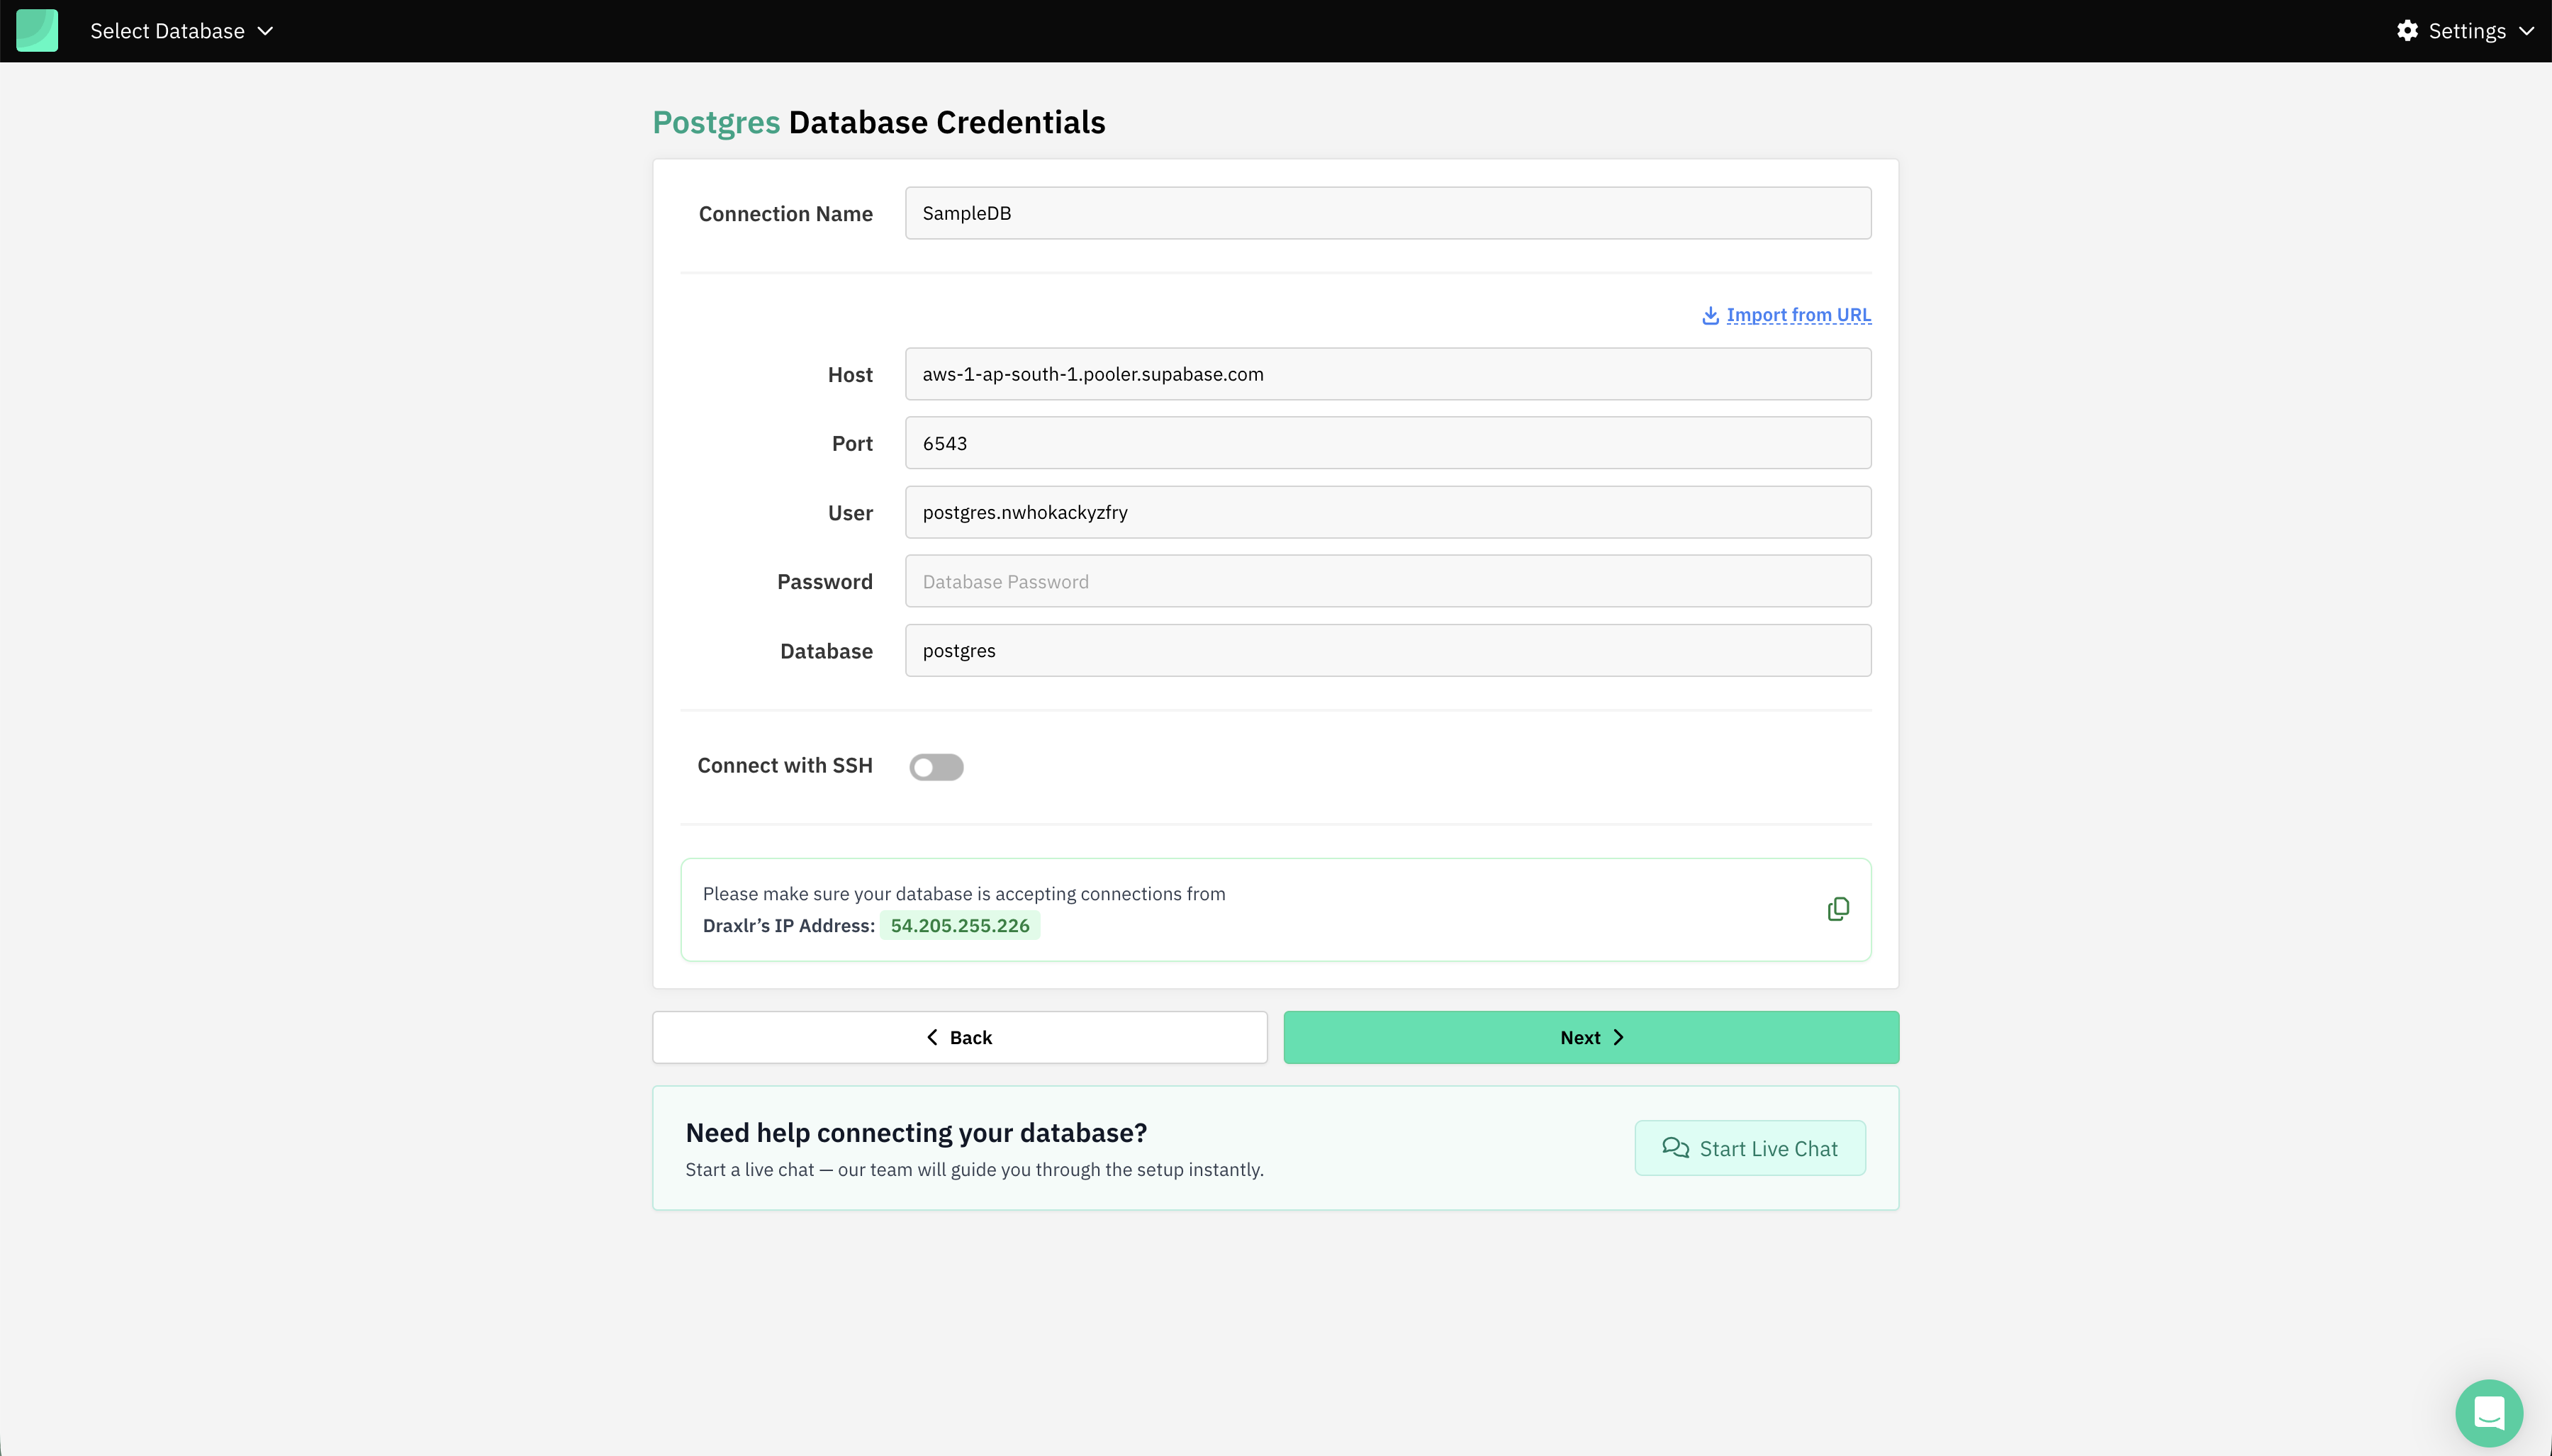
Step 3: Supabase Credentials
Draxlr auto-fetches the Database credentials, except the database password.
Step 4: Select Schema
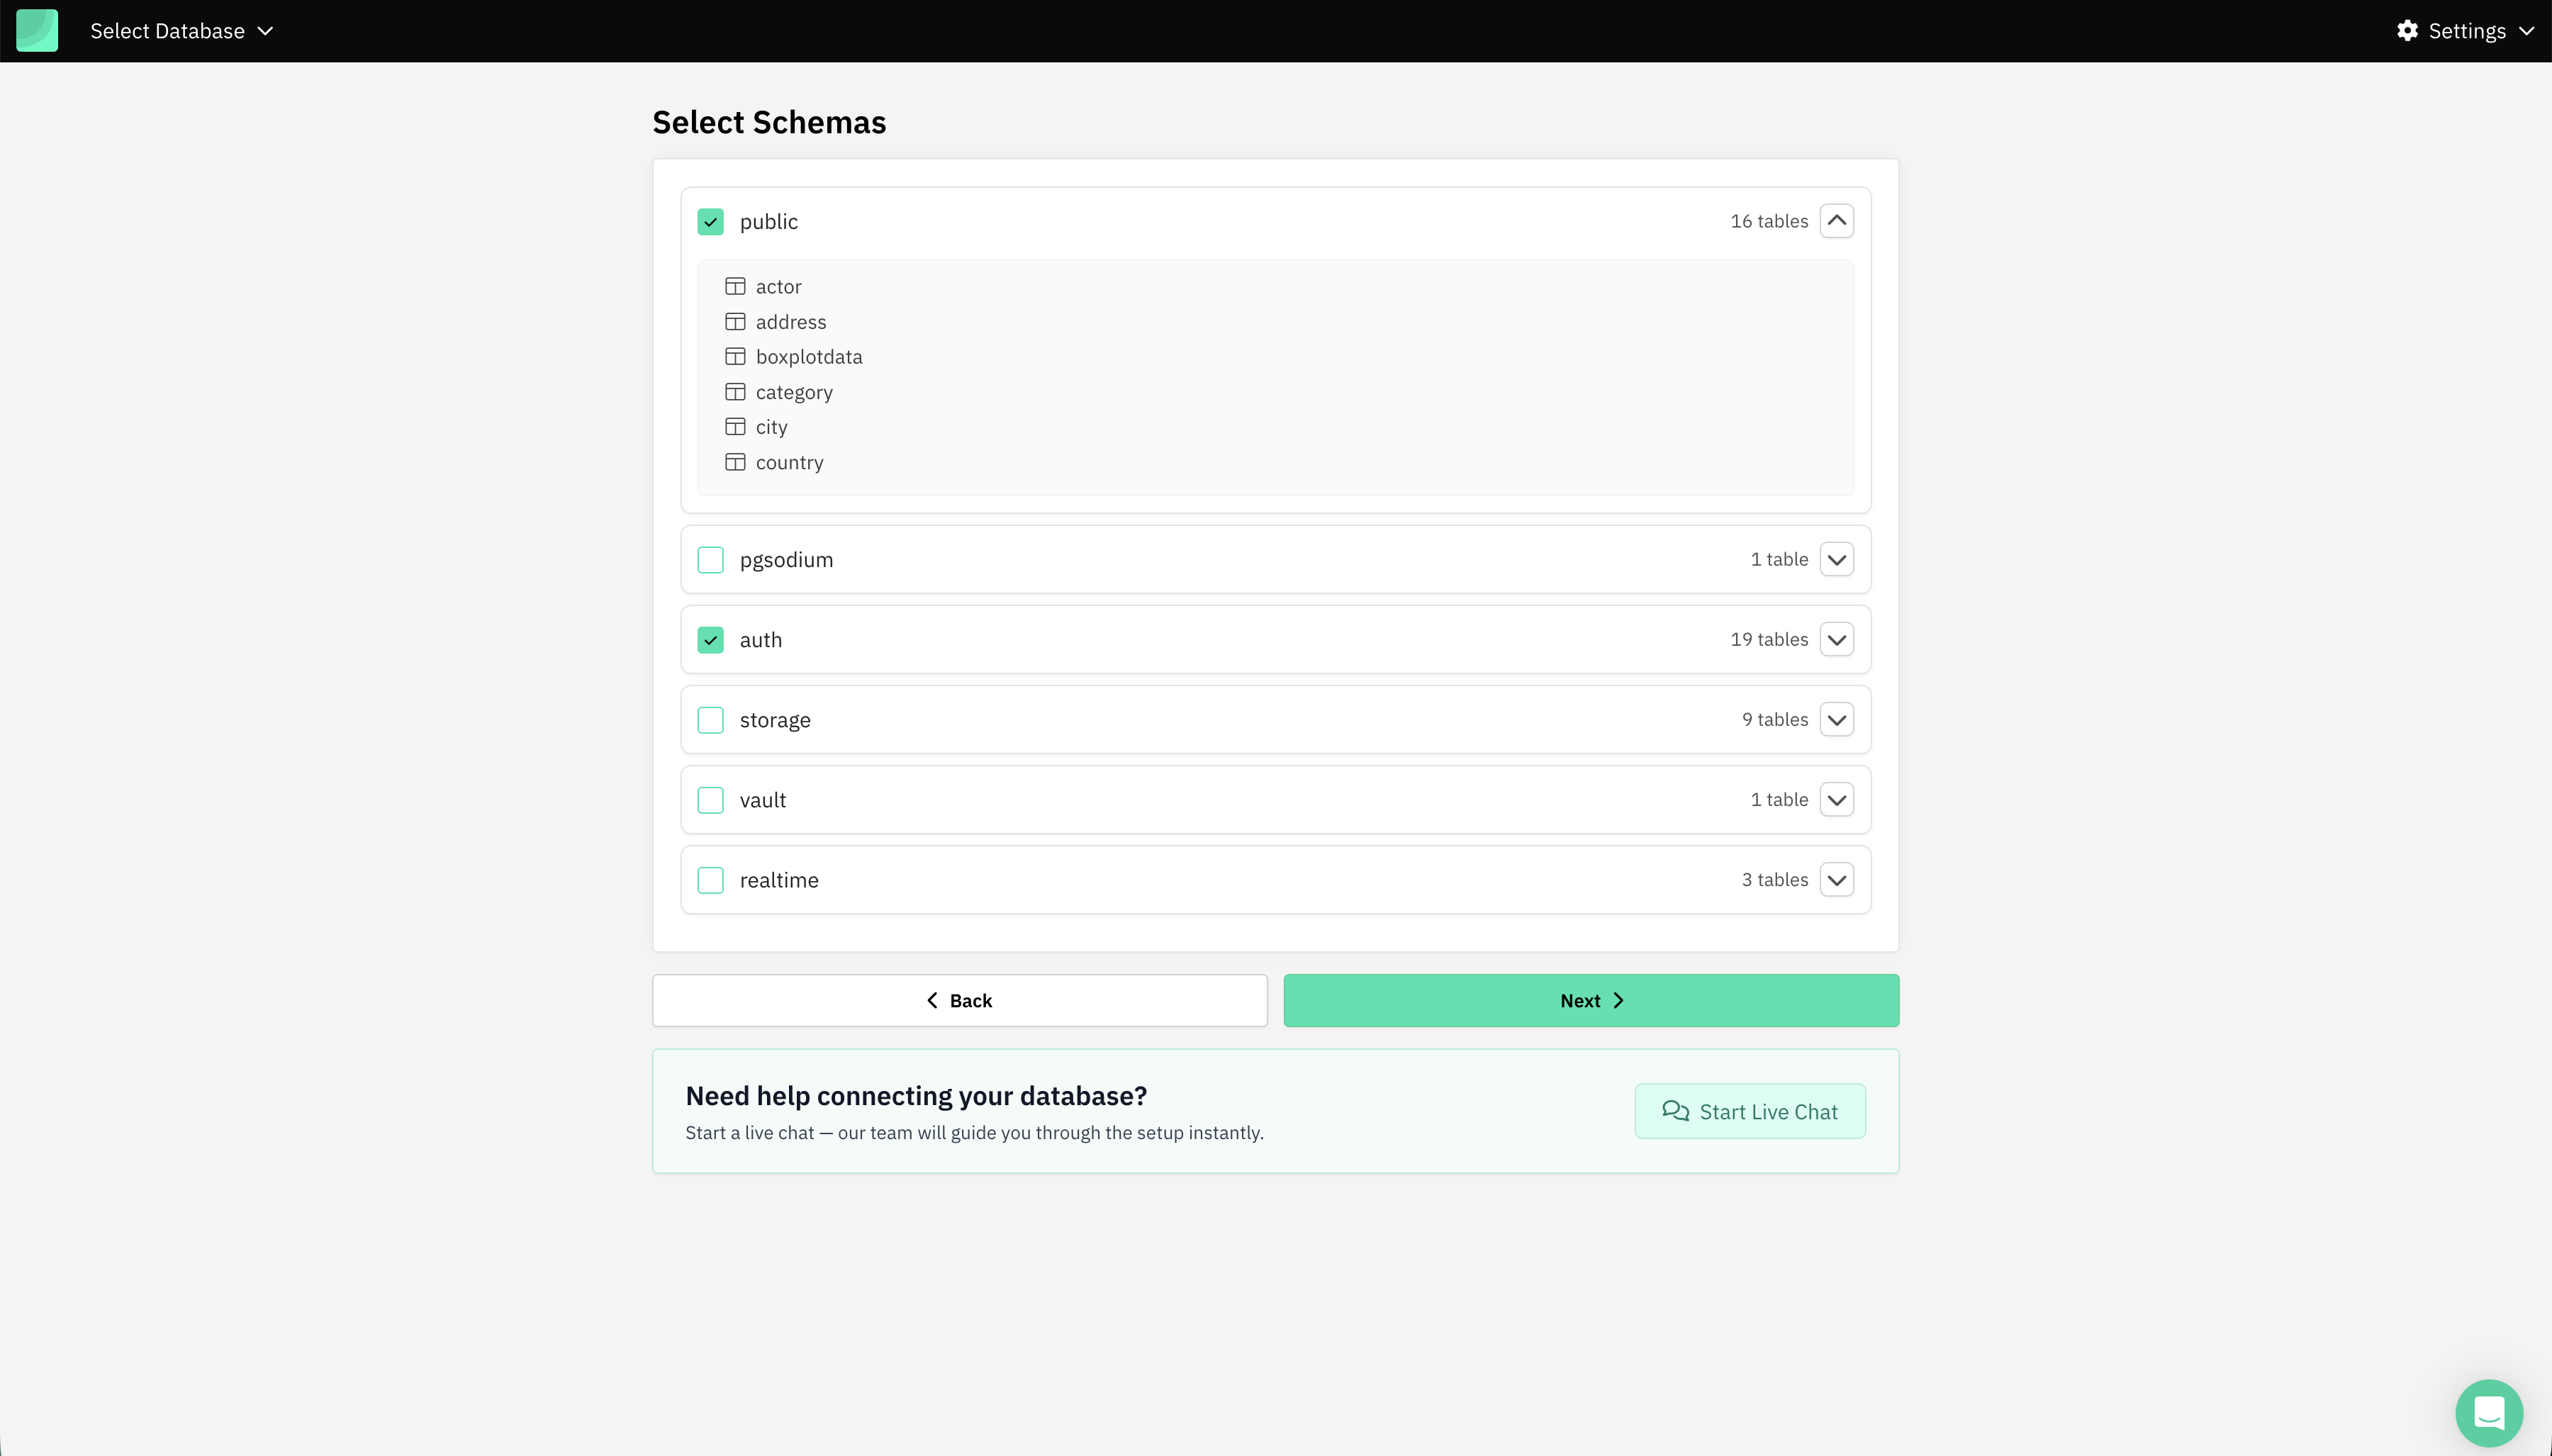
Usually public.
Done.
Pricing, Self-Hosting & Security
Hosted / Cloud
Cloud plan starts at $75 per month which comes with up to 20 users, 2 Databases, and 100 AI Credits.
Self-Hosted
Deploy inside your VPC via Docker. Plan starts at $500 per month, learn more.
Conclusion
Supabase provides a powerful backend, but scaling analytics requires a BI layer built for developers. Draxlr gives teams SQL analytics, AI assistance, dashboards, and embedded reporting—all without the overhead of building your own BI system.
Try Draxlr: https://www.draxlr.com
FAQs
1. What is Supabase Business Intelligence?
Supabase Business Intelligence refers to using analytics tools to visualize, query, and understand your Supabase Postgres data through dashboards, insights, and reporting.
2. Why do Supabase teams need a BI tool like Draxlr?
Because Supabase’s SQL editor is not built for recurring analytics, teams use Draxlr to create dashboards, run AI-generated SQL, share insights, and embed reports without engineering overhead.
3. Does Draxlr connect directly to Supabase without syncing?
Yes. Draxlr runs queries directly on your Supabase Postgres database—no ETL, pipelines, or data copying required.
4. Can I embed Draxlr dashboards inside my Supabase-powered SaaS product?
Absolutely. Draxlr supports React, Vue, and HTML embeds with secure tokens, row-level filters, and full multi-tenant support.