Best Power BI Alternatives in 2026
Looking beyond Power BI? Compare the best Power BI alternatives in 2026 with better pricing, easier setup, and no Microsoft lock-in. Find the right BI tool for your team.
If you're evaluating Power BI alternatives, you're not alone. Power BI is one of the most popular business intelligence tools in the world but popular doesn't always mean the right fit. Many teams run into the same set of frustrations. The desktop first experience creates friction for collaboration, the data modeling layer requires DAX expertise that most business users don't have, and the Pro license can become expensive at scale. Add in Microsoft's cloud dependency and complex licensing tiers, and it's no surprise that plenty of teams start looking for something better.
If you want something simpler, more SQL native, better for embedded analytics, or just less tightly tied to Microsoft's ecosystem, this guide covers the best Power BI alternatives available in 2026.
Why Teams Switch from Power BI
Complex data modeling. Power BI's DAX (Data Analysis Expressions) language is powerful but difficult. This is the most common complaint across G2, Capterra, and Gartner Peer Insights. DAX looks deceptively like Excel formulas, but it's an entirely different beast. Non-technical users can view dashboards, but building anything meaningful requires DAX expertise that most teams don't have in-house.
Performance degrades with large datasets. Across all major review platforms, slow performance with large data volumes is one of the top cited limitations. Users frequently report that reports become sluggish as dataset sizes grow, and optimizing for performance requires additional effort, often pushing teams toward Azure infrastructure investments they hadn't planned for.
Desktop first workflow. Power BI Desktop is where most development happens, which means a Windows only workflow and a file sharing model that slows down collaboration. Reviewers on G2 and Capterra consistently flag this as a practical frustration. Mac users are limited to the web version, which has significantly fewer features than the desktop app. Teams that want to collaborate in real time or iterate together face friction, since reports are typically saved as .pbix files and passed around manually rather than worked on in a shared, browser based environment.
Confusing licensing tiers. Beyond the Free vs Pro split, Power BI has Premium Per User, Premium Per Capacity, and Fabric licensing, each unlocking a different set of features. Users consistently describe the licensing structure as confusing and difficult to budget for, with advanced features like AI Copilot, paginated reports, and higher refresh rates locked behind premium tiers.
Built for Microsoft, awkward outside it. Power BI works best when you're already in the Microsoft ecosystem including Azure, Excel, Teams, and SharePoint. Users note that connecting to non-Microsoft data sources often requires additional connectors or workarounds. Teams not on Microsoft infrastructure frequently feel like they're fighting the tool's design rather than working with it.
Refresh limitations. The free version limits dataset refreshes to 8 times per day, and Pro users are capped at 48 refreshes per day. For teams that need live or near real-time data, this is a serious constraint. Users note that unlocking higher refresh rates or true streaming requires upgrading to Premium or investing in Azure infrastructure. What starts as a straightforward data refresh quickly becomes a licensing decision, and for many teams, an unexpected cost.
Sharing requires paid licenses. Power BI Desktop is free, but the moment you want to share a dashboard with a colleague, everyone needs a Pro license at $14/user/month. Collaboration and sharing, arguably the most basic BI use case, sit behind a paywall. Multiple Capterra reviewers flagged this as a frustrating constraint, especially for smaller teams.
Best Power BI Alternatives in 2026 at a Glance
| Tool | Starting Price | Free Trial | SQL-Native | No-Code Friendly | Embedded Analytics |
|---|---|---|---|---|---|
| Draxlr | $25/month | ✅ 7 days | ✅ | ✅ (AI) | ✅ |
| Tableau | $15/user/month | ✅ | Partial | ✅ | ✅ |
| Looker | $60,000/year | ❌ | ✅ | ❌ | ✅ |
| Sisense | Custom | ✅ | ✅ | Partial | ✅ |
| Domo | Custom | ✅ | Partial | ✅ | ✅ |
| Luzmo | $995/month | ✅ | ✅ | ✅ | ✅ |
| Qlik Sense | $300/month | ✅ | Partial | Partial | ✅ |
1. Draxlr
Best Power BI Alternative for SQL Teams
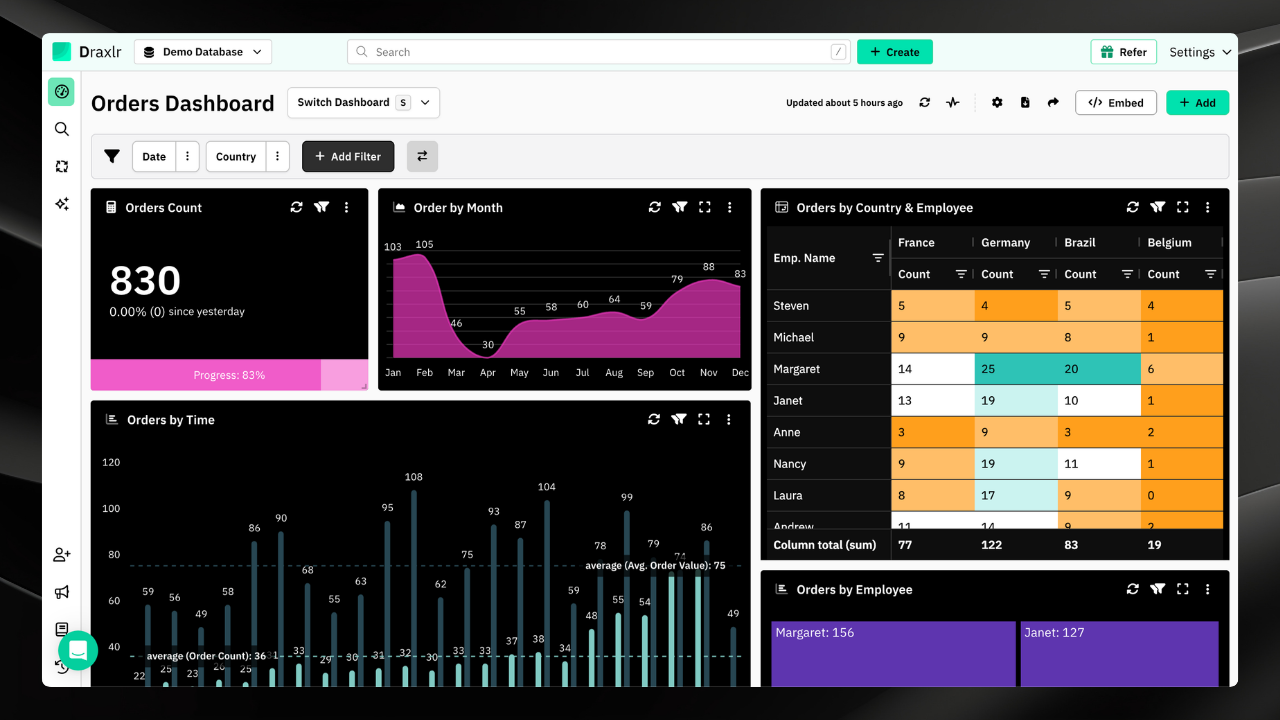
Draxlr is a SQL-native AI-powered BI platform built for teams that want to move fast without depending on engineers for every report. It connects directly to your database including PostgreSQL, MySQL, BigQuery, Snowflake, Redshift, and more and lets users build dashboards using a visual query builder, a direct SQL editor, or an AI-powered Text-to-SQL feature that converts plain English questions into working SQL queries.
Where Power BI requires DAX expertise and a Windows desktop app, Draxlr is entirely browser-based and gives non-technical users real self-service capability. Its AI query assistant handles the complexity that would otherwise require a data engineer.
Key Features:
- AI-powered Text-to-SQL, ask questions in plain English and get charts and dashboards
- Connects to 10+ SQL databases including PostgreSQL, MySQL, BigQuery, Snowflake, Redshift, ClickHouse, Supabase, MariaDB, SQL Server, and more
- Visual query builder with filters, joins, nested grouping, and aggregation
- Rich visualization library with charts, pivot tables, drill-downs, and compute cards
- Embedded analytics with React and Vue SDKs to ship analytics inside your product
- Self-hosted deployment for data privacy and compliance
- White-label BI for agencies and SaaS products
- Automated alerts, scheduled PDF exports, and email summaries
- 7-day free trial, no credit card required
Pricing
- Lite at $25/month covers 1 database and 1 user
- Premium at $75/month covers 2 databases and 10 users
- Power at $125/month covers 5 databases and 30 users
- Enterprise and self-hosted plans available on request
Best for
SaaS companies, data teams, and startups that work with SQL databases and want a modern, AI-powered BI tool with no Microsoft dependency.
Why it beats Power BI
No Windows dependency, no DAX to learn, no Microsoft lock-in. Draxlr is browser-based, works on any stack, and gives non-technical users genuine self-service through AI. For SQL-driven teams, it's simpler, faster, and more cost-predictable.
2. Tableau
Best Power BI Alternative for Data analysts who need the most powerful, expressive visualization layer available.
Tableau has long been the benchmark for data visualization depth. Its drag-and-drop interface lets analysts build sophisticated, interactive charts that are hard to replicate elsewhere. Tableau connects to a wide range of data sources, handles large datasets, and has a rich marketplace of extensions.
The trade-off is cost. Tableau Creator licenses run $75/user/month, which gets expensive for larger teams. And while it's excellent for analytics, it's not ideal for embedding into customer-facing products.
Pricing
Viewer at $15/user/month, Explorer at $42/user/month, Creator at $75/user/month
Best if
Visualization sophistication is your top priority and you have a dedicated analyst team.
3. Looker
Best for Large enterprises needing a rigorous, governed semantic layer shared across the organization.
Looker's LookML semantic layer is its defining feature. It lets data teams define business logic once and have it applied consistently across all reports. It's deeply integrated with BigQuery and the Google Cloud ecosystem. The downside is significant though, as pricing starts at $60,000/year, there's no free trial, and LookML requires developer resources.
Pricing
Starts at $60,000/year
Best if
You're a large enterprise on Google Cloud with dedicated data engineering resources.
4. Sisense
Best for SaaS companies building analytics into their product for customers.
Sisense specializes in embedded analytics and is designed to handle complex, multi-source datasets efficiently. Its in-chip technology compresses large data volumes for fast queries, and its JavaScript SDK makes embedding flexible. Like Looker, it's enterprise-priced and has a steeper learning curve.
Pricing
Custom pricing at enterprise tier
Best if
You're a SaaS company needing a battle-tested embedded analytics platform and have enterprise budget.
5. Domo
Best for Business-heavy teams that want polished dashboards and strong collaboration without IT dependency.
Domo is designed for business users first. It has strong data storytelling features, an app store of pre-built connectors, and features like Domo Everywhere for embedding. It's more accessible than Power BI for non-technical users, but pricing is enterprise-level and not transparent and you'll need to go through sales.
Pricing
Custom pricing, reported starting around $300/user/year
Best if
Business teams want to self-serve without IT and your organization is willing to pay premium for polish.
6. Luzmo
Best for SaaS companies that need to embed interactive analytics natively inside their product for end users.
Luzmo is purpose-built for embedded analytics in SaaS products. Unlike general-purpose BI tools that added embedding as a feature, Luzmo is designed from the ground up to deliver analytics that live inside your product — with full white-labeling, multi-tenancy, and row-level security built in by default.
Pricing:
Starts at $995/month (Basic — 100 monthly active viewers); Pro at $2,050/month; Elite at $3,100/month. Free trial available.
Best if
You're a SaaS company that needs analytics embedded natively inside your product, with white-labeling and multi-tenancy as core requirements.
7. Qlik Sense
Best for Enterprise teams that need to explore complex relationships across large, siloed datasets.
Qlik's associative engine lets analysts freely navigate data relationships without predefined hierarchies. It highlights what's related as you filter, which is genuinely powerful for discovery analytics. The downside is complexity and cost since Qlik is an enterprise platform with enterprise pricing.
Pricing
Business plan starts around $300/month and Enterprise requires a custom quote
Best if
You're in a large enterprise environment with complex, multi-source data needs and dedicated BI resources.
Power BI Migration Checklist: How to Switch to a Power BI Alternative
Choosing a Power BI alternative is only half the work. Migrating cleanly without disrupting your team is the other half. This checklist walks you through every step, whether you're moving to Draxlr, Tableau, Looker, or any other Power BI alternative on this list.
Step 1. Audit Everything You Have in Power BI
Before evaluating any Power BI alternative, document your current setup so nothing gets lost in the move.
- List every active dashboard and report, and flag ones that haven't been opened in 90+ days as candidates for retirement
- Map all data sources including SQL databases, Excel files, Azure connectors, and third-party APIs
- Identify reports that rely heavily on complex DAX measures, as these will need the most attention when rebuilding in a new tool
- Document who uses what, how often, and for which business decisions
Step 2. Build Your Requirements List
What frustrated you about Power BI becomes your requirements list for the Power BI alternative. Use your audit to define what the new BI tool must do better.
- Do business users need to build their own reports, or just view dashboards?
- Does your Power BI alternative need to support embedded analytics inside a product or client portal?
- Is self-hosting, on-premises deployment, or data residency a compliance requirement?
- Which databases and data warehouses need native connectors?
- Do you need automated alerts, scheduled PDF reports, or email summaries?
Step 3. Trial Your Shortlisted Power BI Alternatives
Don't commit without testing. Pick 2 to 3 Power BI alternatives and run a structured trial using real data.
- Connect your primary data source in each tool during the trial
- Rebuild one of your most-used Power BI dashboards from scratch, as this is the most honest performance test
- Have both a technical and a non-technical user test the experience independently
- Score each Power BI alternative on setup time, query performance, learning curve, and support responsiveness
Step 4. Migrate Your Data Sources
Once you've selected your Power BI alternative, data connections come first.
- Connect all SQL databases, cloud data warehouses, and flat file sources to the new platform
- Run parallel queries in both tools and validate that results match before decommissioning anything
- Recreate calculated fields, custom KPIs, and business metrics that were defined in DAX, using your new tool's SQL editor, visual query builder, or formula layer
- Confirm that refresh schedules are working and data is updating at the expected frequency
Step 5. Rebuild Your Most-Used Dashboards First
Migrate by priority rather than by volume. The goal is to get your team working in the new Power BI alternative as quickly as possible.
- Identify the 20% of dashboards that 80% of your team actually opens and start there
- Use this as a chance to consolidate, since many teams discover during migration that they have redundant reports that can be merged or retired
- Share rebuilt dashboards with stakeholders for sign-off before turning off the Power BI versions
- If your new tool has an AI query assistant like Draxlr's Text-to-SQL, use it to rebuild reports faster by writing queries in plain English instead of recreating DAX logic manually
- Some tools like Draxlr also offer professional services where their team builds your dashboards for you as a one-time fee project, which can significantly reduce migration time if you'd rather not rebuild everything in-house
Step 6. Onboard Your Team
A Power BI alternative only delivers value if your team adopts it. Adoption doesn't happen automatically.
- Run a short onboarding session covering the core workflows including connecting data, building queries, creating dashboards, and sharing reports
- Identify 1 to 2 internal champions per team who can answer questions and encourage usage
- Create a short internal reference doc with your most common dashboards, shared queries, and data source connections
- Set a clear cutover date, which is the day the team stops using Power BI and works exclusively in the new tool
Step 7. Cancel Power BI Licenses and Clean Up
Once the migration is complete and the team is fully operational in the new Power BI alternative, wrap up the Power BI side.
- Cancel Pro and Premium licenses for users who have fully transitioned, as this is often an immediate and significant cost saving
- Archive Power BI report files for reference rather than deleting immediately
- Remove Power BI Desktop from company devices if it's no longer needed
- Document the new BI stack in your internal wiki for future team onboarding
Conclusion
Power BI is a capable tool that works well for organizations deeply invested in the Microsoft ecosystem. But it's not the right fit for every team, especially those that want browser first collaboration, SQL native workflows, or a tool that doesn't require DAX expertise.
Draxlr is the most compelling Power BI alternative for SQL-driven teams. It's fast to set up, genuinely accessible for non-technical users, and covers the full range from internal dashboards to customer-facing embedded analytics without Microsoft dependency or complex licensing. Start a free 7-day trial at draxlr.com.
FAQs
1. What is the best Power BI alternative?
The best Power BI alternative depends on your team's needs. SQL-native teams benefit most from tools that offer direct database connectivity and AI-assisted querying. Microsoft-heavy organizations may find alternatives that integrate with existing infrastructure more practical. The easiest way to find the right fit is to trial a shortlist using real data before committing.
2. Is Tableau better than Power BI?
Tableau has a superior visualization layer and is generally better for deep, explorative analytics. Power BI wins on Microsoft ecosystem integration and per-seat cost at lower team sizes. For teams not on Microsoft infrastructure, Tableau is generally the stronger choice, though SQL-native tools are worth evaluating if your team works directly with databases.
3. What is the cheapest Power BI alternative?
Open source tools that can be self-hosted are the most affordable at zero licensing cost, though they require engineering capacity to maintain. Commercial alternatives with AI features and managed hosting start as low as $25 to $30 per month with flat pricing that covers multiple users, making the per-user cost competitive even for small teams.
4. Can I export dashboards from Power BI to another tool?
Not natively. BI tools don't have cross-platform dashboard export. However, since most tools connect to the same underlying databases, migration typically involves reconnecting your data source and rebuilding key reports rather than converting files. Visual query builders and AI query assistants in modern BI tools can significantly speed up the rebuild process.
5. Is there a Power BI alternative that works on Mac?
Yes. Most modern Power BI alternatives are fully browser-based and run natively on any operating system including Mac, Linux, or Windows, with no virtualization or workarounds required.
6. What is the cheapest Power BI alternative for a small team?
Several alternatives offer flat monthly pricing that covers multiple users under a single fee, making the effective per-user cost significantly lower than Power BI Pro at $14 per user per month. Some tools also offer free trials so you can validate the fit before committing to any spend.
7. Can non-technical users actually use Power BI alternatives?
Most modern BI alternatives are specifically built to remove the technical barrier that Power BI's DAX language creates. Features like natural language querying, drag-and-drop dashboard builders, and AI-assisted report creation allow business users to build and explore dashboards independently without writing formulas, modeling data, or relying on a data engineer for every report request.
8. How hard is it to switch from Power BI to another tool?
For most teams, the migration itself is straightforward. Since BI tools connect directly to your underlying databases, switching primarily involves reconnecting data sources and rebuilding dashboards rather than converting or exporting proprietary files. The main effort is translating DAX-based calculated fields into your new tool's query layer. A small team with a handful of dashboards can typically complete a migration in one to two weeks.
9. Is Power BI good for embedded analytics?
This is widely considered one of Power BI's weakest areas. Embedding dashboards into a SaaS product or client-facing portal requires Azure capacity licensing that is complex to configure and difficult to price predictably. Teams building embedded analytics into their own products typically find purpose-built alternatives significantly easier to implement, more flexible to brand, and more cost-predictable at scale.

