How to build dashboards from Neon database
Learn how to connect your Neon Postgres database to Draxlr and create dashboards, run SQL queries, and visualize your data with ease.

Neon database has quickly become a favorite among developers who want a modern, scalable, serverless Postgres database without the overhead of managing infrastructure. With features like branching, autoscaling, and storage optimization, Neon offers a frictionless way to run Postgres in the cloud.
But once your application is storing data in Neon, the next logical step is turning that data into insights - and that’s where Draxlr comes in. Draxlr allows you to visualize your Neon Postgres data, build dashboards, monitor key metrics, and share insights with your team - all without maintaining your own analytics stack. Whether your team is technical or not, Draxlr turns your Neon into a powerful decision-making engine.
In this guide, we’ll walk you through how to connect your Neon database to Draxlr and start building dashboards in minutes.
Why Use Draxlr with Neon database?
Neon database provides a cloud-native Postgres experience that’s built for development speed and reliability. Pairing it with Draxlr gives you:
-
Zero-config analytics on serverless Postgres: Draxlr connects directly to your Neon Postgres instance - no middleware, no pipelines. Start exploring your data instantly.
-
No-code & SQL-friendly workflow: Non-technical users can explore data visually using Draxlr’s query builder. Developers can write custom SQL for complex analytics.
-
Dashboards that auto-update: Every dashboard refreshes automatically based on live data.
-
Alerts & monitoring: Set up Slack or email alerts to stay informed about metric changes, anomalies, or scheduled reports.
Step-by-Step Guide to Integration
Retrieve your Neon Connection Details
- Go to Neon dashboard and select the project you want to connect to Draxlr.
- On the right side, click on the Connect button to view your database connection details.
- Choose Connection string method from the list and copy the connection string. It will look something like this:
postgresql://<user>:<password>@<your-db-server>.aws.neon.tech/neondb?sslmode=require&channel_binding=require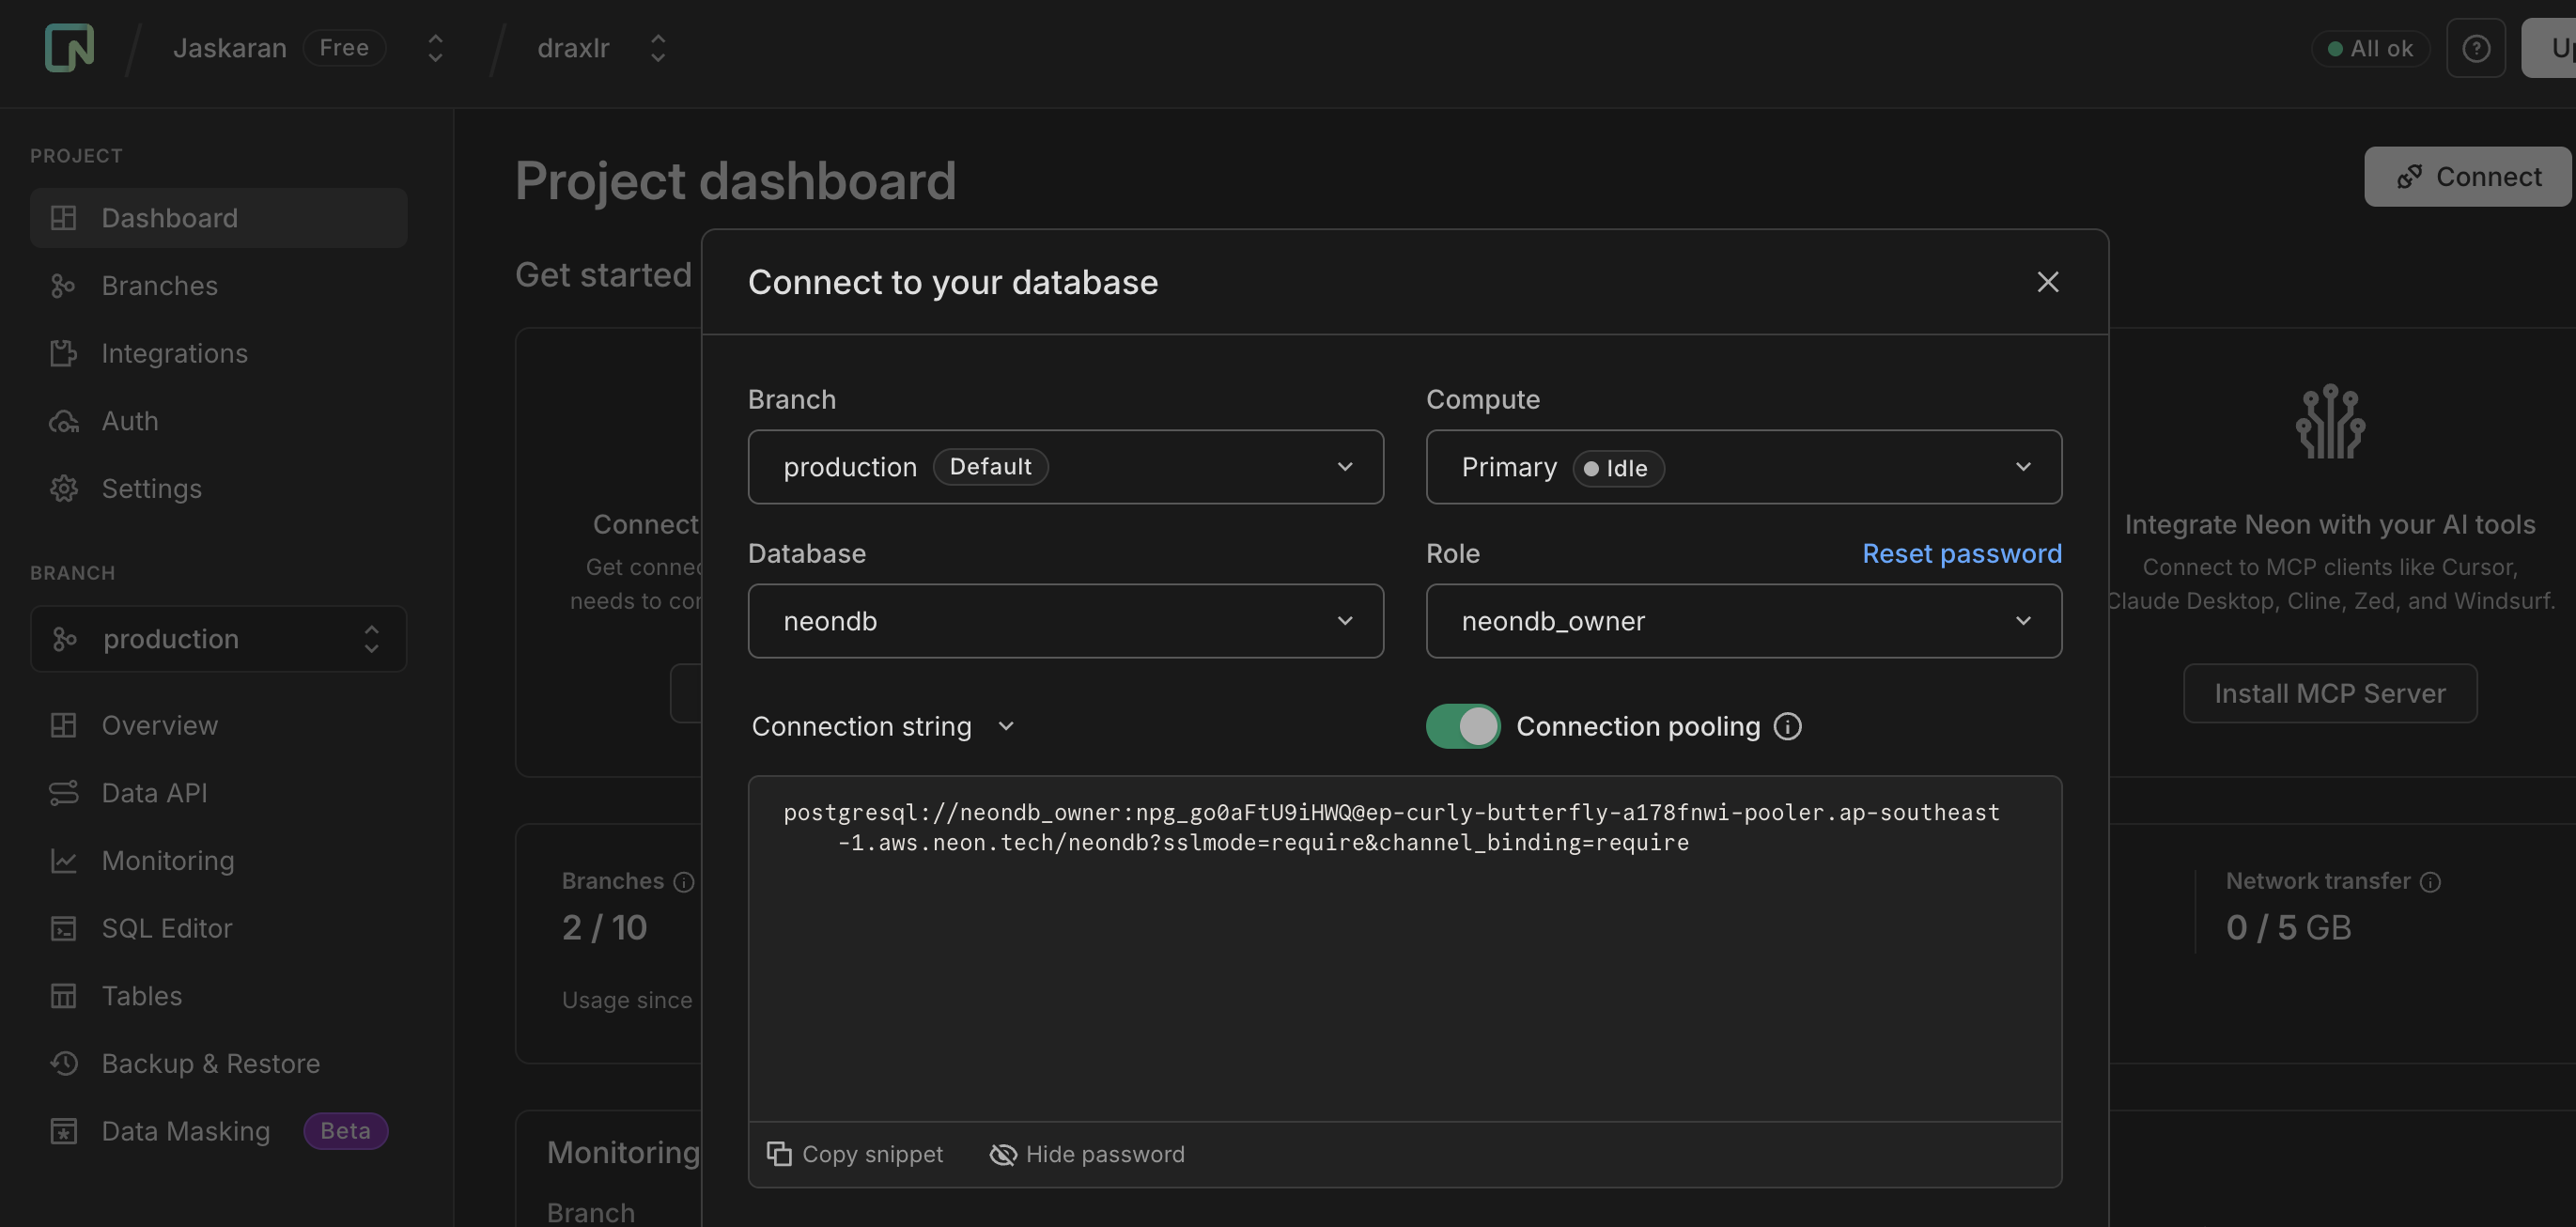
Connecting to Draxlr
Once you have your Neon credentials ready, you can proceed to configure Draxlr:
- If you’re new to Draxlr, sign up for an account, or log in if you already have one.
- New users will land directly on the database connection page. If you already have an account, open the navbar and choose Select database > + Connect a Database. Pick
Neonas your database type and continue. - Enter your Neon database information (host, port, username, password, and database name) into the connection form, then click Next.
- Choose the schemas you want to connect. If you only have one schema, it will be selected automatically. Click Next to proceed.
Exploring your data
You can build queries and use them to create Neon dashboards and set up alerts. There are 3 ways to create a query in Draxlr:
- Query Builder: A no-code feature for generating queries.
- Raw SQL: Write and execute custom SQL queries.
- AI-powered SQL Generation: You can use Draxlr's AI assistant to generate SQL queries based on natural language prompts.
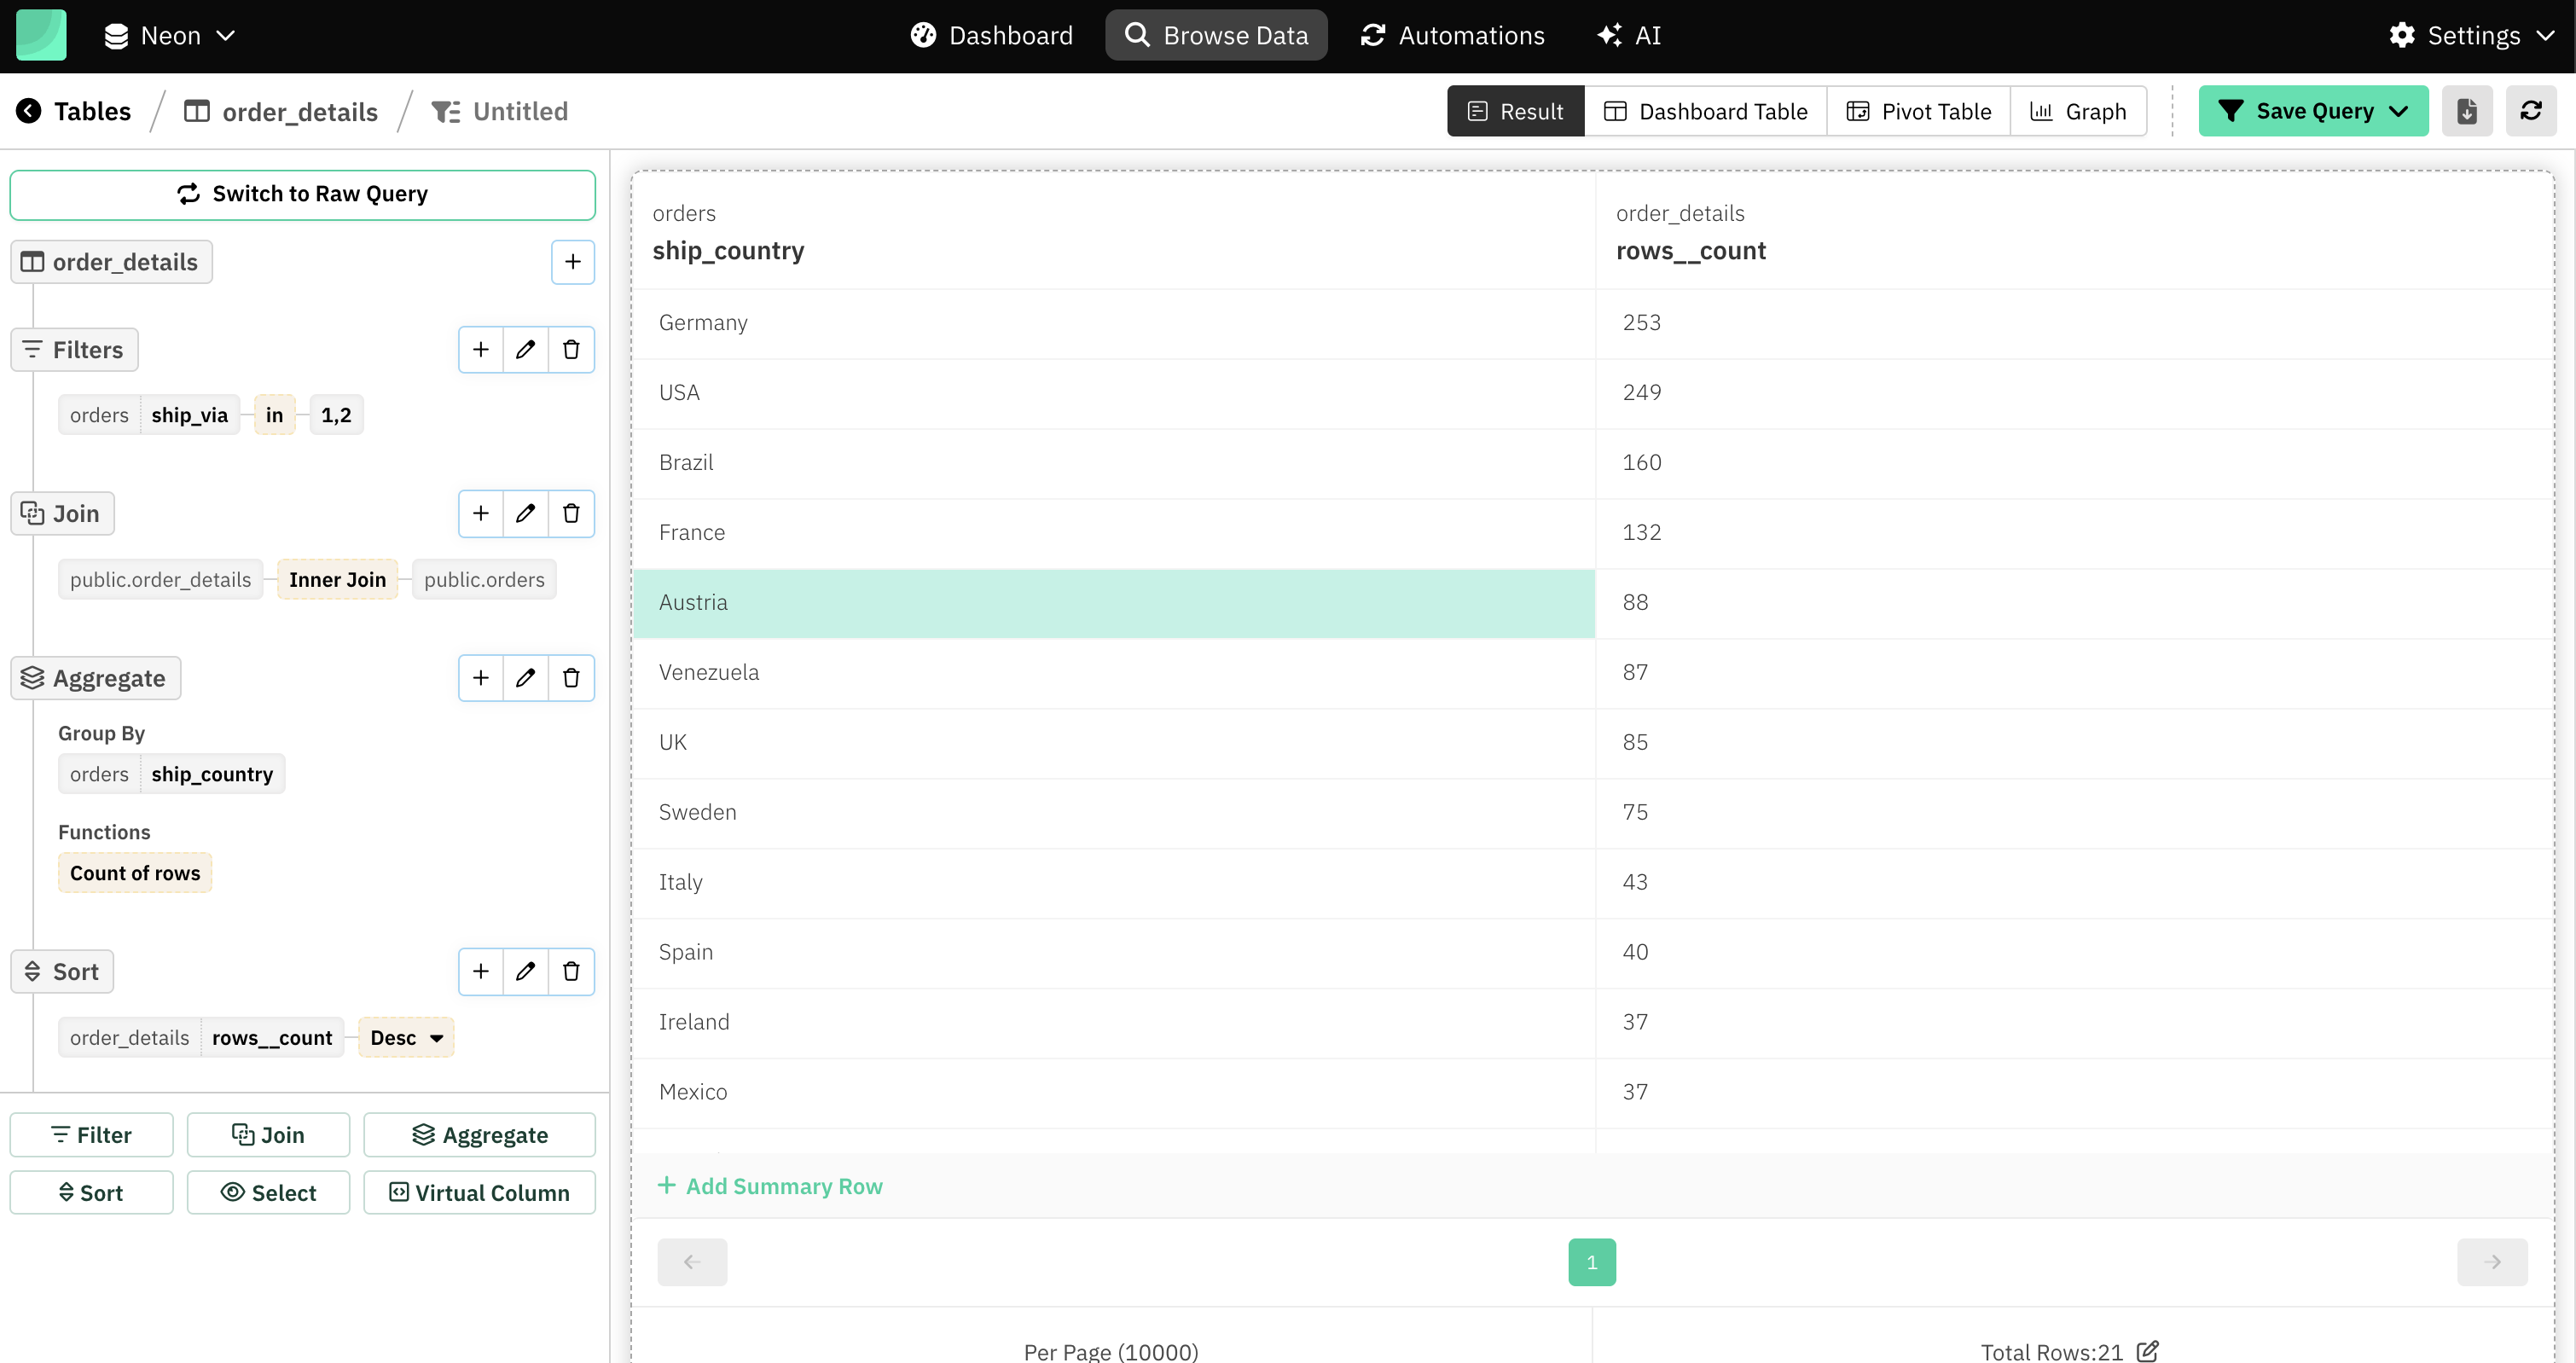
Create query using Query Builder
- Go to the Browse Data option from the navbar.
- Click a table from the left-side panel.
- This will open the Query Builder interface for that table.
-
Use Filter, Join, Aggregate, Sort, Select (columns), and Virtual Column to shape your data and reach your desired result.
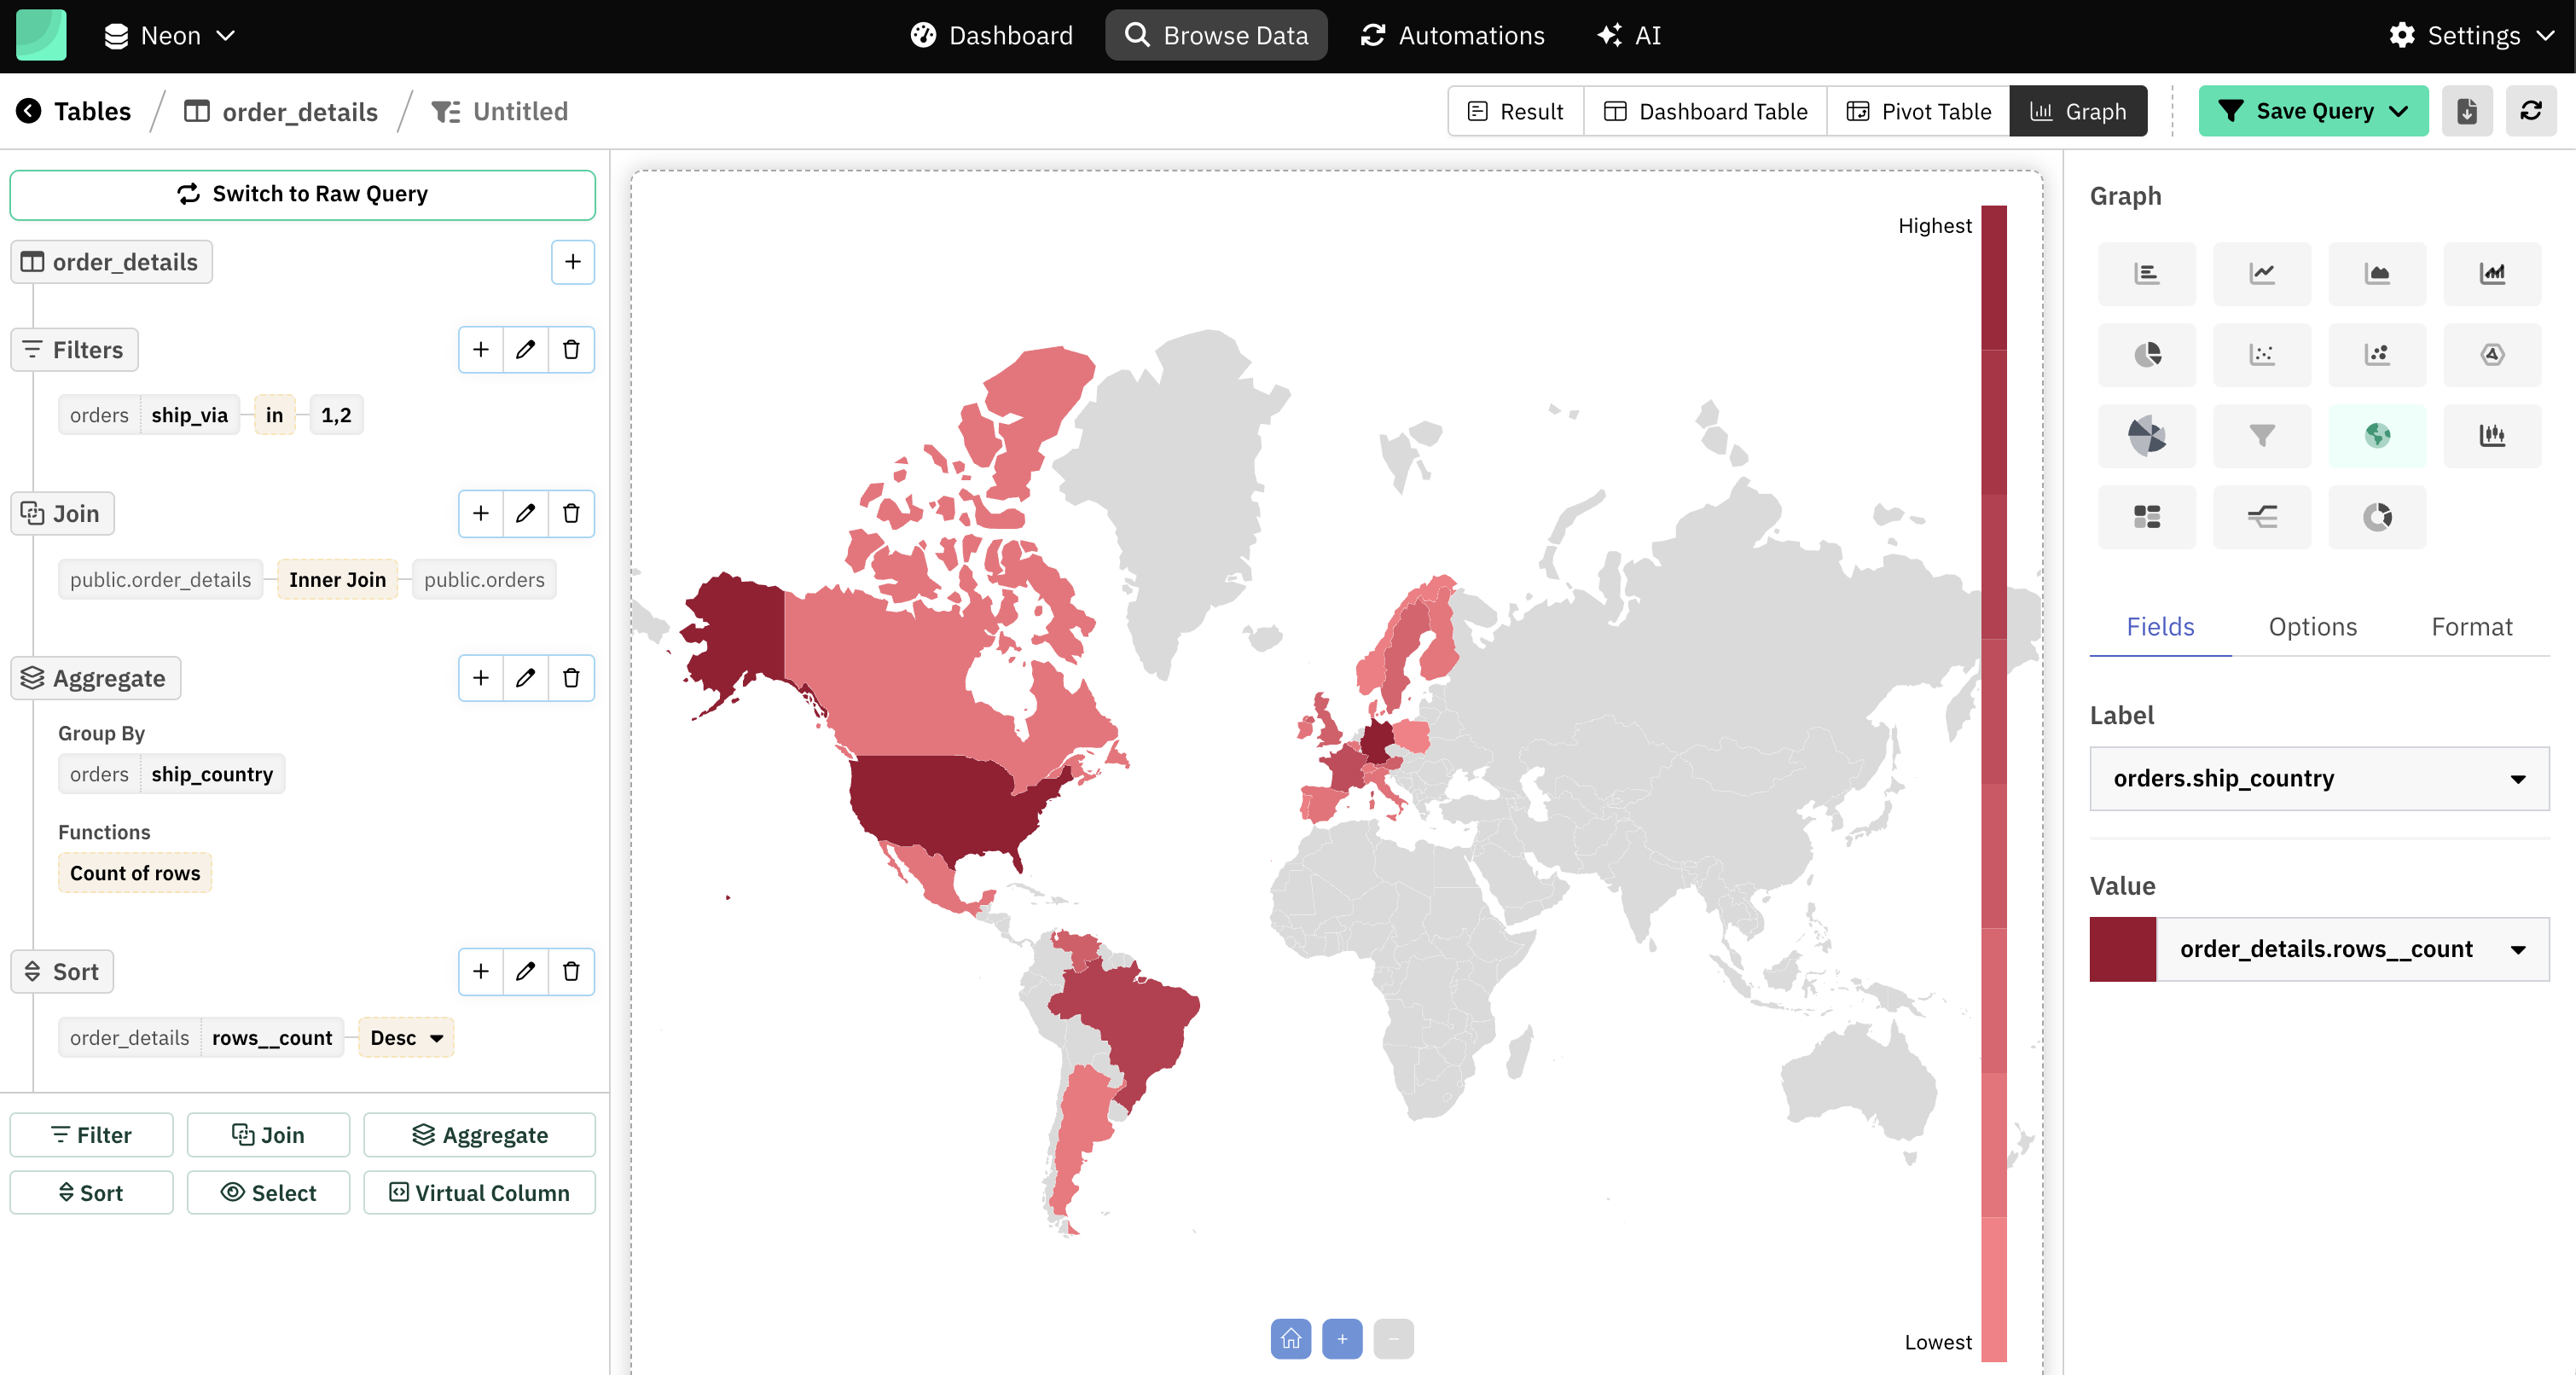
Data Visualisation and Dashboard
Turn your raw Neon data into meaningful visuals with Draxlr’s dashboarding features.
- After running a query, whether through the no-code builder or SQL editor, click the Graph button to begin visualising your data. Draxlr supports multiple visualisation types including bar charts, line charts, pie charts, number cards, and more.
- Once you finalise your visualisation, click Save query. Then, use Add to Dashboard to place your visualisation onto a custom dashboard.
Dashboards can be shared with your team or embedded into internal and customer-facing tools
Monitoring Your Data
Draxlr makes it easy to stay updated on important changes in your data by allowing you to set up automated alerts. Once you've created and saved a query, you can enable monitoring directly from the query panel.
You can configure:
- Slack Alerts: Get instant notifications in your Slack workspace whenever your data crosses a threshold or changes.
- Email Alerts: Receive timely updates in your inbox based on schedule or data conditions.
These alerts help your team react quickly to trends, anomalies, or critical shifts - without needing to manually check dashboards.
Conclusion
Connecting Neon database to Draxlr unlocks a powerful workflow for teams who rely on Postgres and want fast, scalable analytics. With just a few steps, you can bring your Neon data into Draxlr, explore it visually, and build dashboards that empower your entire organisation to make data-driven decisions.
Embrace the combined power of Neon database and Draxlr to transform your raw data into actionable insights.
Connect your Neon Database- Jaskaran Singh

