How to build Dashboards from Moodle data
Learn how to build Moodle dashboard using Draxlr. Visualize course data, student engagement, enrolment trends, and set up alerts in minutes using your Moodle database.

Moodle is one of the most popular Learning Management Systems (LMS) used by educational institutions worldwide. It generates a vast amount of valuable data, such as course interactions, student engagement metrics, quiz results, and more. But how can you leverage this data to gain actionable insights? With Draxlr, you can create a custom Moodle dashboard to track various metrics. This article guides you through the process of building interactive dashboards directly from your Moodle database.
Using Draxlr to Build Dashboards from Moodle Data
Draxlr is a no-code business intelligence solution that allows you to create dashboards, receive data alerts, and embed dashboards on customer-facing websites using Visual query builder and powerful AI query builder.
Ok, let's go!
Connecting Moodle Database with Draxlr
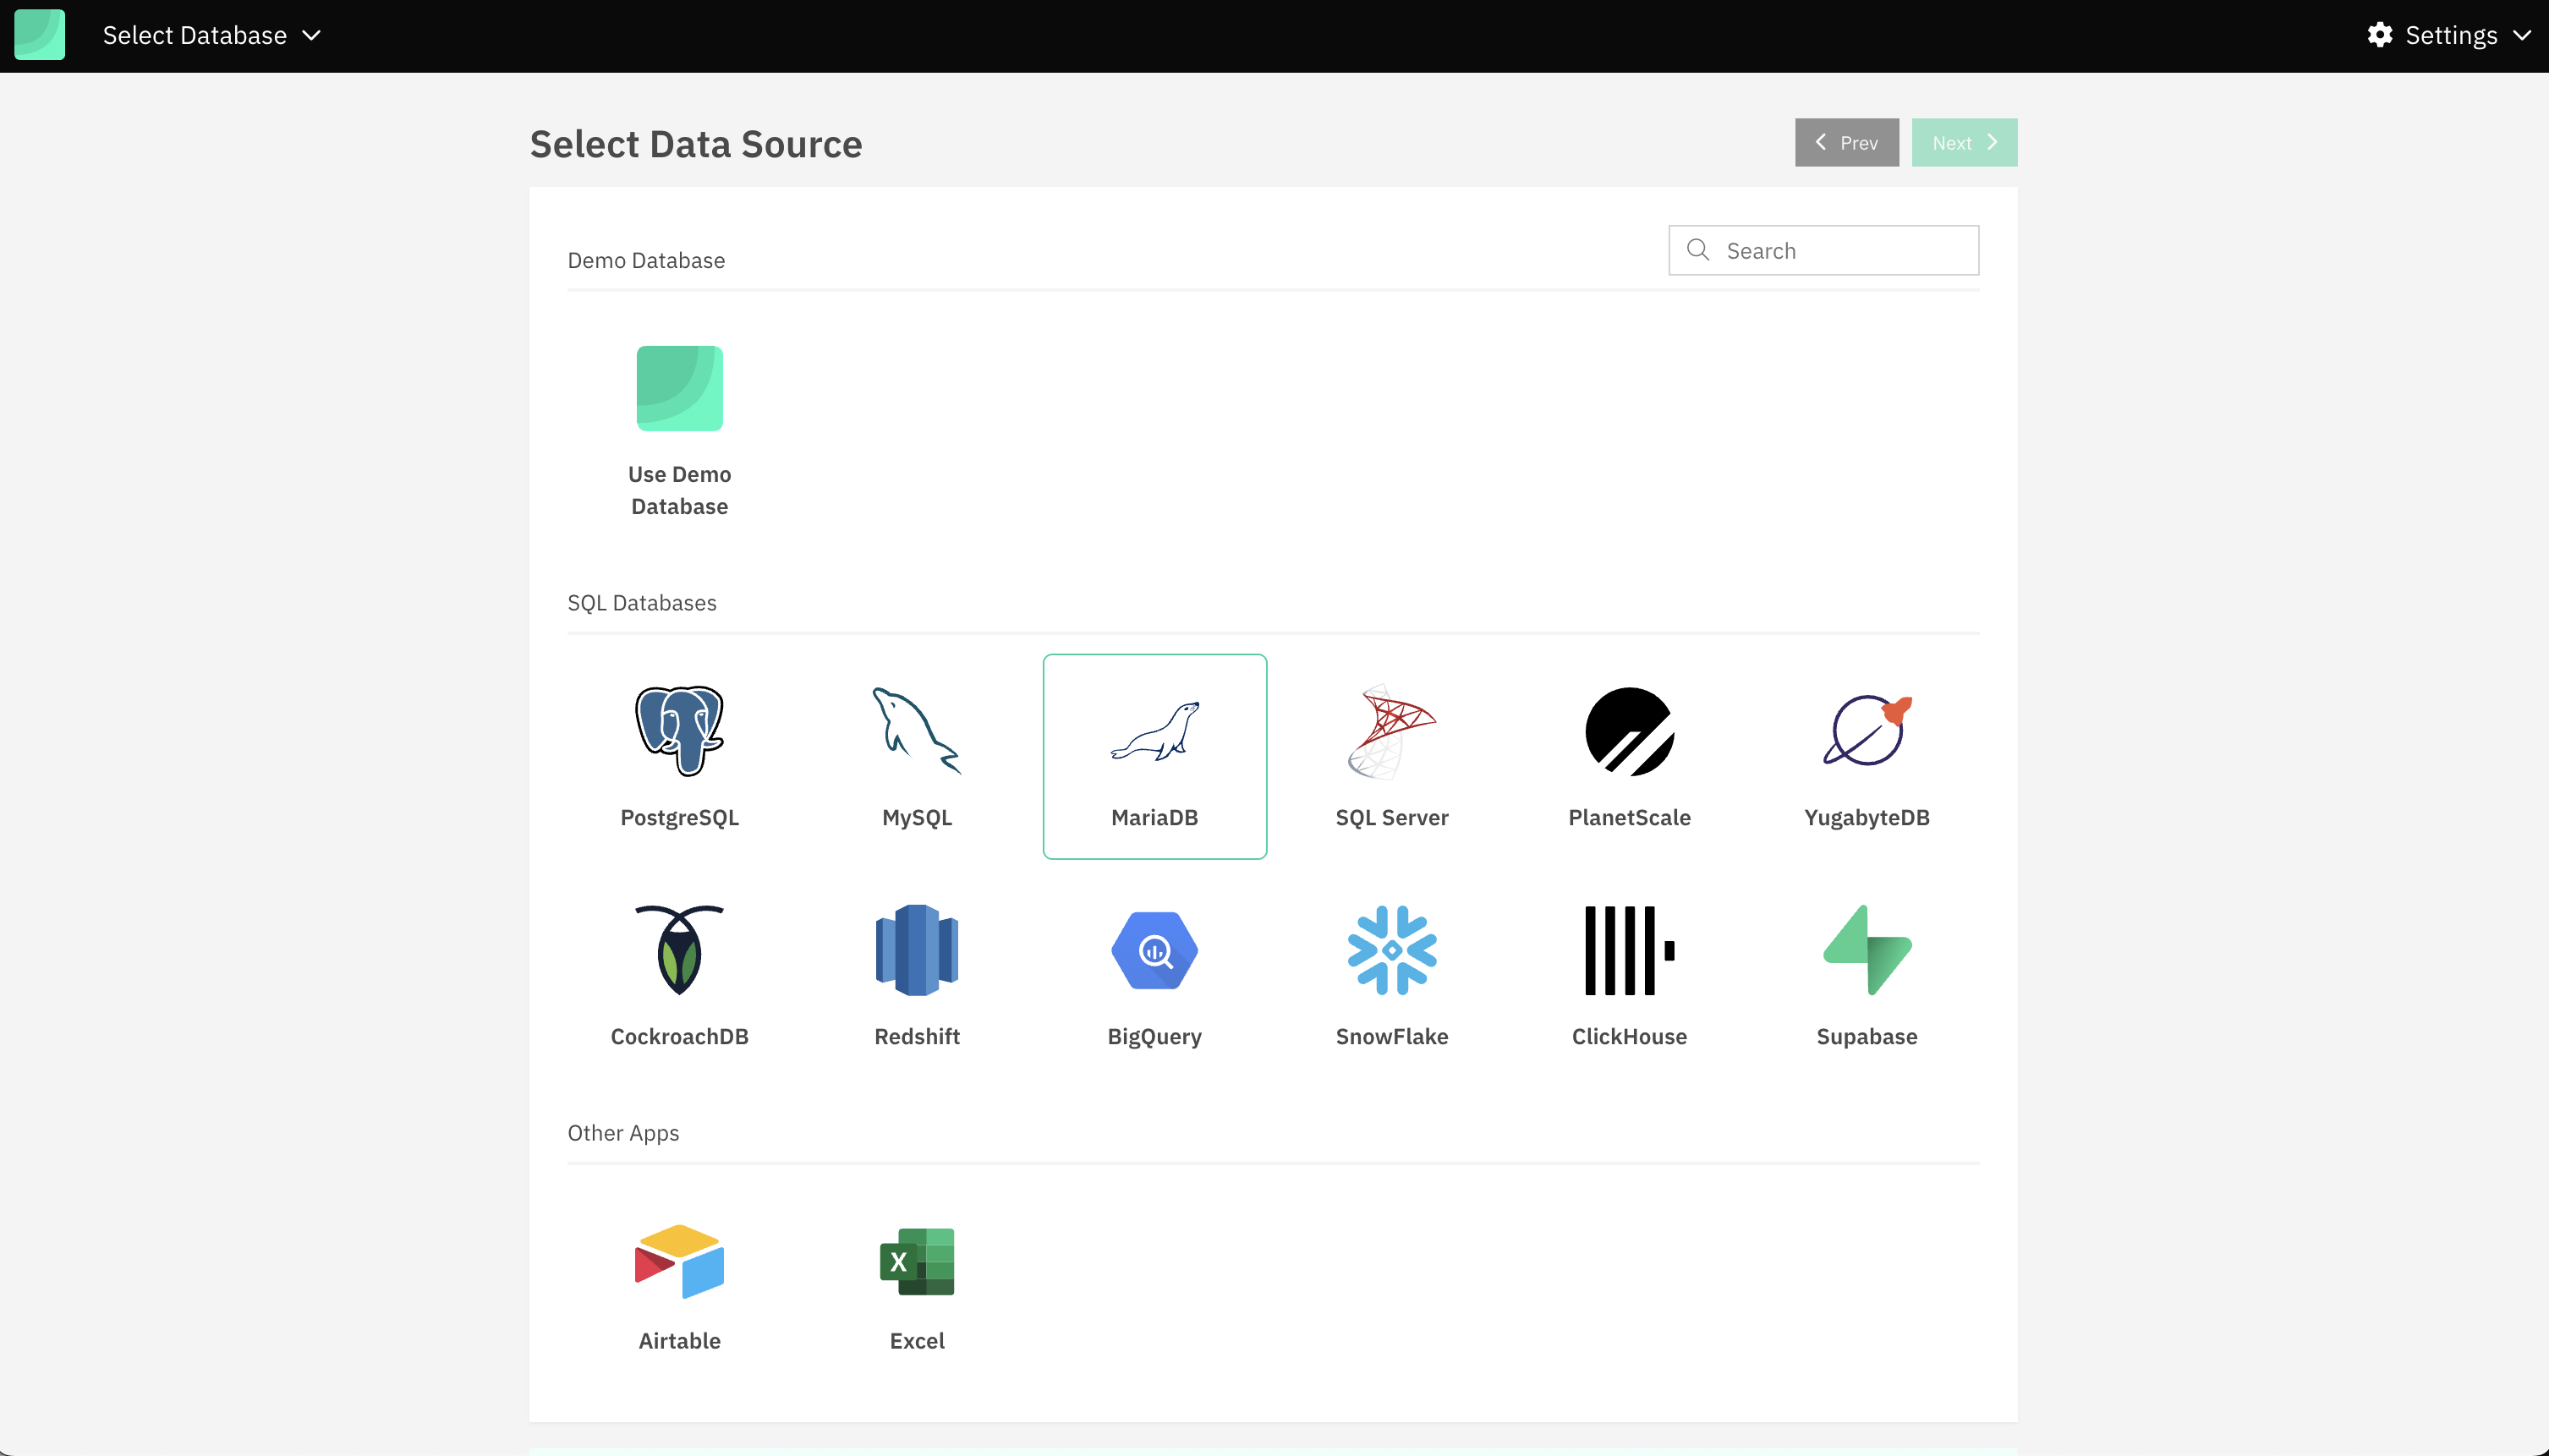
- Login into Draxlr and navigate to the Add Database page.
-
Select MySQL/MariaDB/Postgres from the available database options (based on your Moodle setup).
-
Add the database credentials into respective fields.
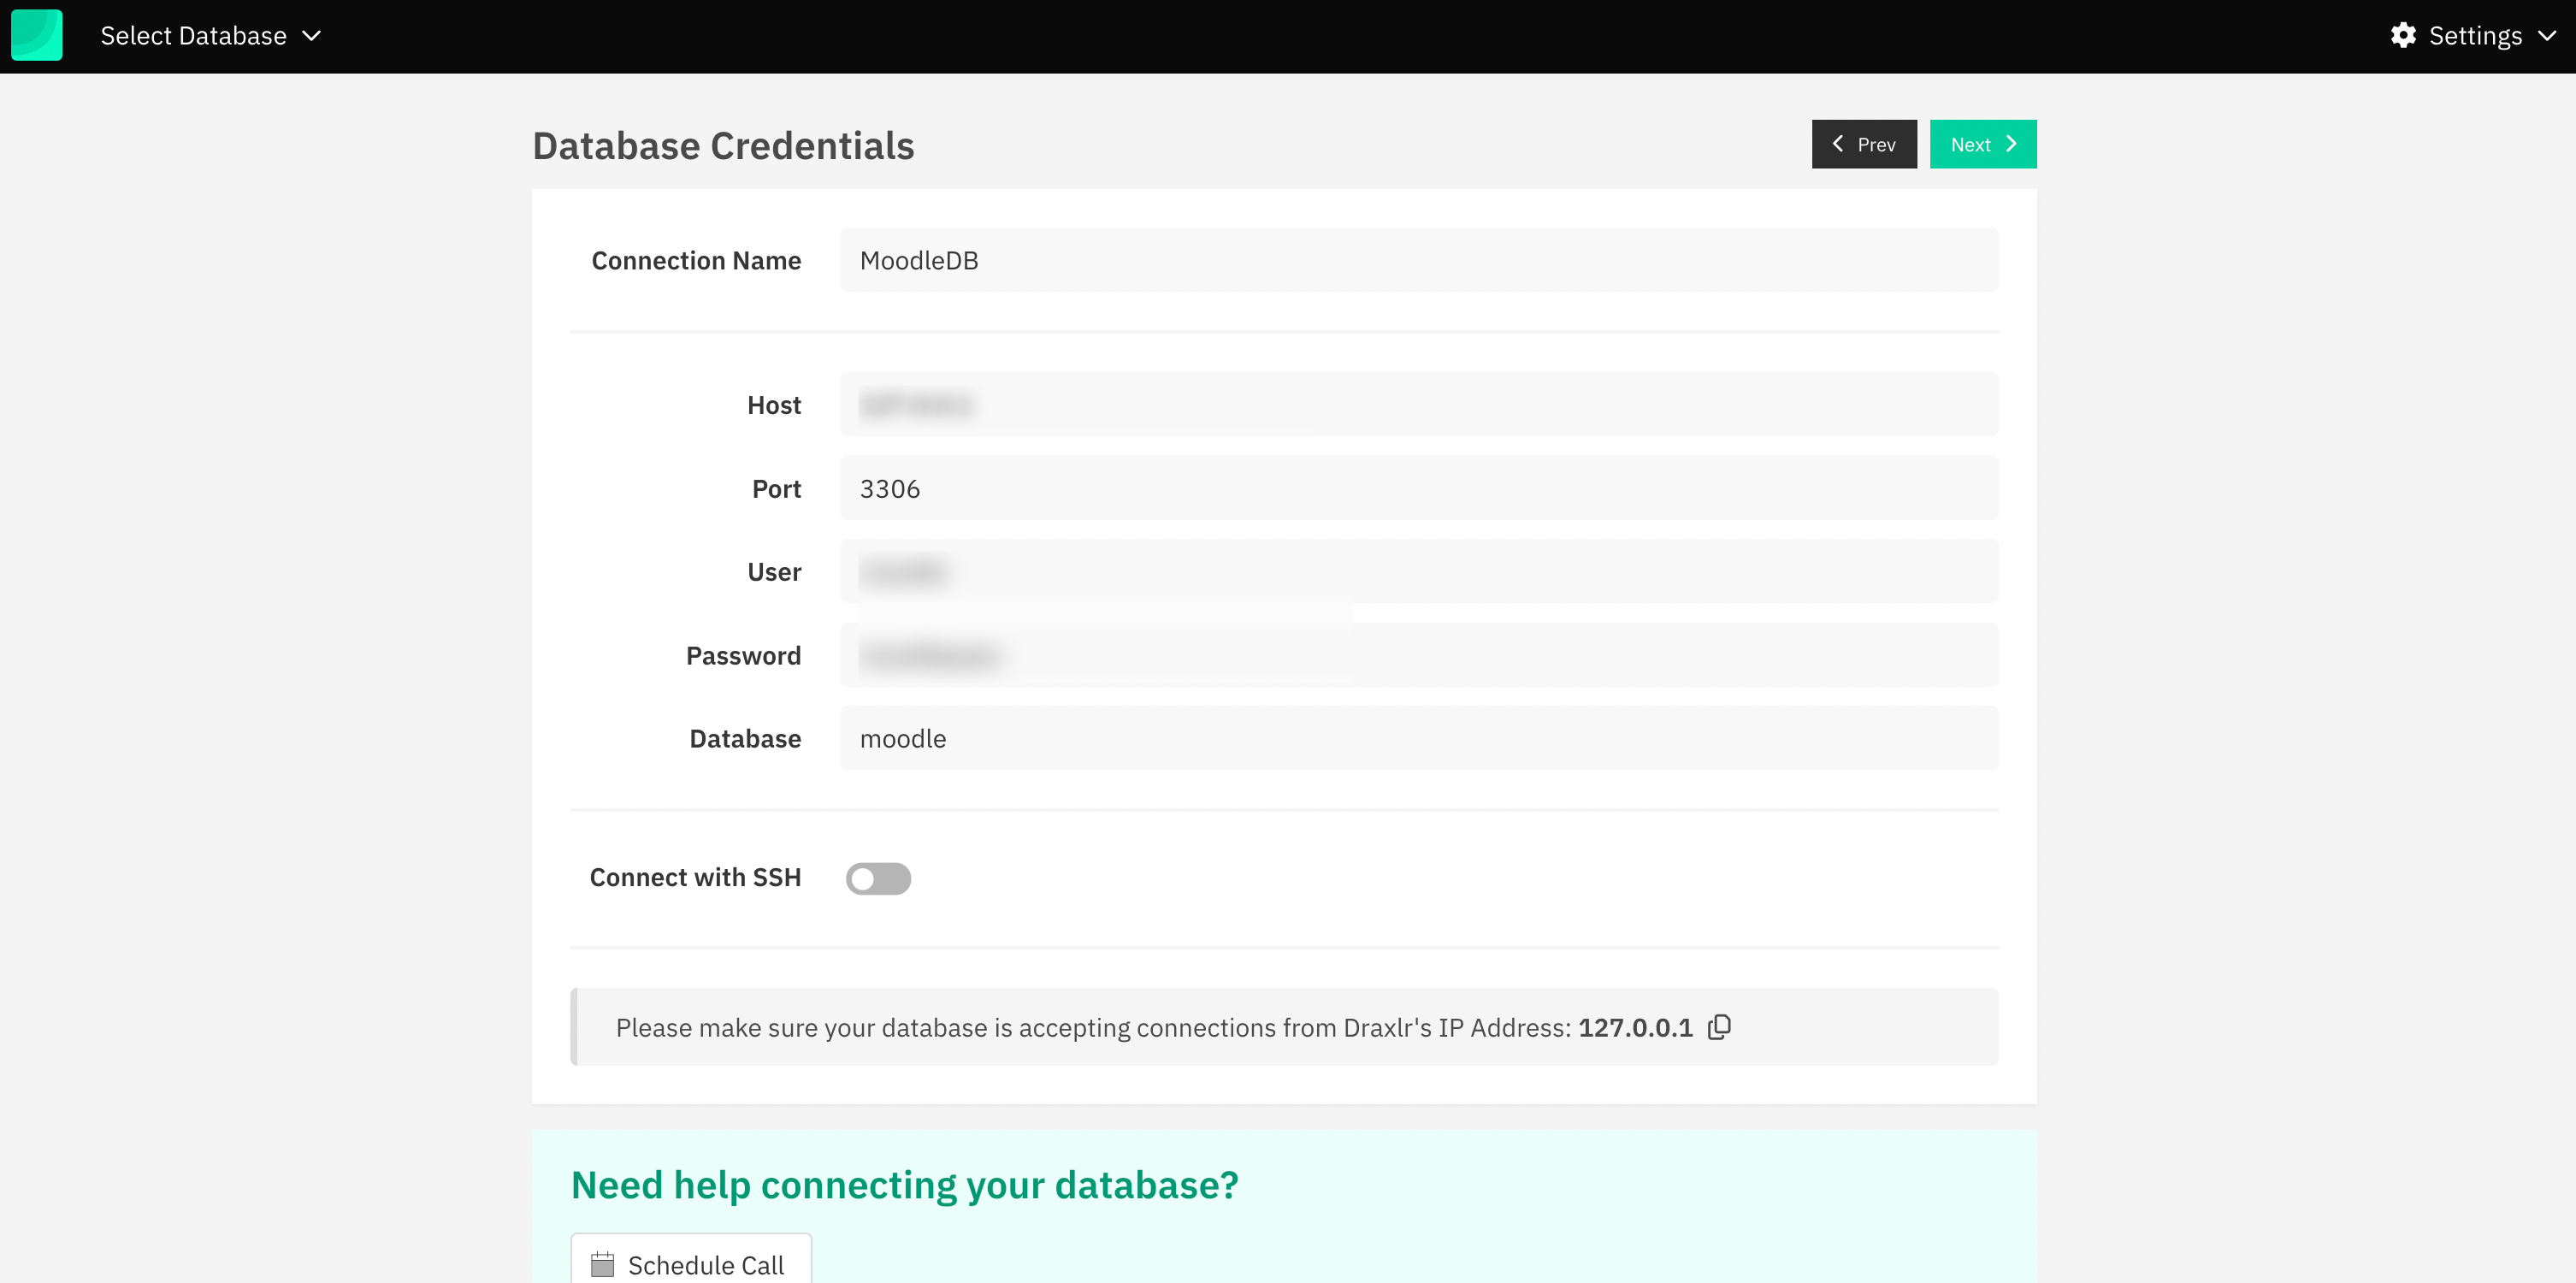
-
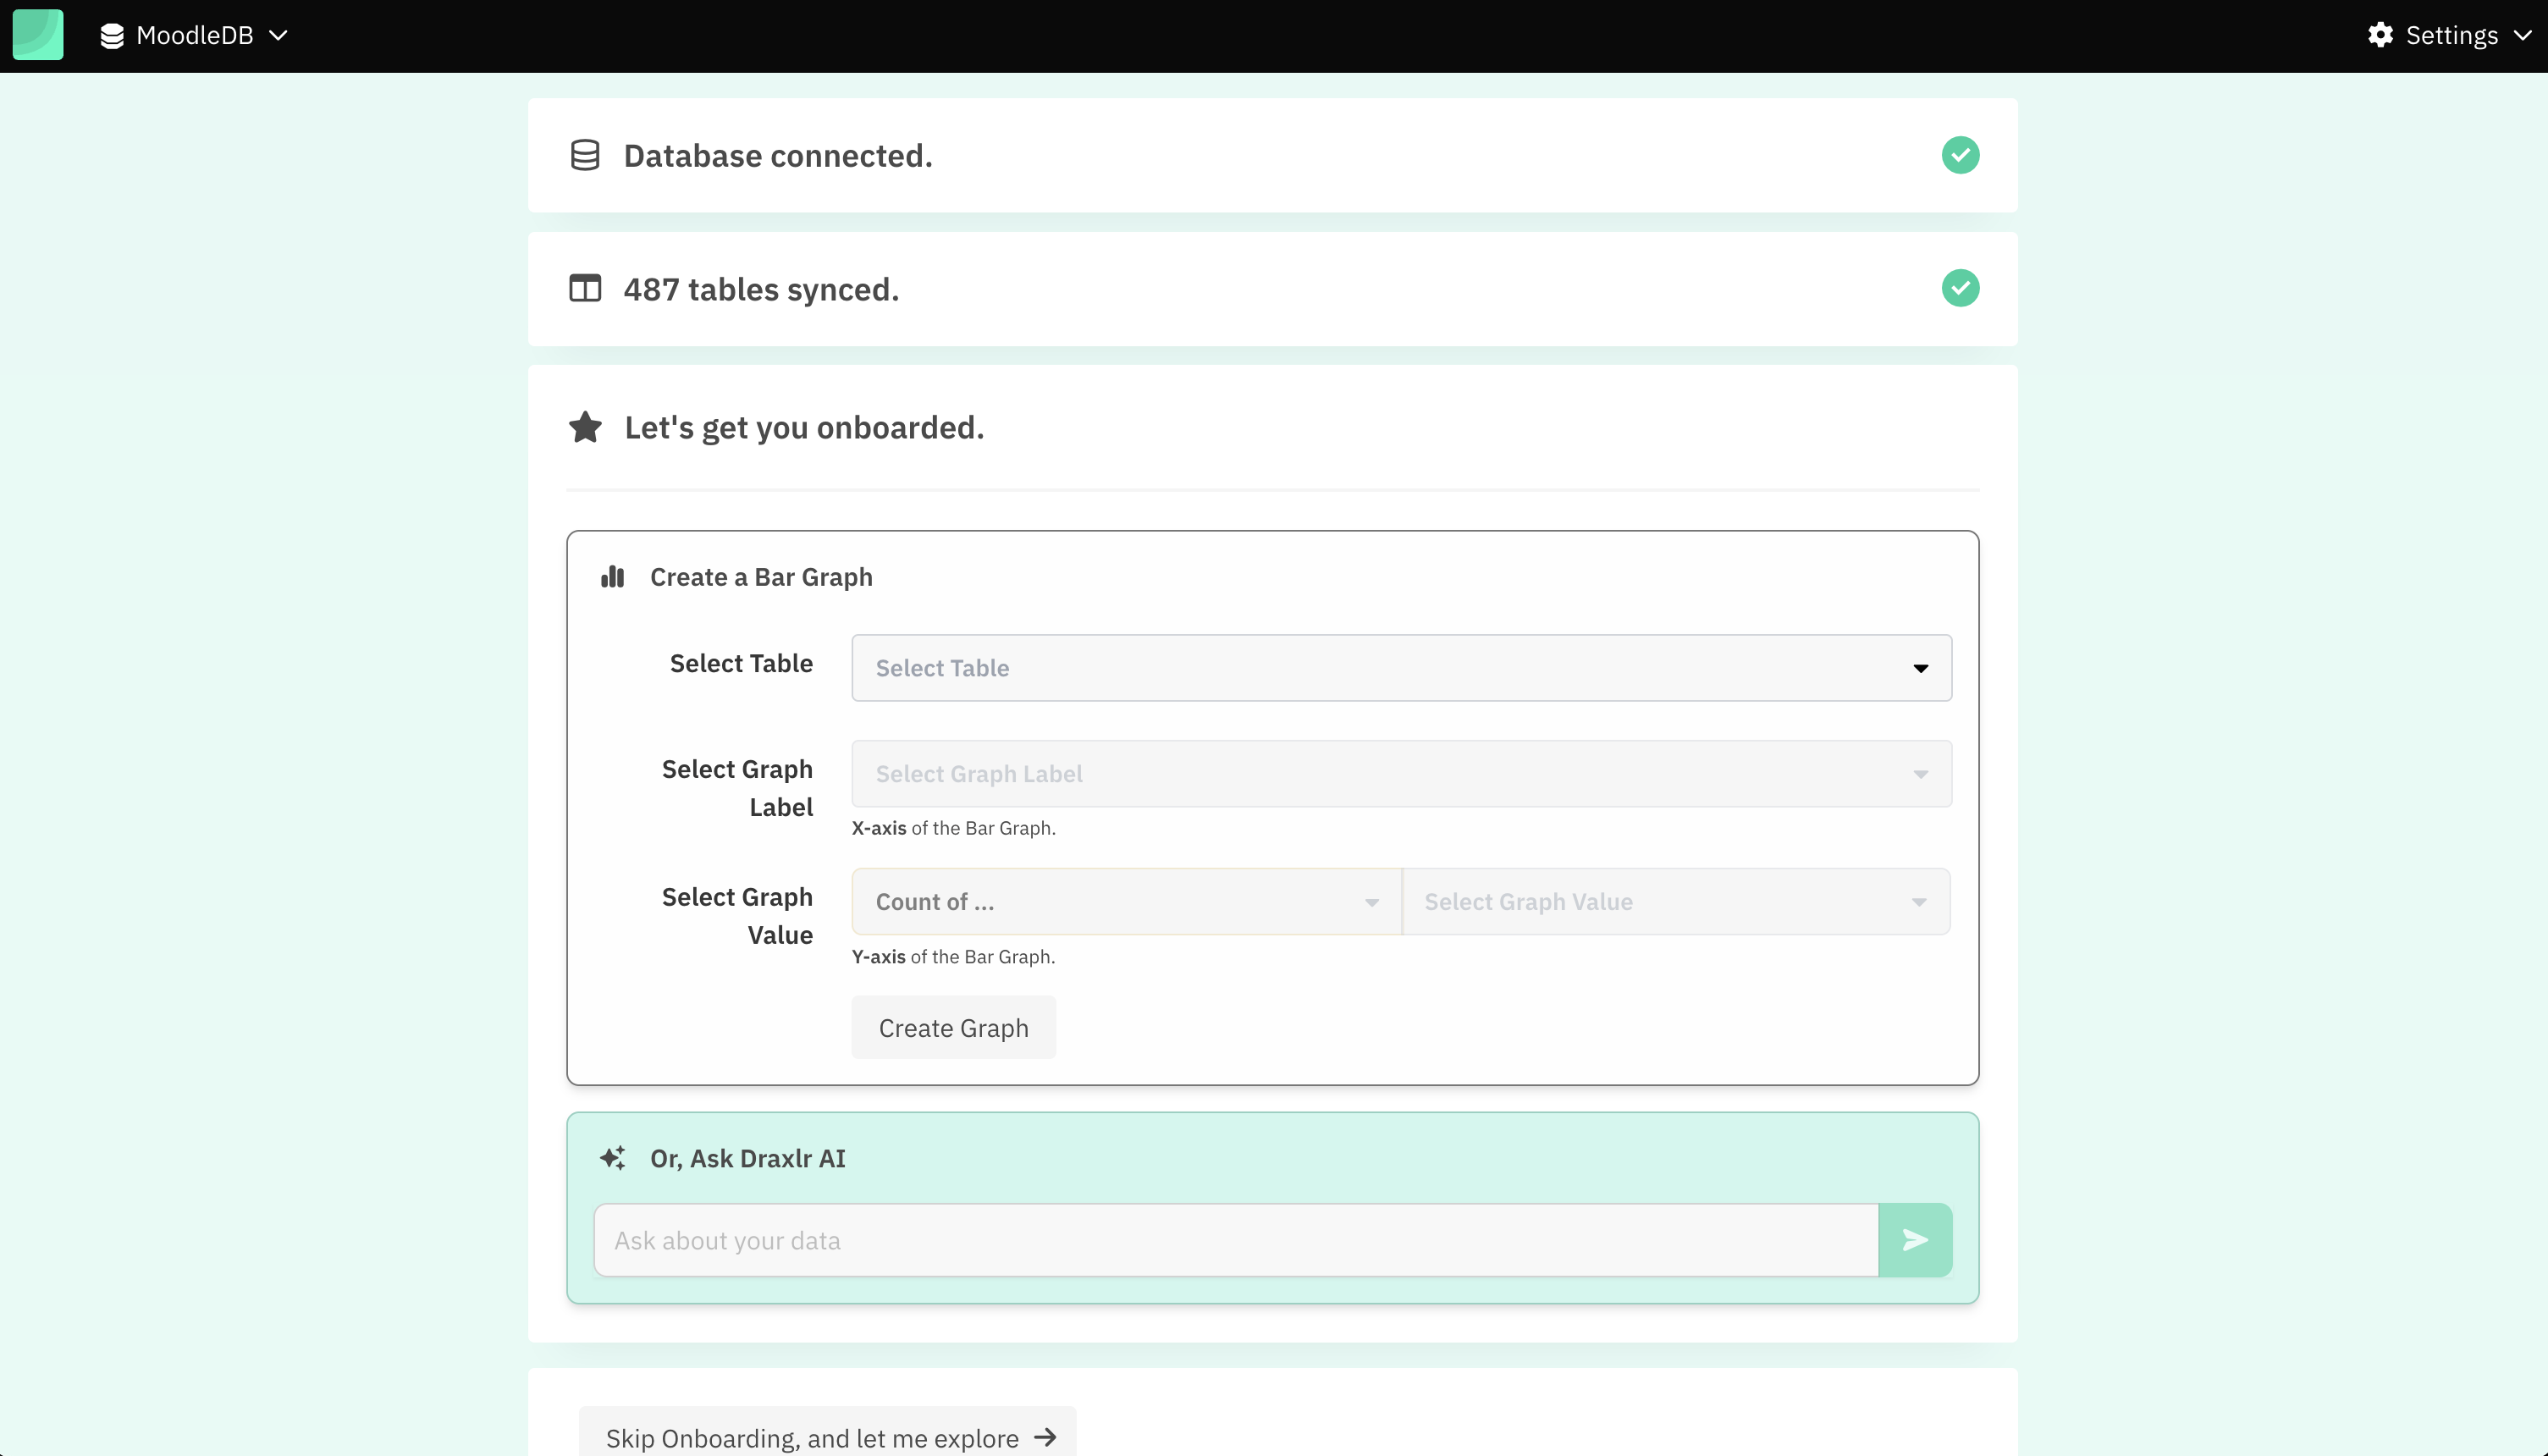
After entering the credentials, click on Connect. Draxlr will sync the database schema and tables.
Create Queries Using the Visual Query Builder
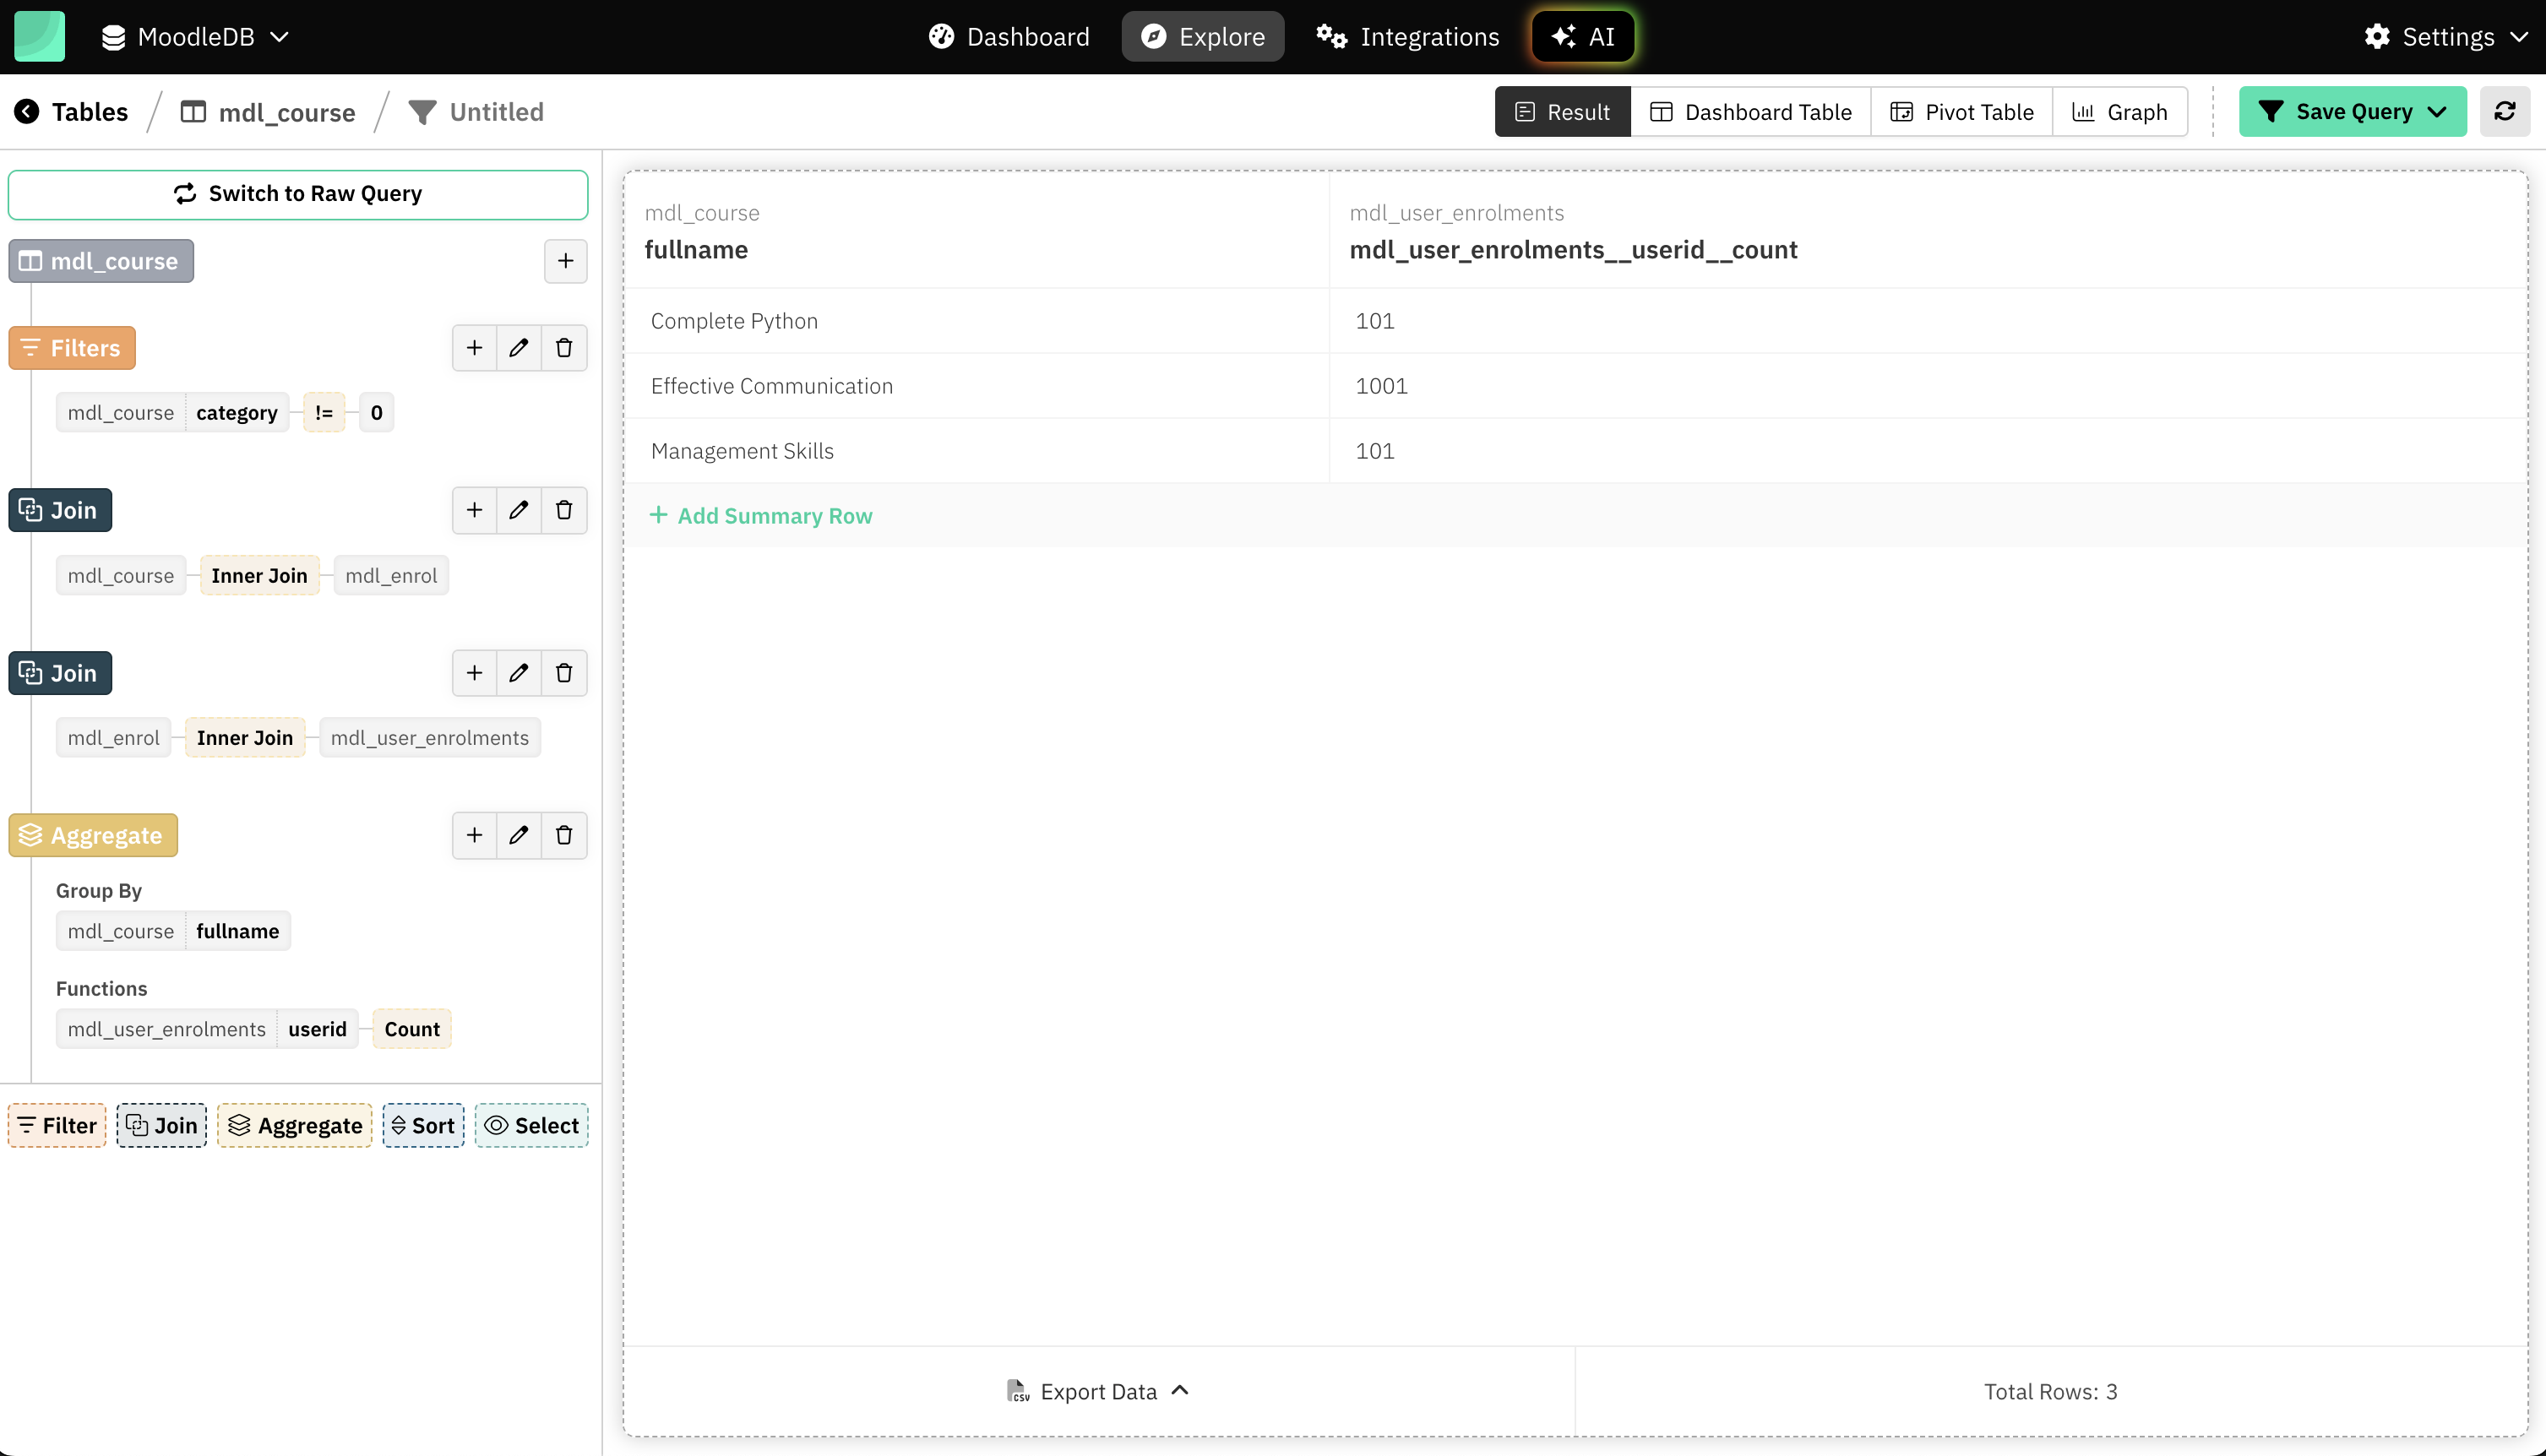
Draxlr makes it easy to explore your Moodle data using its Visual Query Builder—a no-code interface designed for simplicity and power.
From the left panel, you can build queries step-by-step:
- Filter: Add conditions to narrow down rows (e.g., courses with specific names).
- Join: Combine data from multiple tables like
mdl_user,mdl_course, ormdl_enrol. - Aggregate: Group and summarize data (e.g., total enrolments per course).
- Sort: Order your results by any column.
- Select: Choose which fields to display in the result.
In the preview area, results update live so you can instantly see the effect of your changes.
This intuitive layout lets you build even complex queries without writing SQL, making it ideal for educators, administrators, or analysts working with Moodle data.
Step by Step Example: Building a Dashboard for Moodle Course Data
Use the AI Query Builder
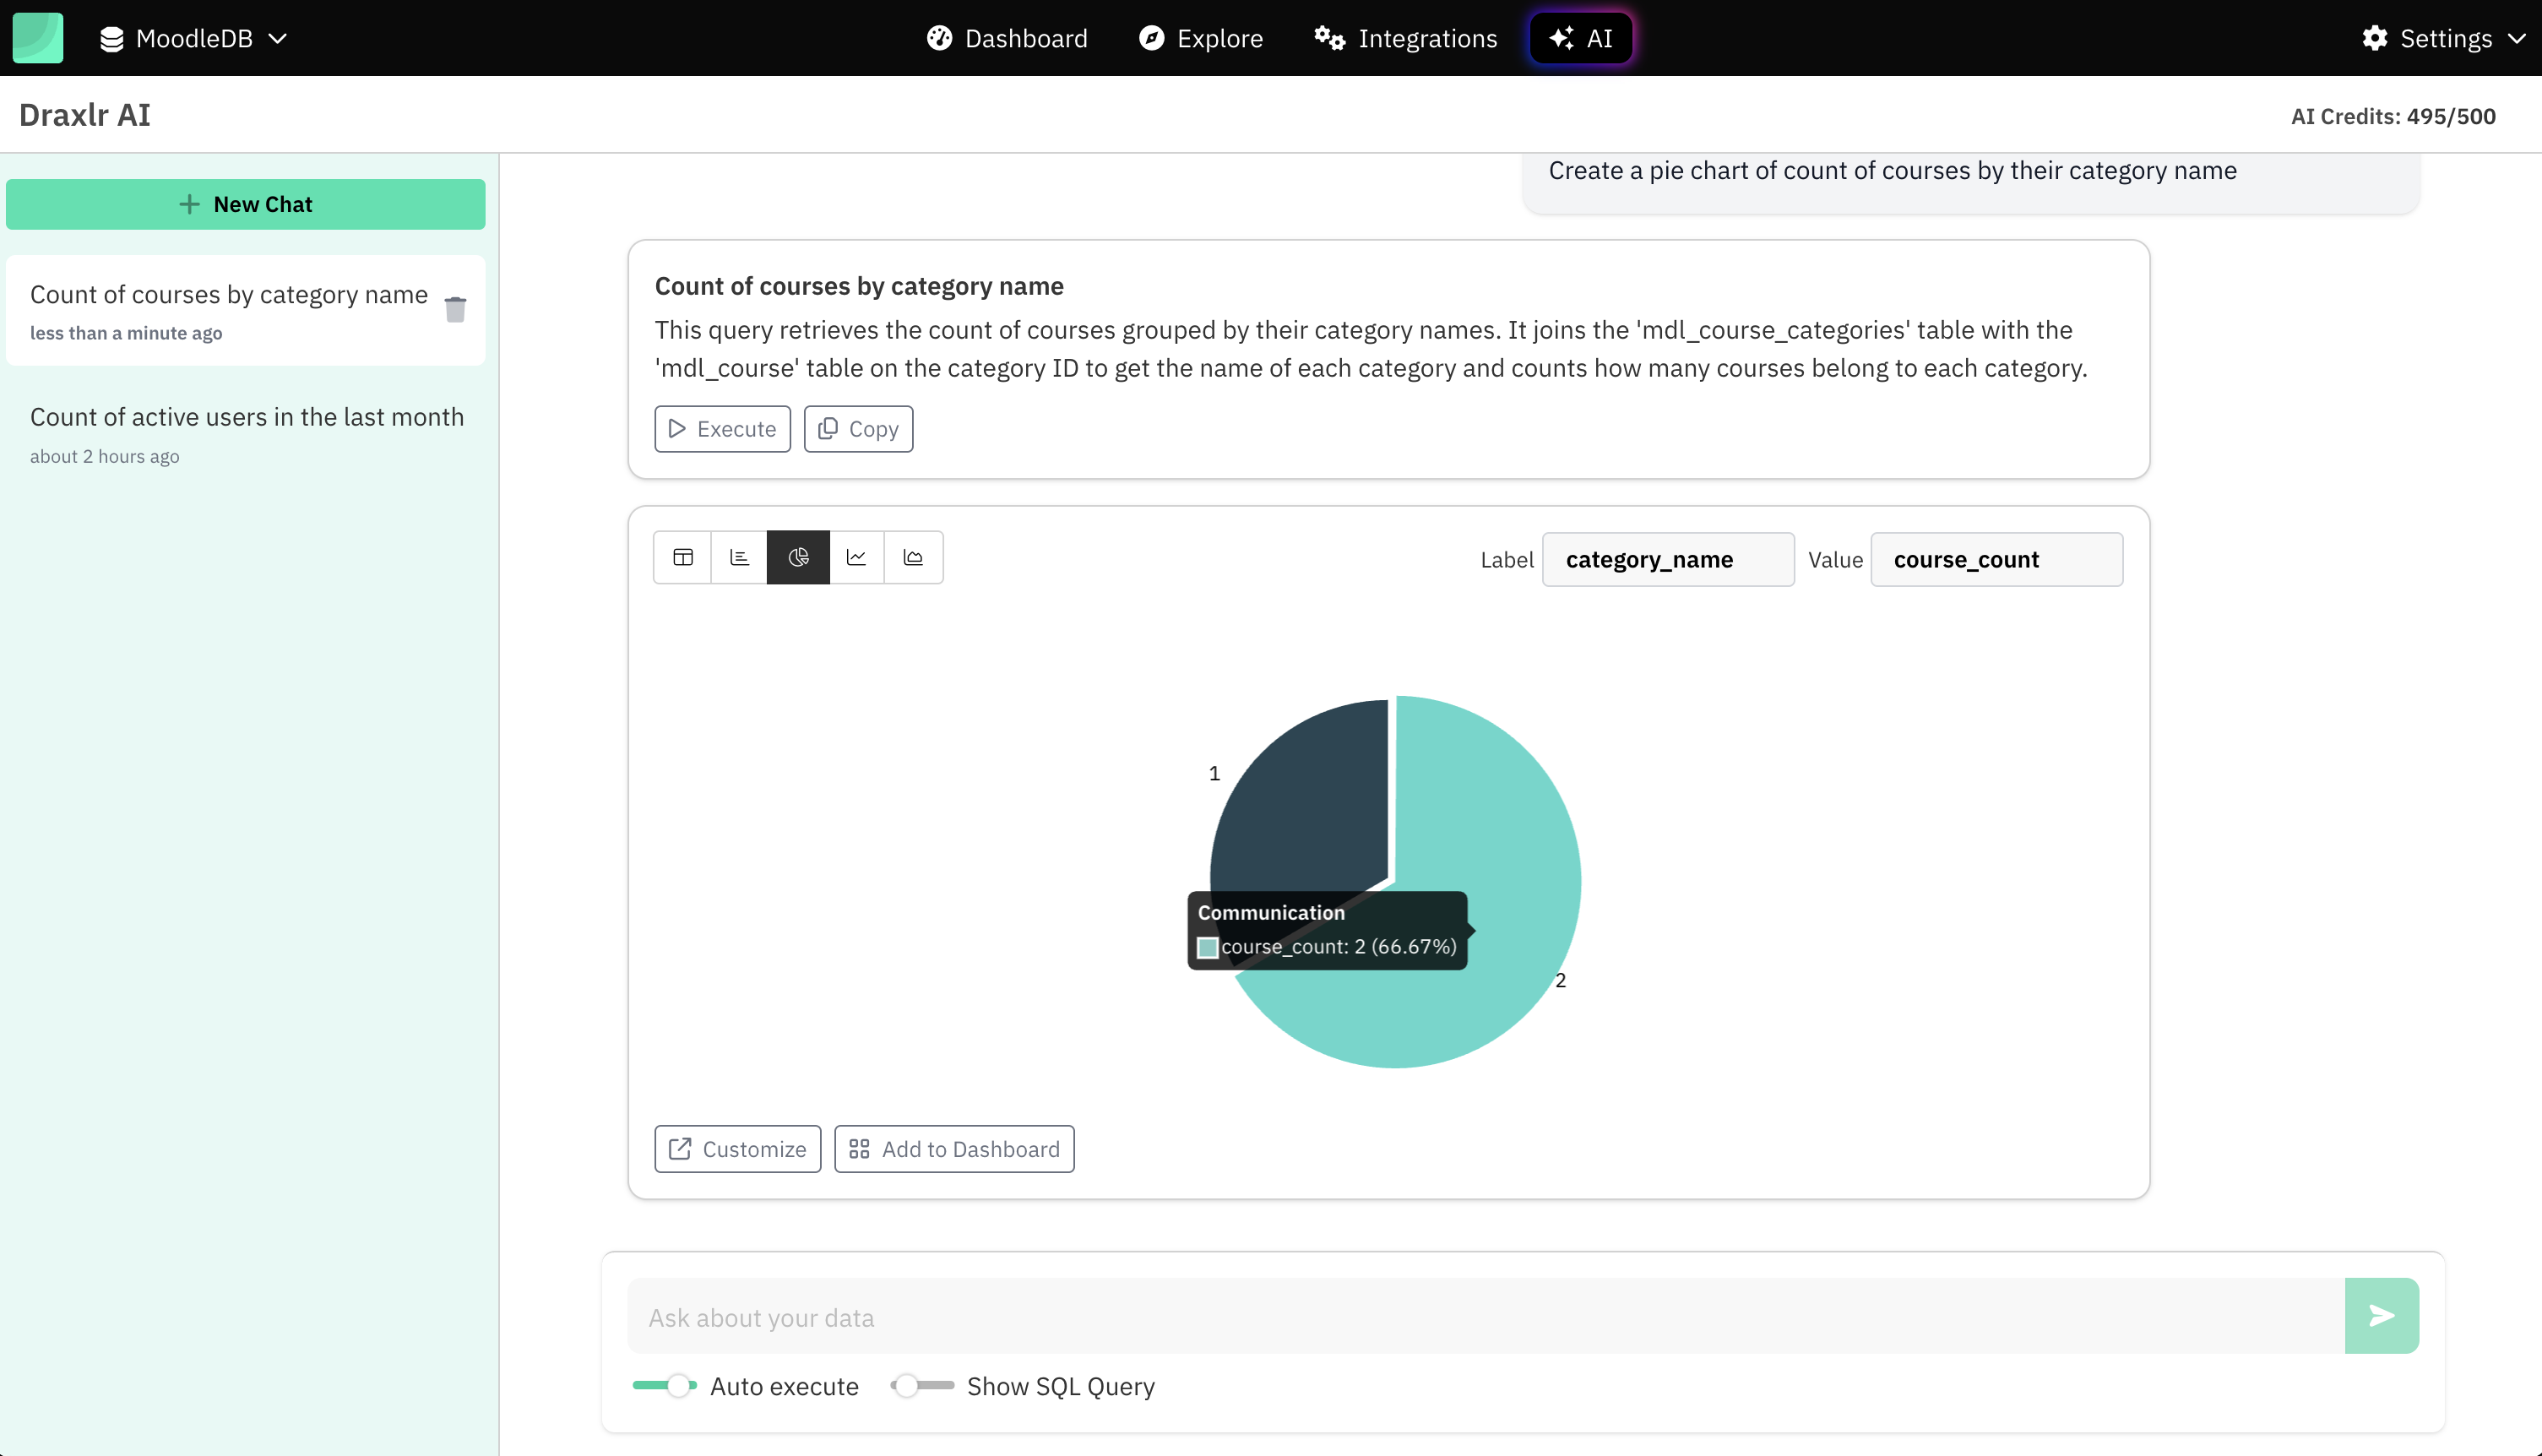
Draxlr includes an AI-powered Query Builder that works like ChatGPT to help you generate SQL queries using plain English.
Simply describe what you want—for example:
Create a bar chart of count of courses by their category name
The AI will instantly generate the correct SQL query for your Moodle database, which you can run, tweak, or visualize.
This is especially useful if:
- You're not familiar with SQL
- You want to speed up report creation
- You need help exploring unfamiliar Moodle tables
With Draxlr's AI assistant, anyone on your team can build complex queries with ease—just ask a question.
Conclusion
Integrating your Moodle database with Draxlr unlocks powerful data exploration and visualization capabilities—without needing to write SQL. Whether you're tracking student engagement, course performance, or enrolment trends, Draxlr makes it easy to build custom dashboards and monitor what matters.
Start turning your Moodle data into insights today with Draxlr BI experience.
Connect your Moodle Database- Jaskaran Singh

