How to Create and Embed a Dashboard for Your Supabase Database Using Draxlr
Learn how to build and embed a real-time customer dashboard for your Supabase database using Draxlr. Connect your data, create visualizations without SQL, and add in-app analytics to your SaaS in minutes.
If you’re building your product on Supabase, you already have the perfect backend - authentication, APIs, and a fast PostgreSQL database.
But what happens when your customers start asking for insights? Usage stats, revenue charts, or activity reports, they all need a dashboard.
Building those dashboards from scratch can be time-consuming and technical.
That’s where Draxlr comes in a simple way to turn your Supabase data into beautiful, shareable dashboards that you can embed right inside your app.
Let’s see how.
1. Why Embed Analytics into Your Supabase App
Your users love data. Whether it’s tracking their team’s activity, revenue trends, or app performance - giving customers insights inside your product makes it more valuable.
Adding dashboards helps you:
- Increase customer engagement and trust
- Reduce custom reporting requests
- Offer analytics as a premium feature
- Strengthen your product’s stickiness
But building analytics features often means handling SQL, APIs, chart libraries, and permissions - all of which take time away from your core product.
That’s why many Supabase users turn to Draxlr. It connects directly to your database and lets you build, manage, and embed dashboards - without needing a full BI team.
2. Connect Supabase to Draxlr
Connecting your Supabase project to Draxlr takes just a minute.
- Log in to app.draxlr.com.
- You can either select Postgres (to add details manually) or Supabase (to connect you Supabase account and we fetch your project details automatically).
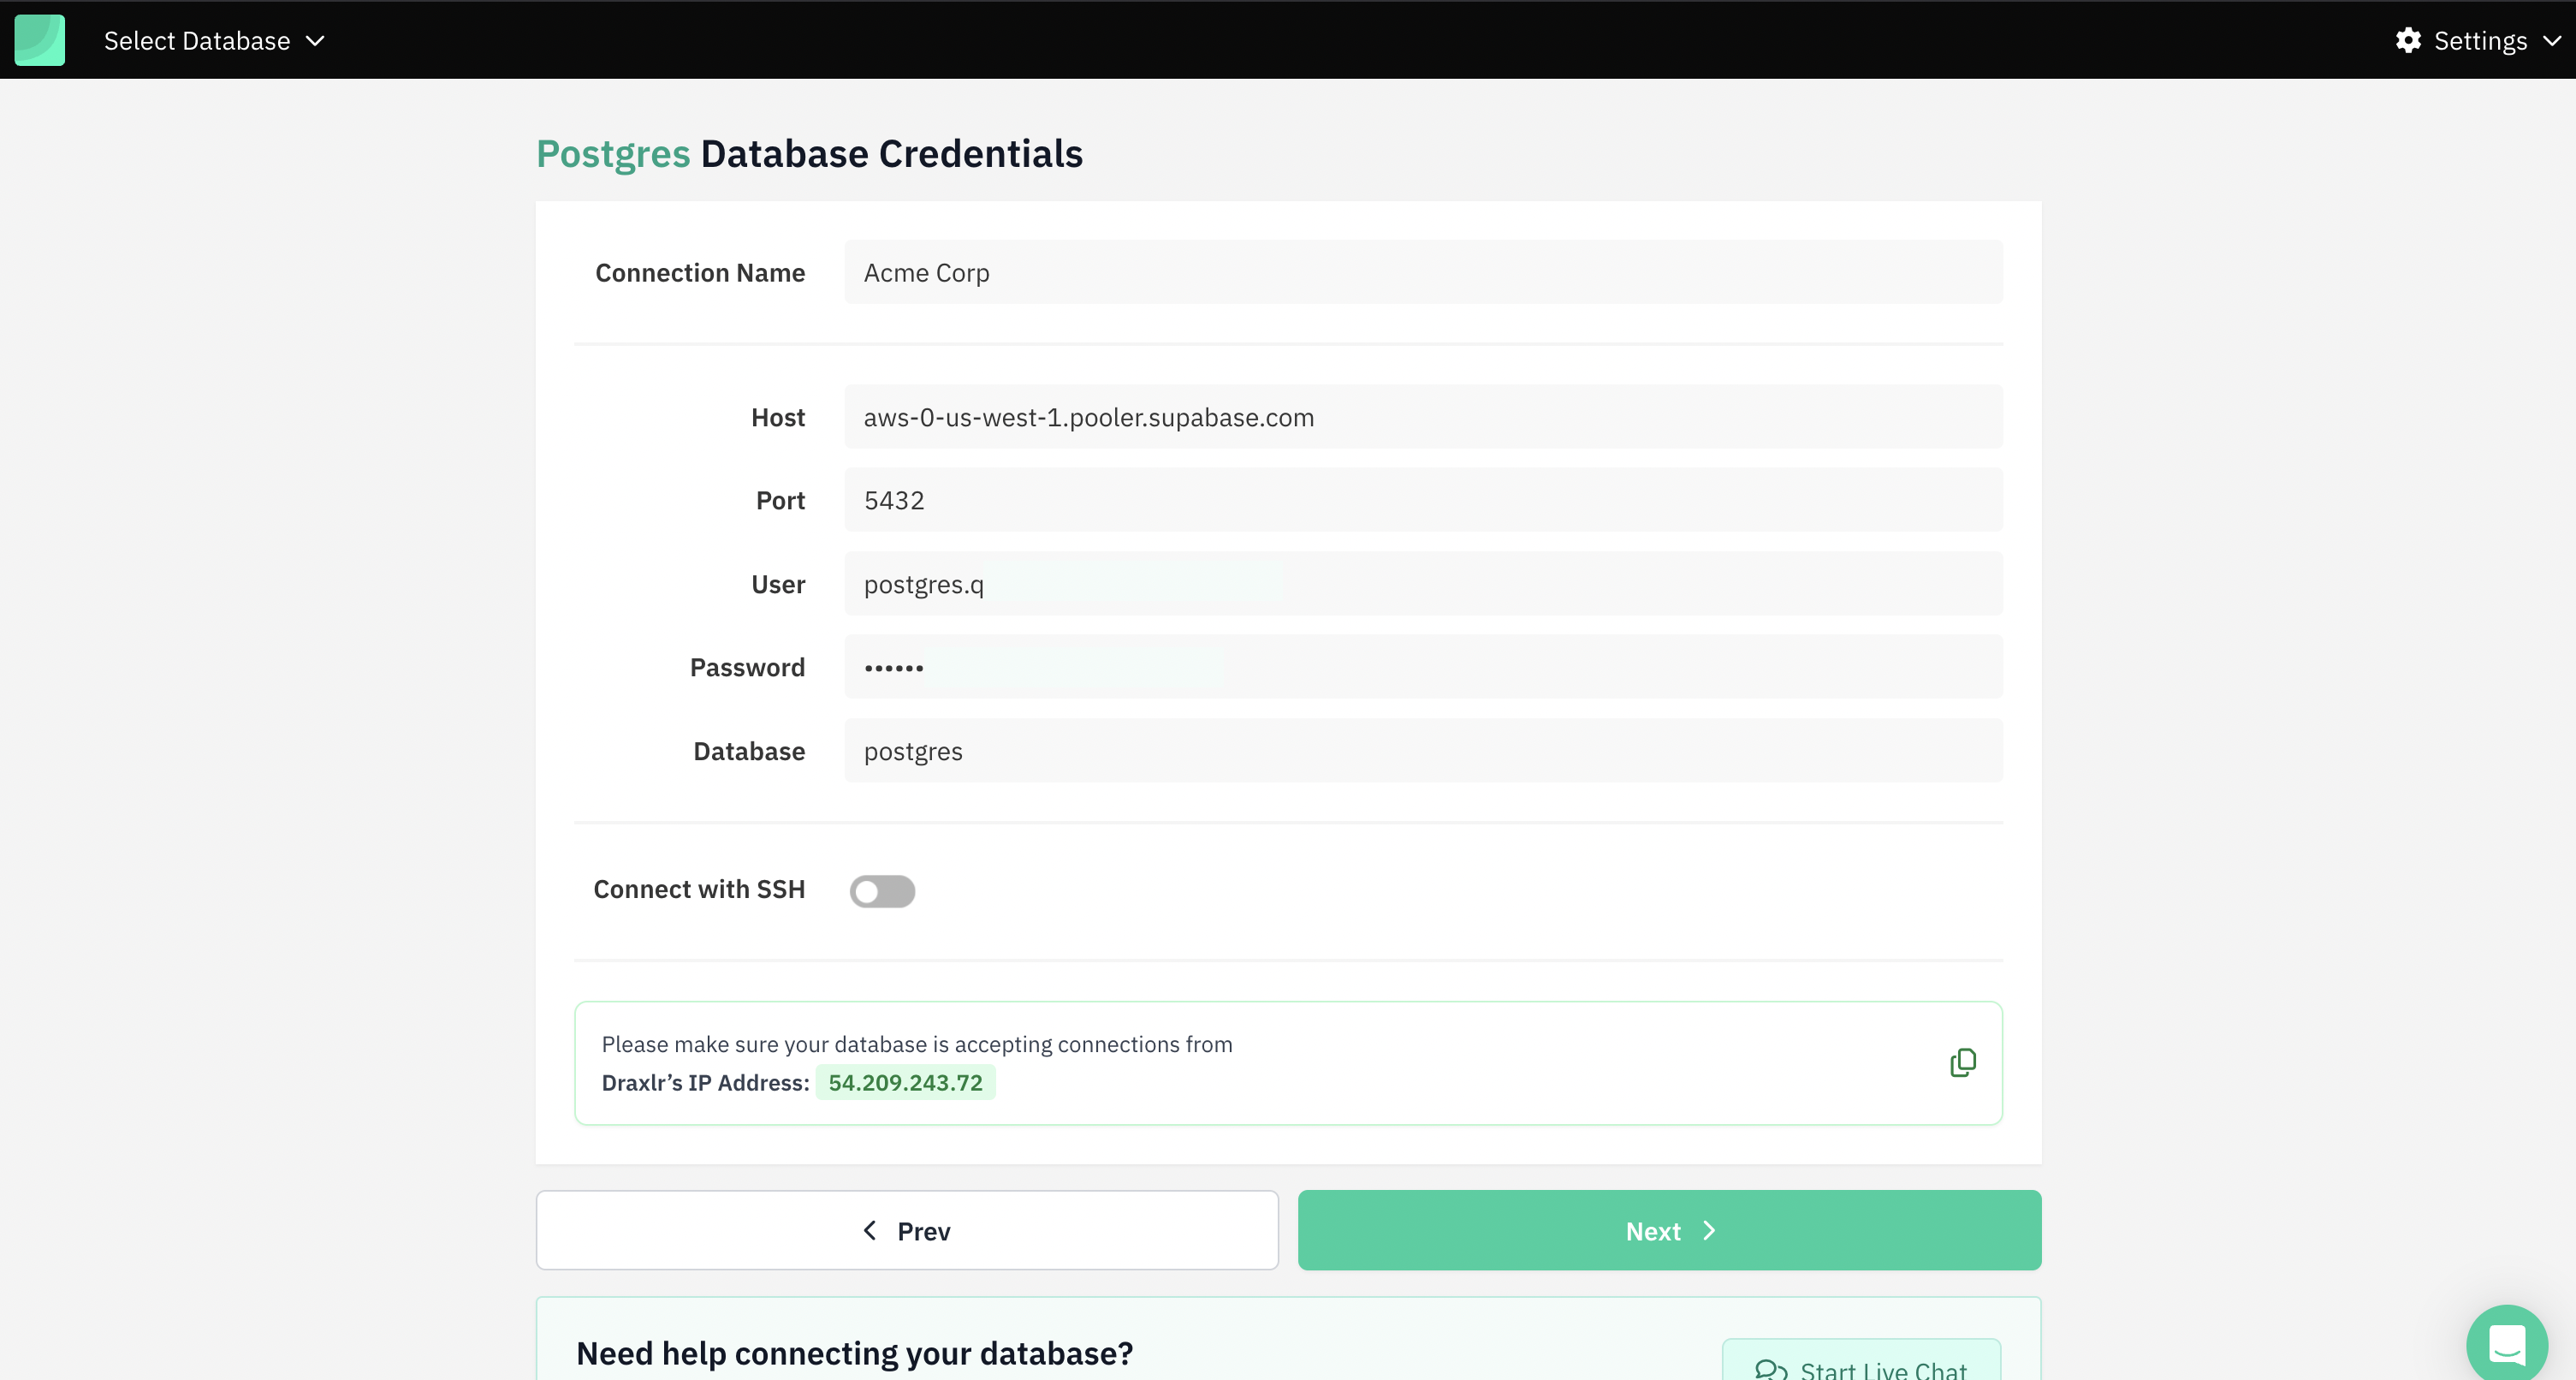
- To get your connection details in your Supabase project, go to Connect and select Direct in connection method.
- Confirm your database credentials - Host, Port, Username, Password, and Database Name.
- Click on Next and Draxlr will connect to your Supabase database.
That’s it! Draxlr will automatically detect your tables and columns so you can start exploring your data instantly.
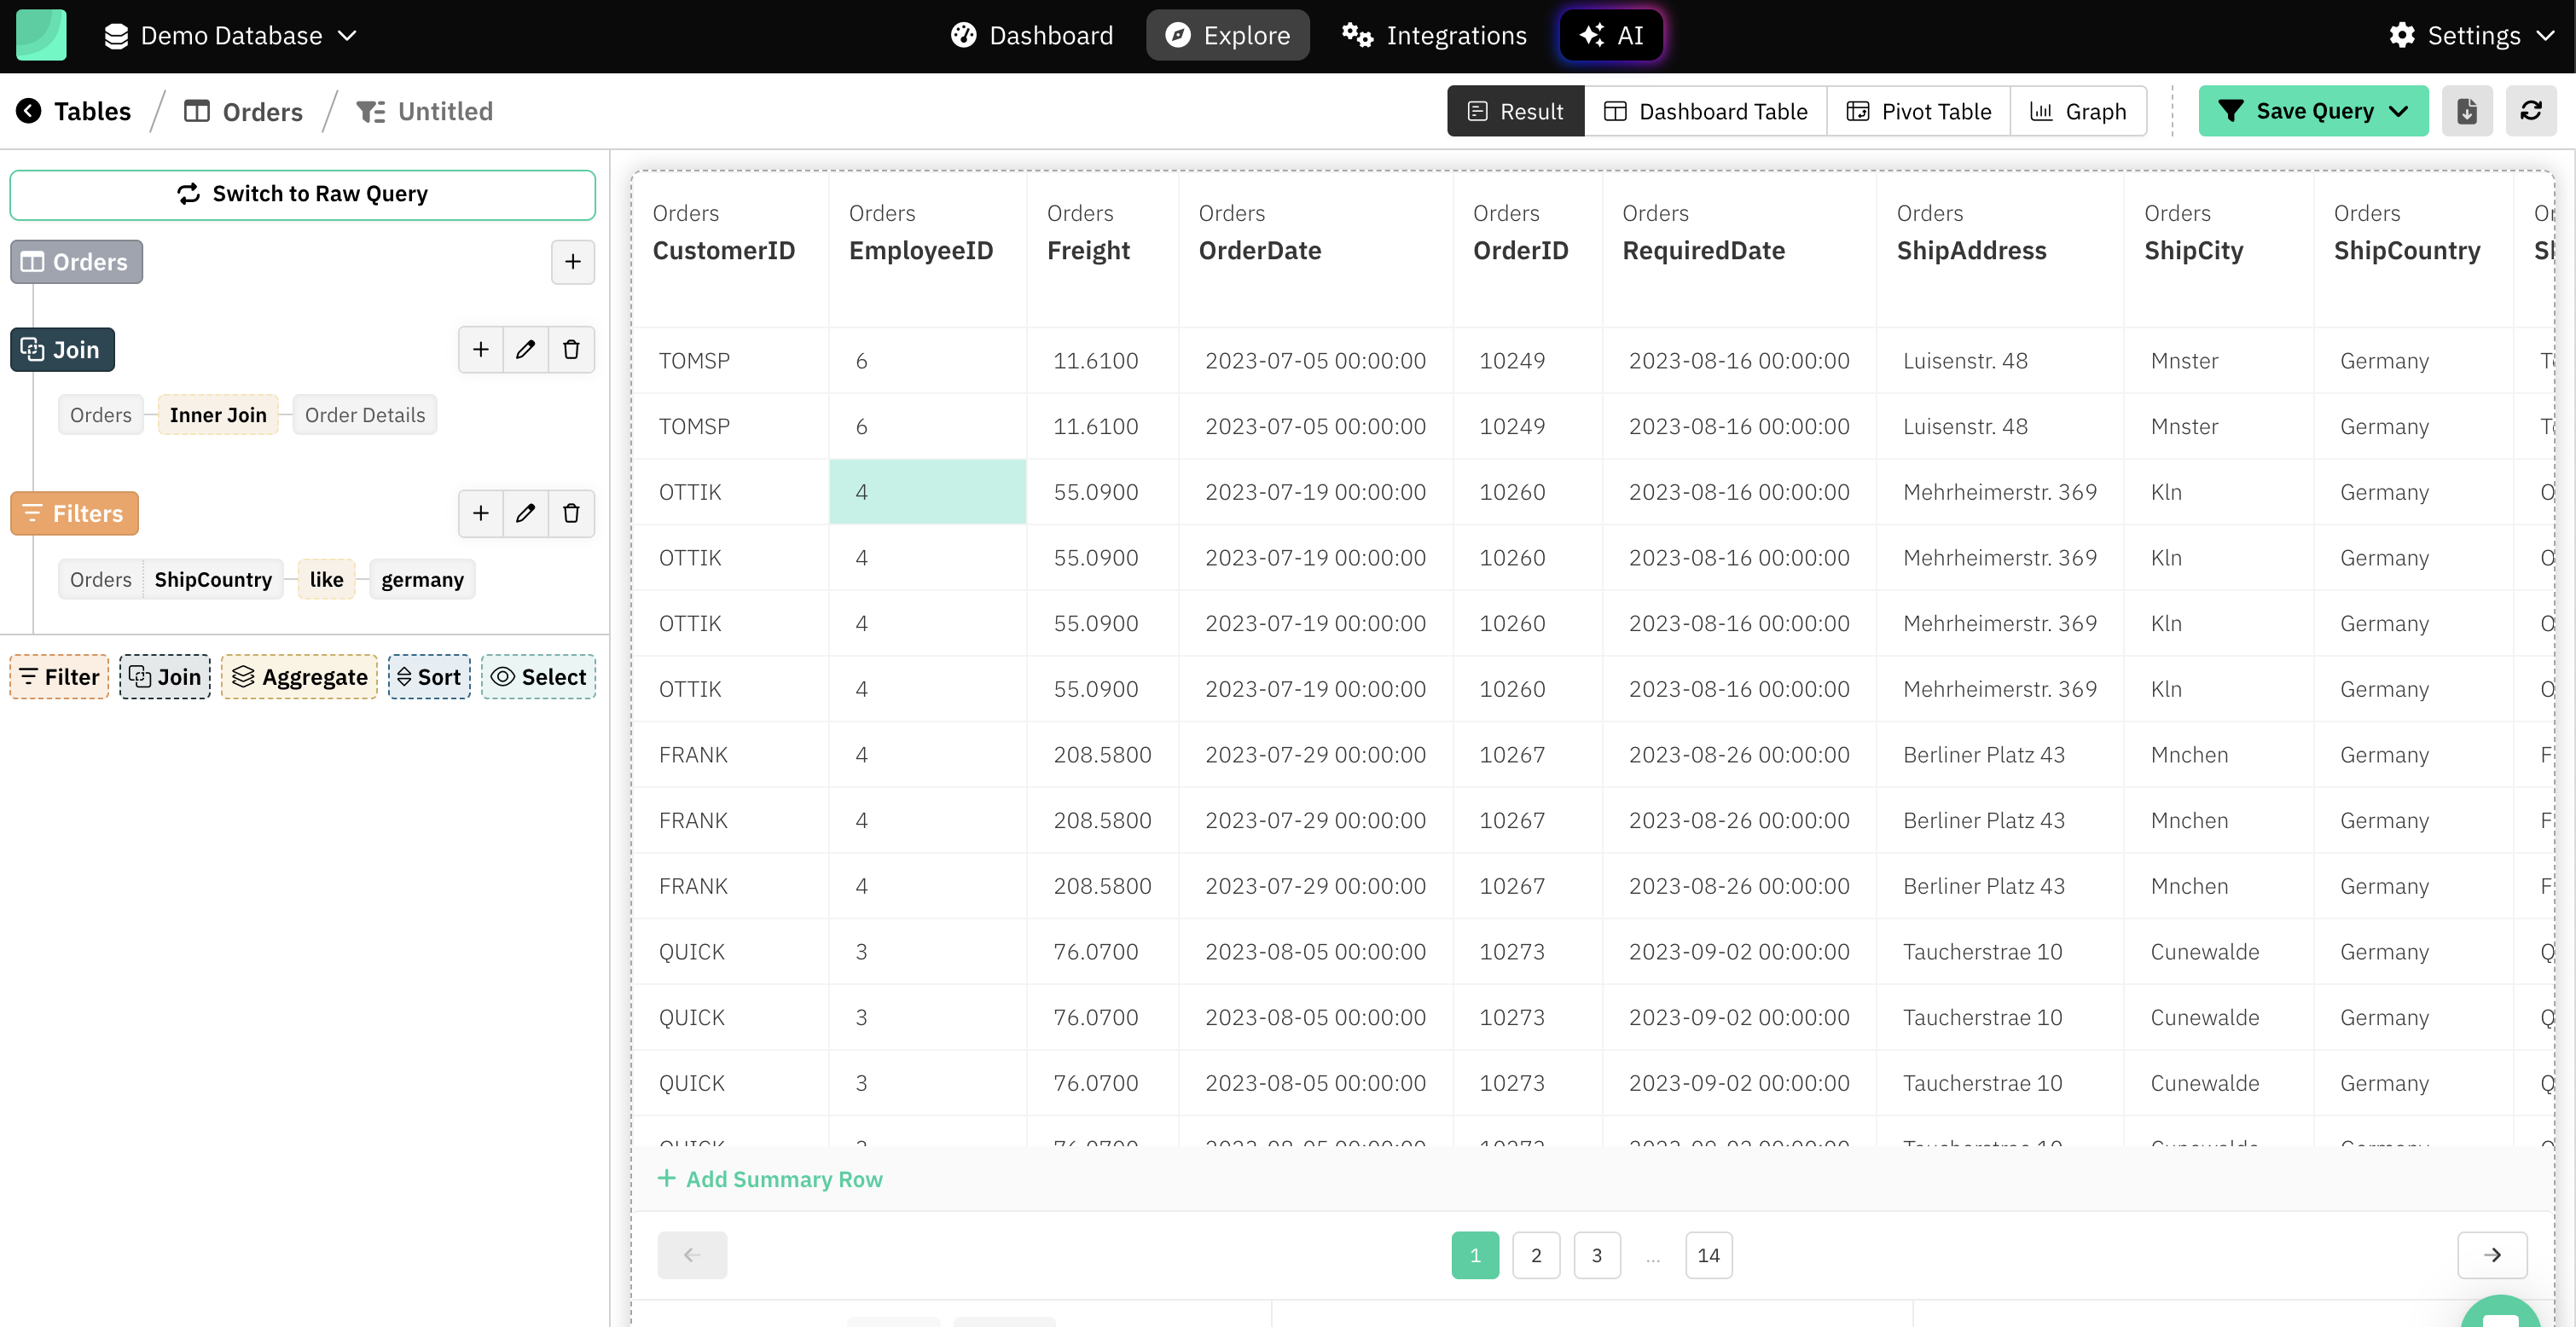
3. Build Dashboards the Easy Way
Once connected, you can create dashboards using Draxlr’s drag-and-drop builder.
No need to write code (unless you want to).
You can:
- Add charts, tables, or KPIs
- Choose your data visually
- Apply filters to slice by customer, date, or category
If you love SQL, you can still write your own queries - and even use AI Query Builder to generate them for you. Just describe what you want (like “show revenue by month”) and Draxlr will create the query automatically.
You can mix and match different widgets to tell the story you want your customers to see.
4. Embed Your Dashboard in Your App
Now for the fun part - embedding your dashboard inside your Supabase app.
Each dashboard in Draxlr can be shared securely using an embed link.
Here’s how:
-
Go to your dashboard and click Embed.

-
It'll open the embed preview window where you can customize the appearance and access settings.
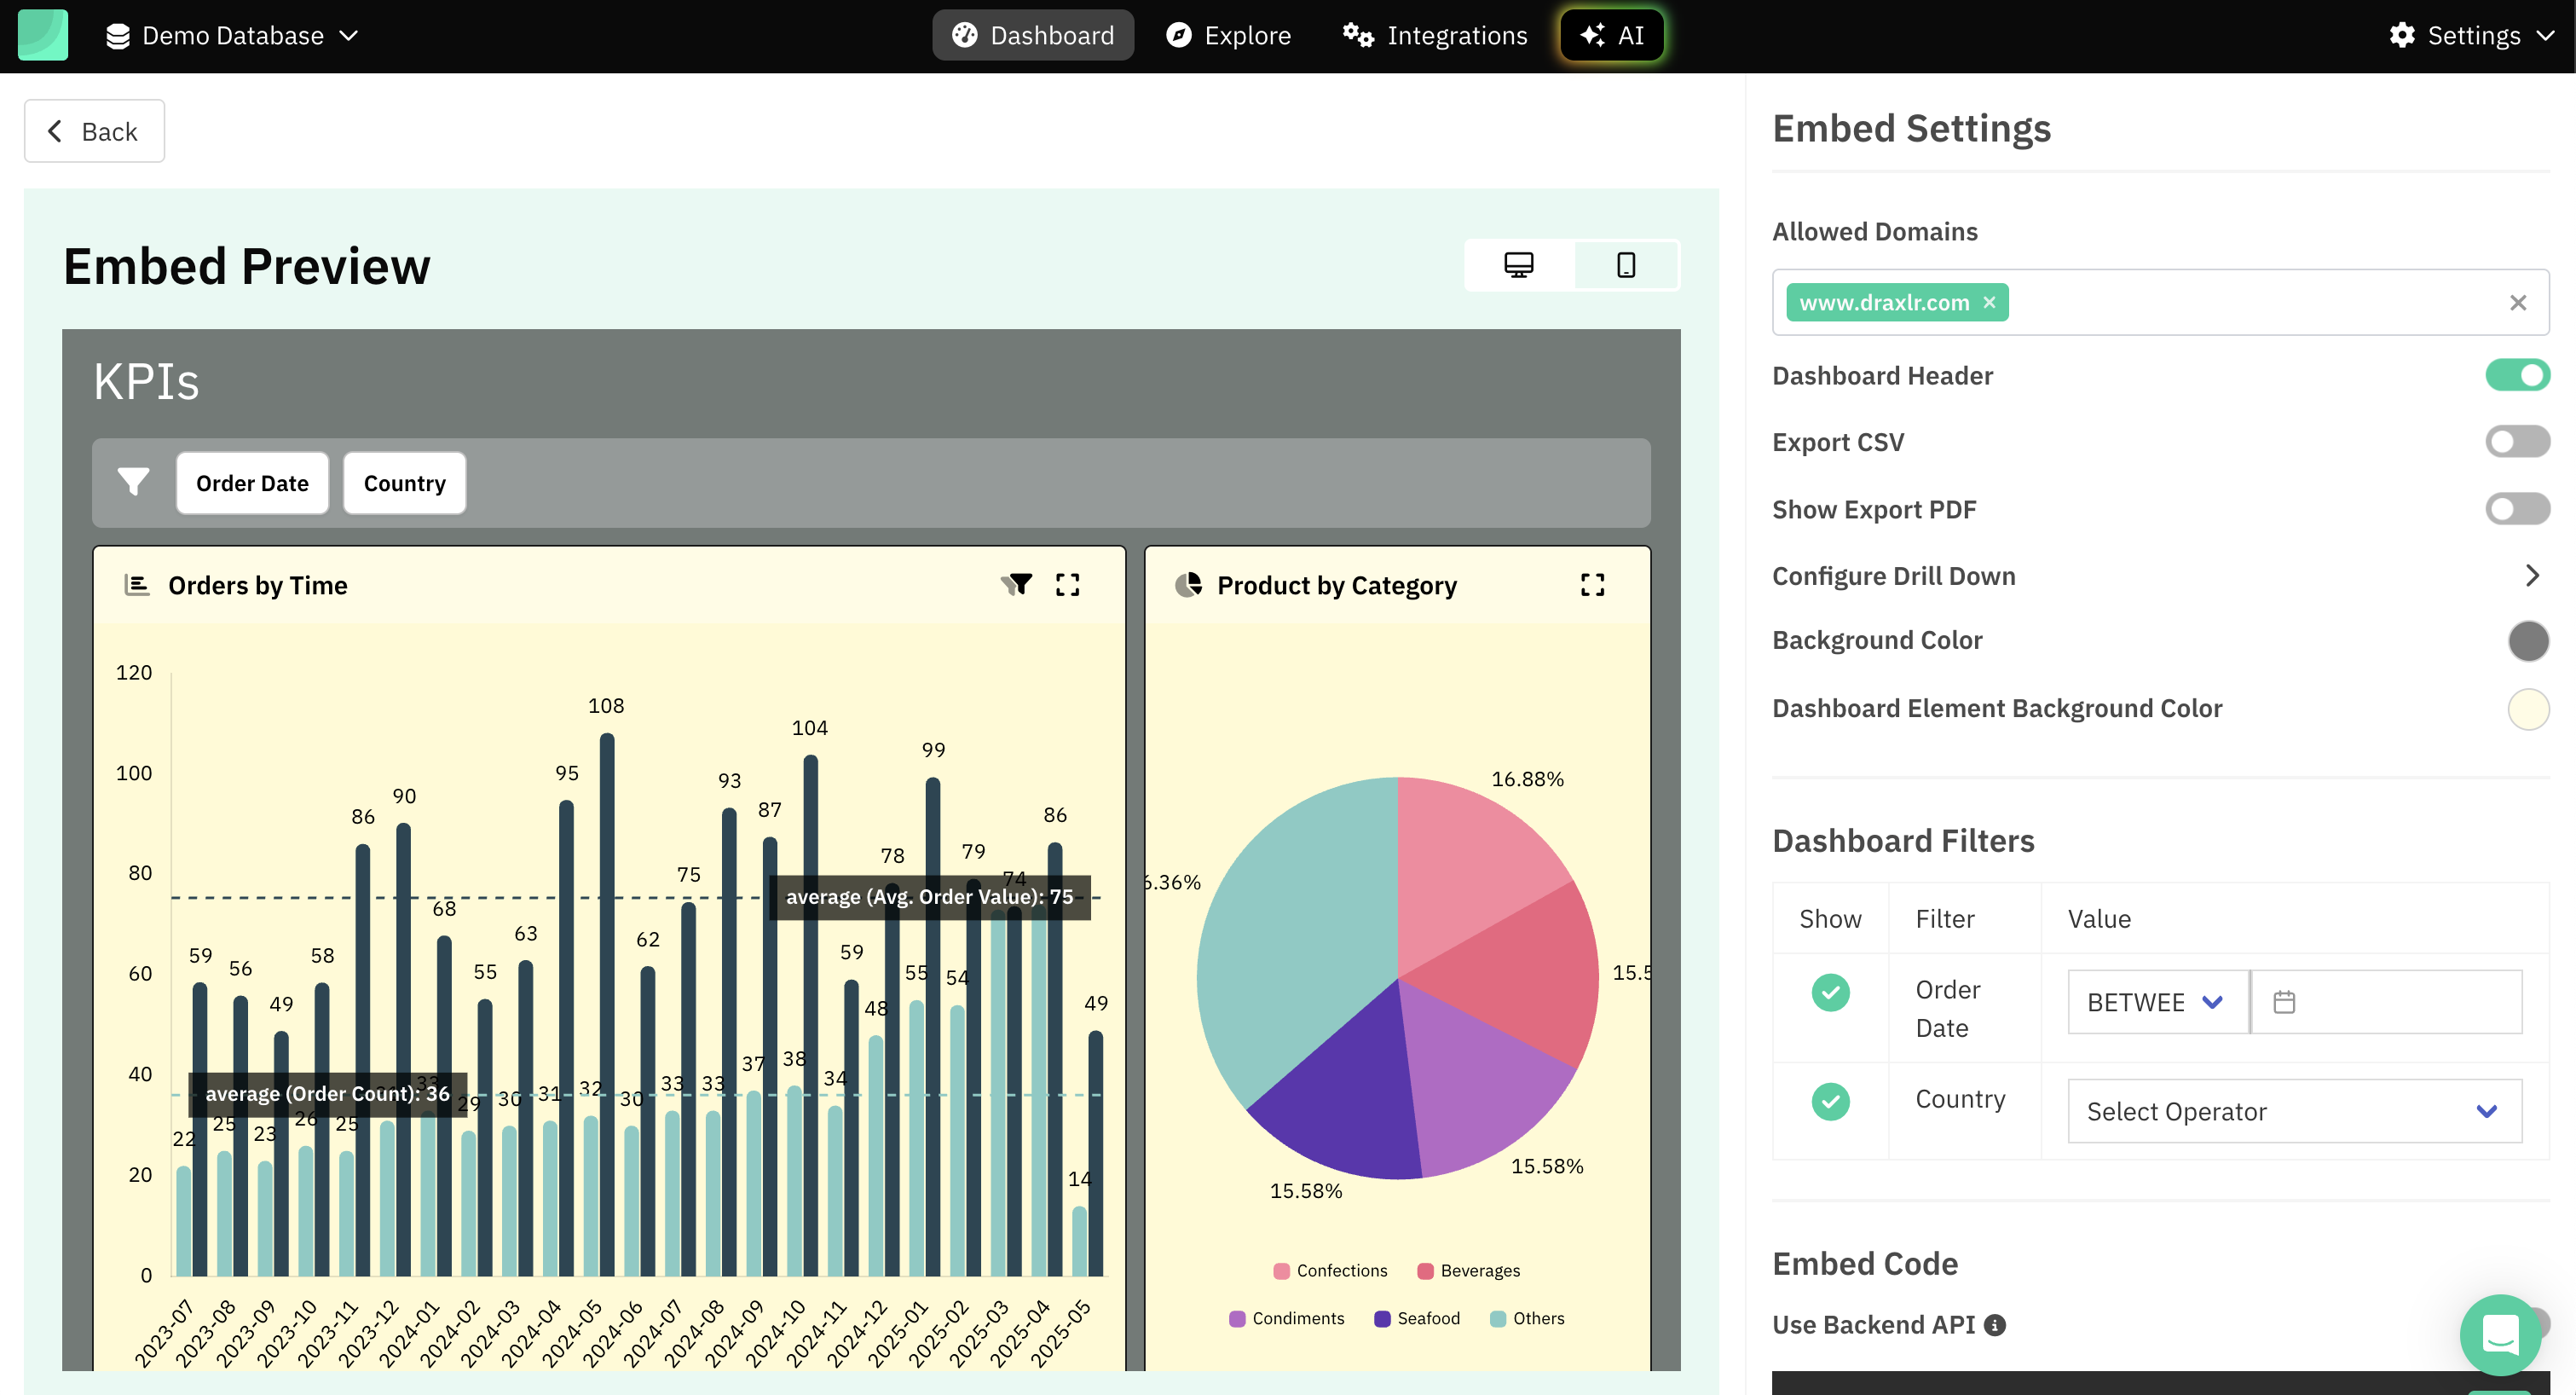
- Copy the iframe code Draxlr gives you and paste it into your web app.
Simple iframe embed - the easiest way to get started. Copy your dashboard’s embed link from Draxlr and drop it into your app. Perfect for internal or shared views.
<div
  id="draxlr-<dashboard-id>"
  class="draxlr-embed"
  data-type="dashboardGroup"
  data-id="<data-id>"
  data-apiKey="<api-key>"
  data-apiSecret="<your-secret>"
  data-width="100%"
  data-minHeight="600px"
  data-maxHeight="1200px"
></div>
<script>
  let dashboard<data-id> = {
    "filters": {
      "67908f7ceb5687ef87d5486a": {
        "hidden": true
      }
    },
    "configuration": {
      "hideHeader": false,
      "showExport": false,
      "showExportPdf": false,
      "backgroundColor": "#ffffff",
      "cardBackgroundColor": null,
      "drillDownFields": {
        "67908f7beb5687ef87d5482f": [
          "CustomerID"
        ]
      },
      "viewData": [],
      "drillThrough": []
    }
  }
  // To re-render the embedded dashboard for cases like embed variable changes,
  // you can call "draxlr.render()"
</script>
<!-- Add this script only once in your code even if you are embedding multiple dashboard items -->
<script src="https://assets.draxlr.com/embed/ap-south/embed-v2.js"></script>
And your dashboard is live inside your app!
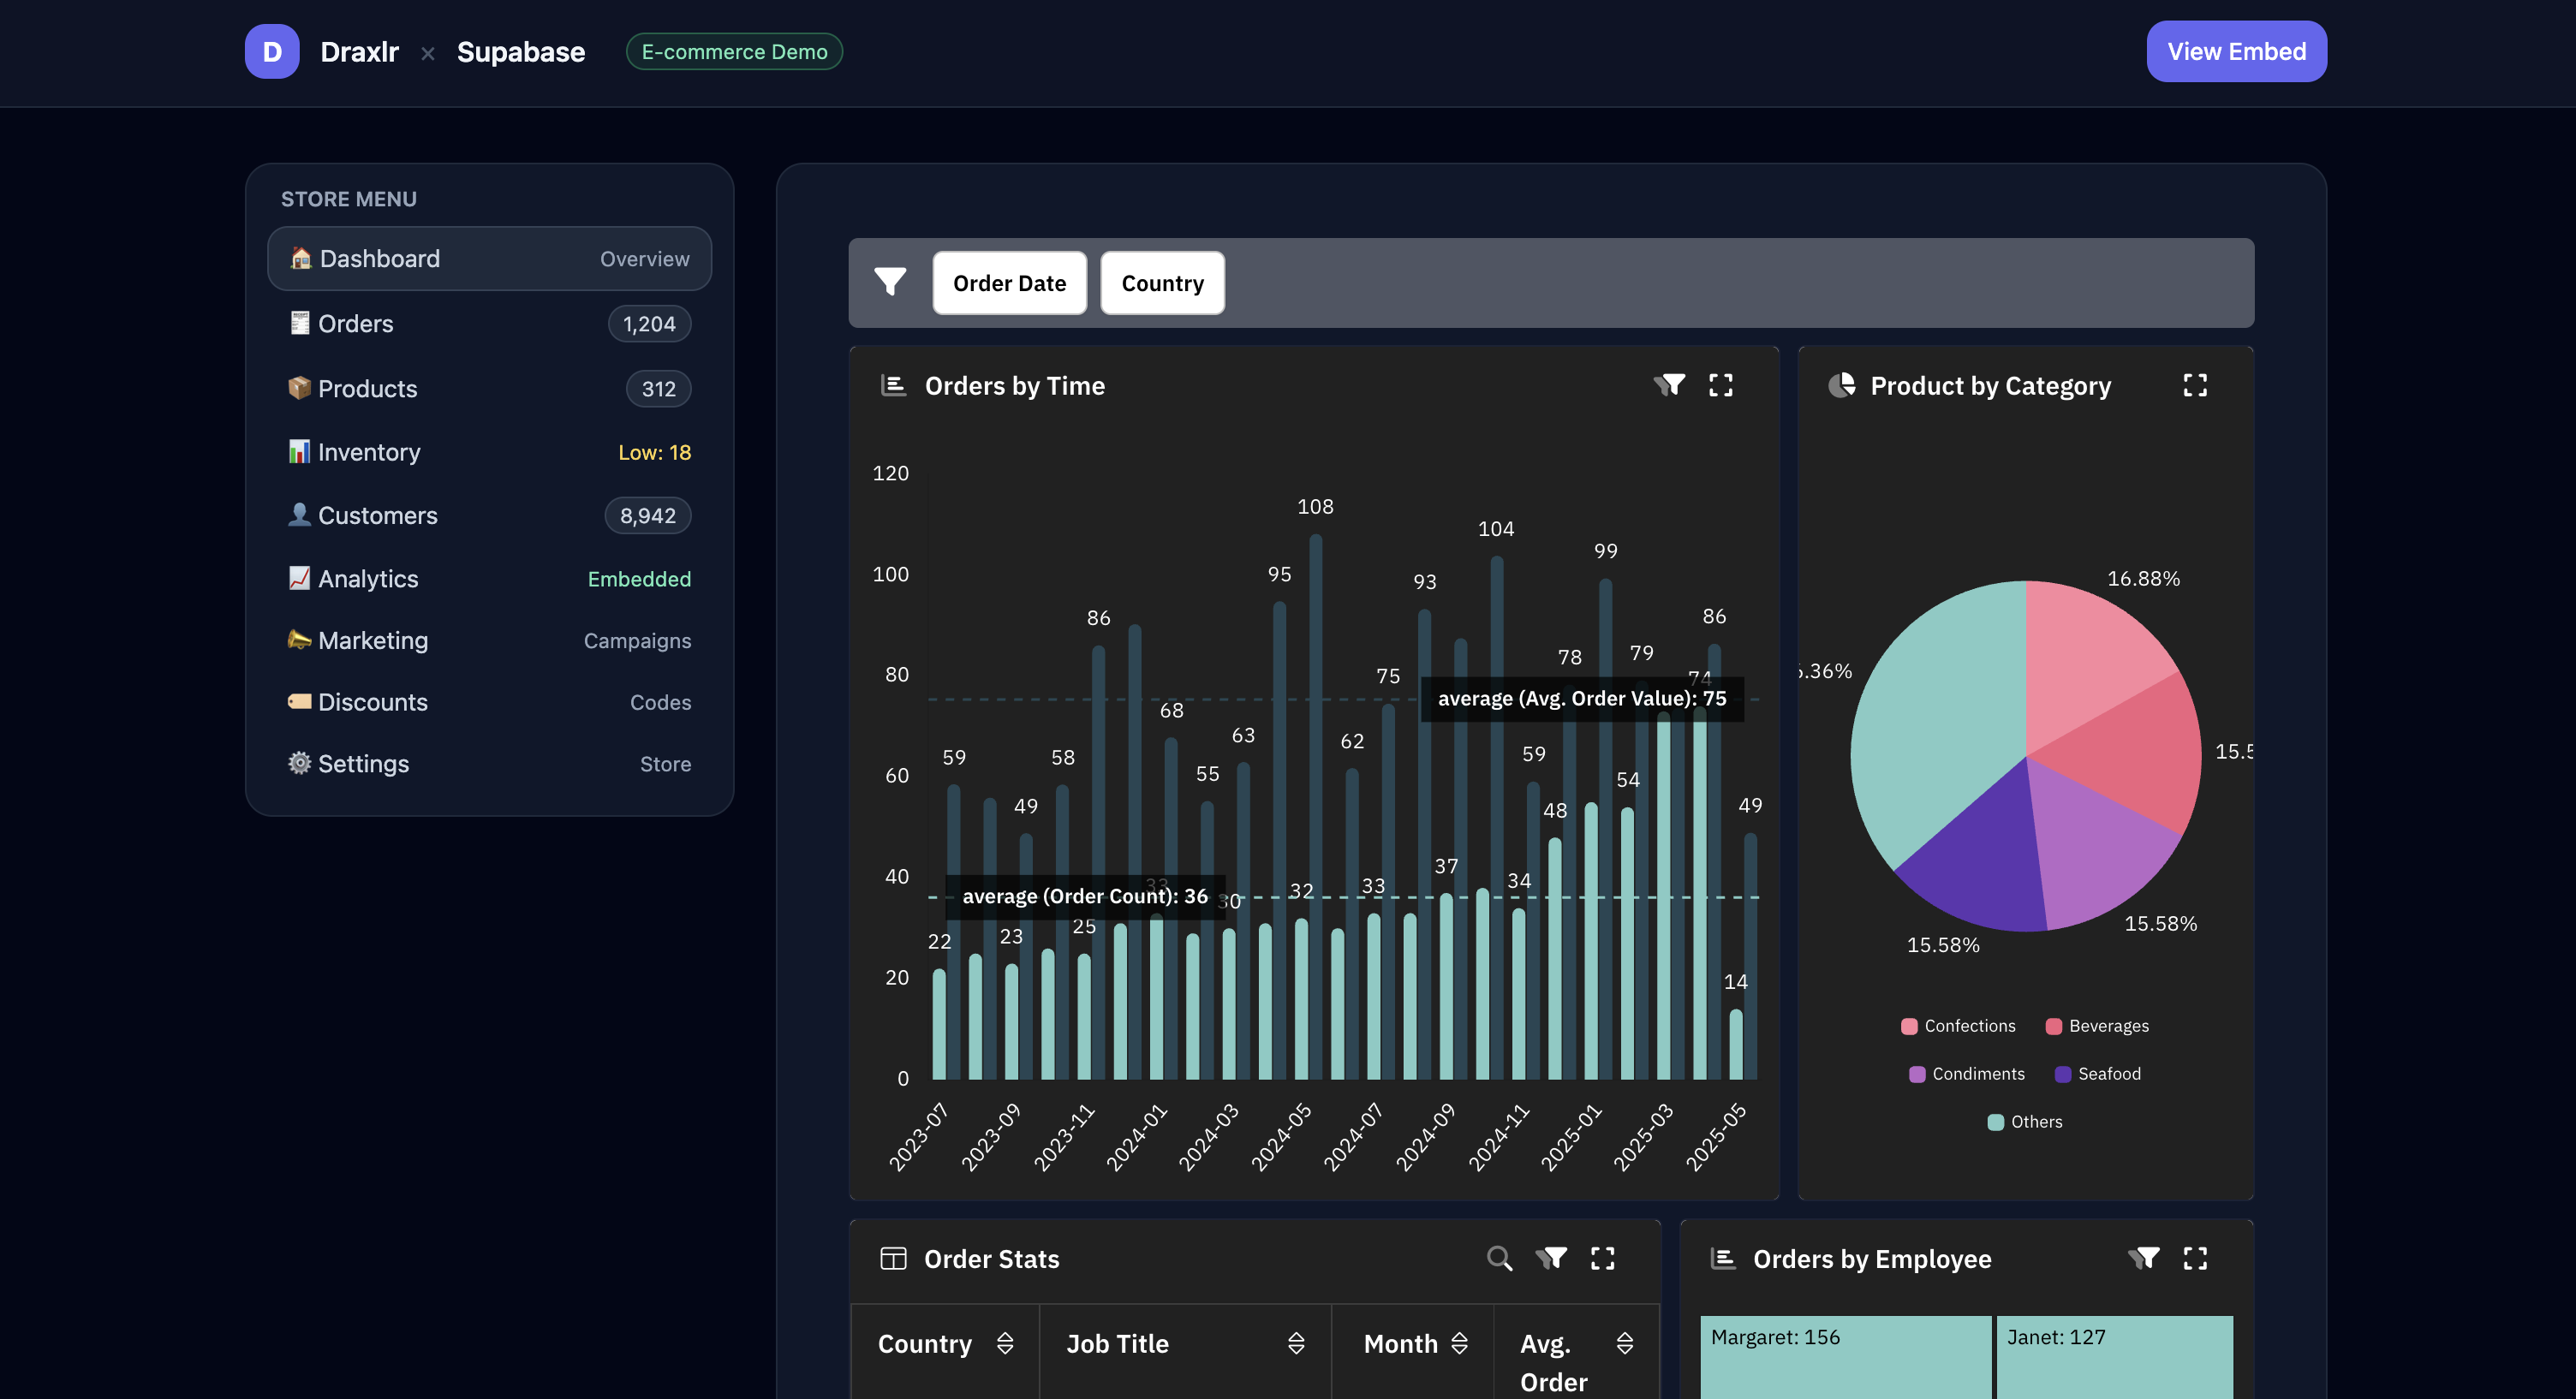
Frontend libraries (React & Vue.js) - If you’re using a modern frontend framework, Draxlr also provides React and Vue.js libraries to make embedding even smoother.
Backend embed API - for secure, customer-specific dashboards, you can generate a token from your backend using Draxlr’s API. This token enables authenticated embedding and can include filters (like customer_id) so each user only sees their own data.
You can know more about embedding dashboards in Draxlr from our documentation.
5. Conclusion
If you’re using Supabase for your backend, you already have all the data your customers care about. With Draxlr, you can finally show it to them - beautifully, securely, and with zero extra dev effort.
Draxlr helps you:
- Build dashboards visually
- Use AI to generate insights
- Embed analytics directly in your SaaS