From Data to Dashboards: Leveraging Snowflake Data with Draxlr
Discover how to transform your Snowflake data into compelling, actionable dashboards with Draxlr. This step-by-step guide covers on how to connect Snowflake to Draxlr to visualize and monitor your data effectively.
In today's data-driven world, the ability to efficiently analyse and visualise data is crucial for making informed decisions. Two powerful tools that stand out in this landscape are Snowflake and Draxlr. In this blog post, we'll dive into how you can connect your Snowflake database to Draxlr, unlocking a new level of data analysis and visualisation capabilities.
Introduction to Snowflake
Snowflake is a cloud-based data warehousing platform that stands out for its incredible scalability, ease of use, and flexibility. It separates compute and storage, allowing businesses to scale up or down as needed without impacting performance. Snowflake supports a multitude of data formats and integrates seamlessly with many BI and analytics tools, making it a popular choice for companies looking to leverage their data.
Why connect Snowflake to Draxlr?
Draxlr is a self-serve business intelligence tool known for its user-friendly interface and powerful data visualisation capabilities. Connecting Snowflake to Draxlr allows you to:
Connect your Database- Leverage Draxlr's Intuitive Interface: Easily create dynamic dashboards and reports without extensive technical knowledge.
- Enhance Data Analysis: Combine Snowflake's robust data warehousing with Draxlr's analytics features for deeper insights.
- Real-time Decision Making: Access and analyse real-time data to make quicker, more informed decisions.
How to Connect Snowflake to Draxlr
Here is a quick video walkthrough of how to connect Snowflake database to Draxlr and build dashboards:
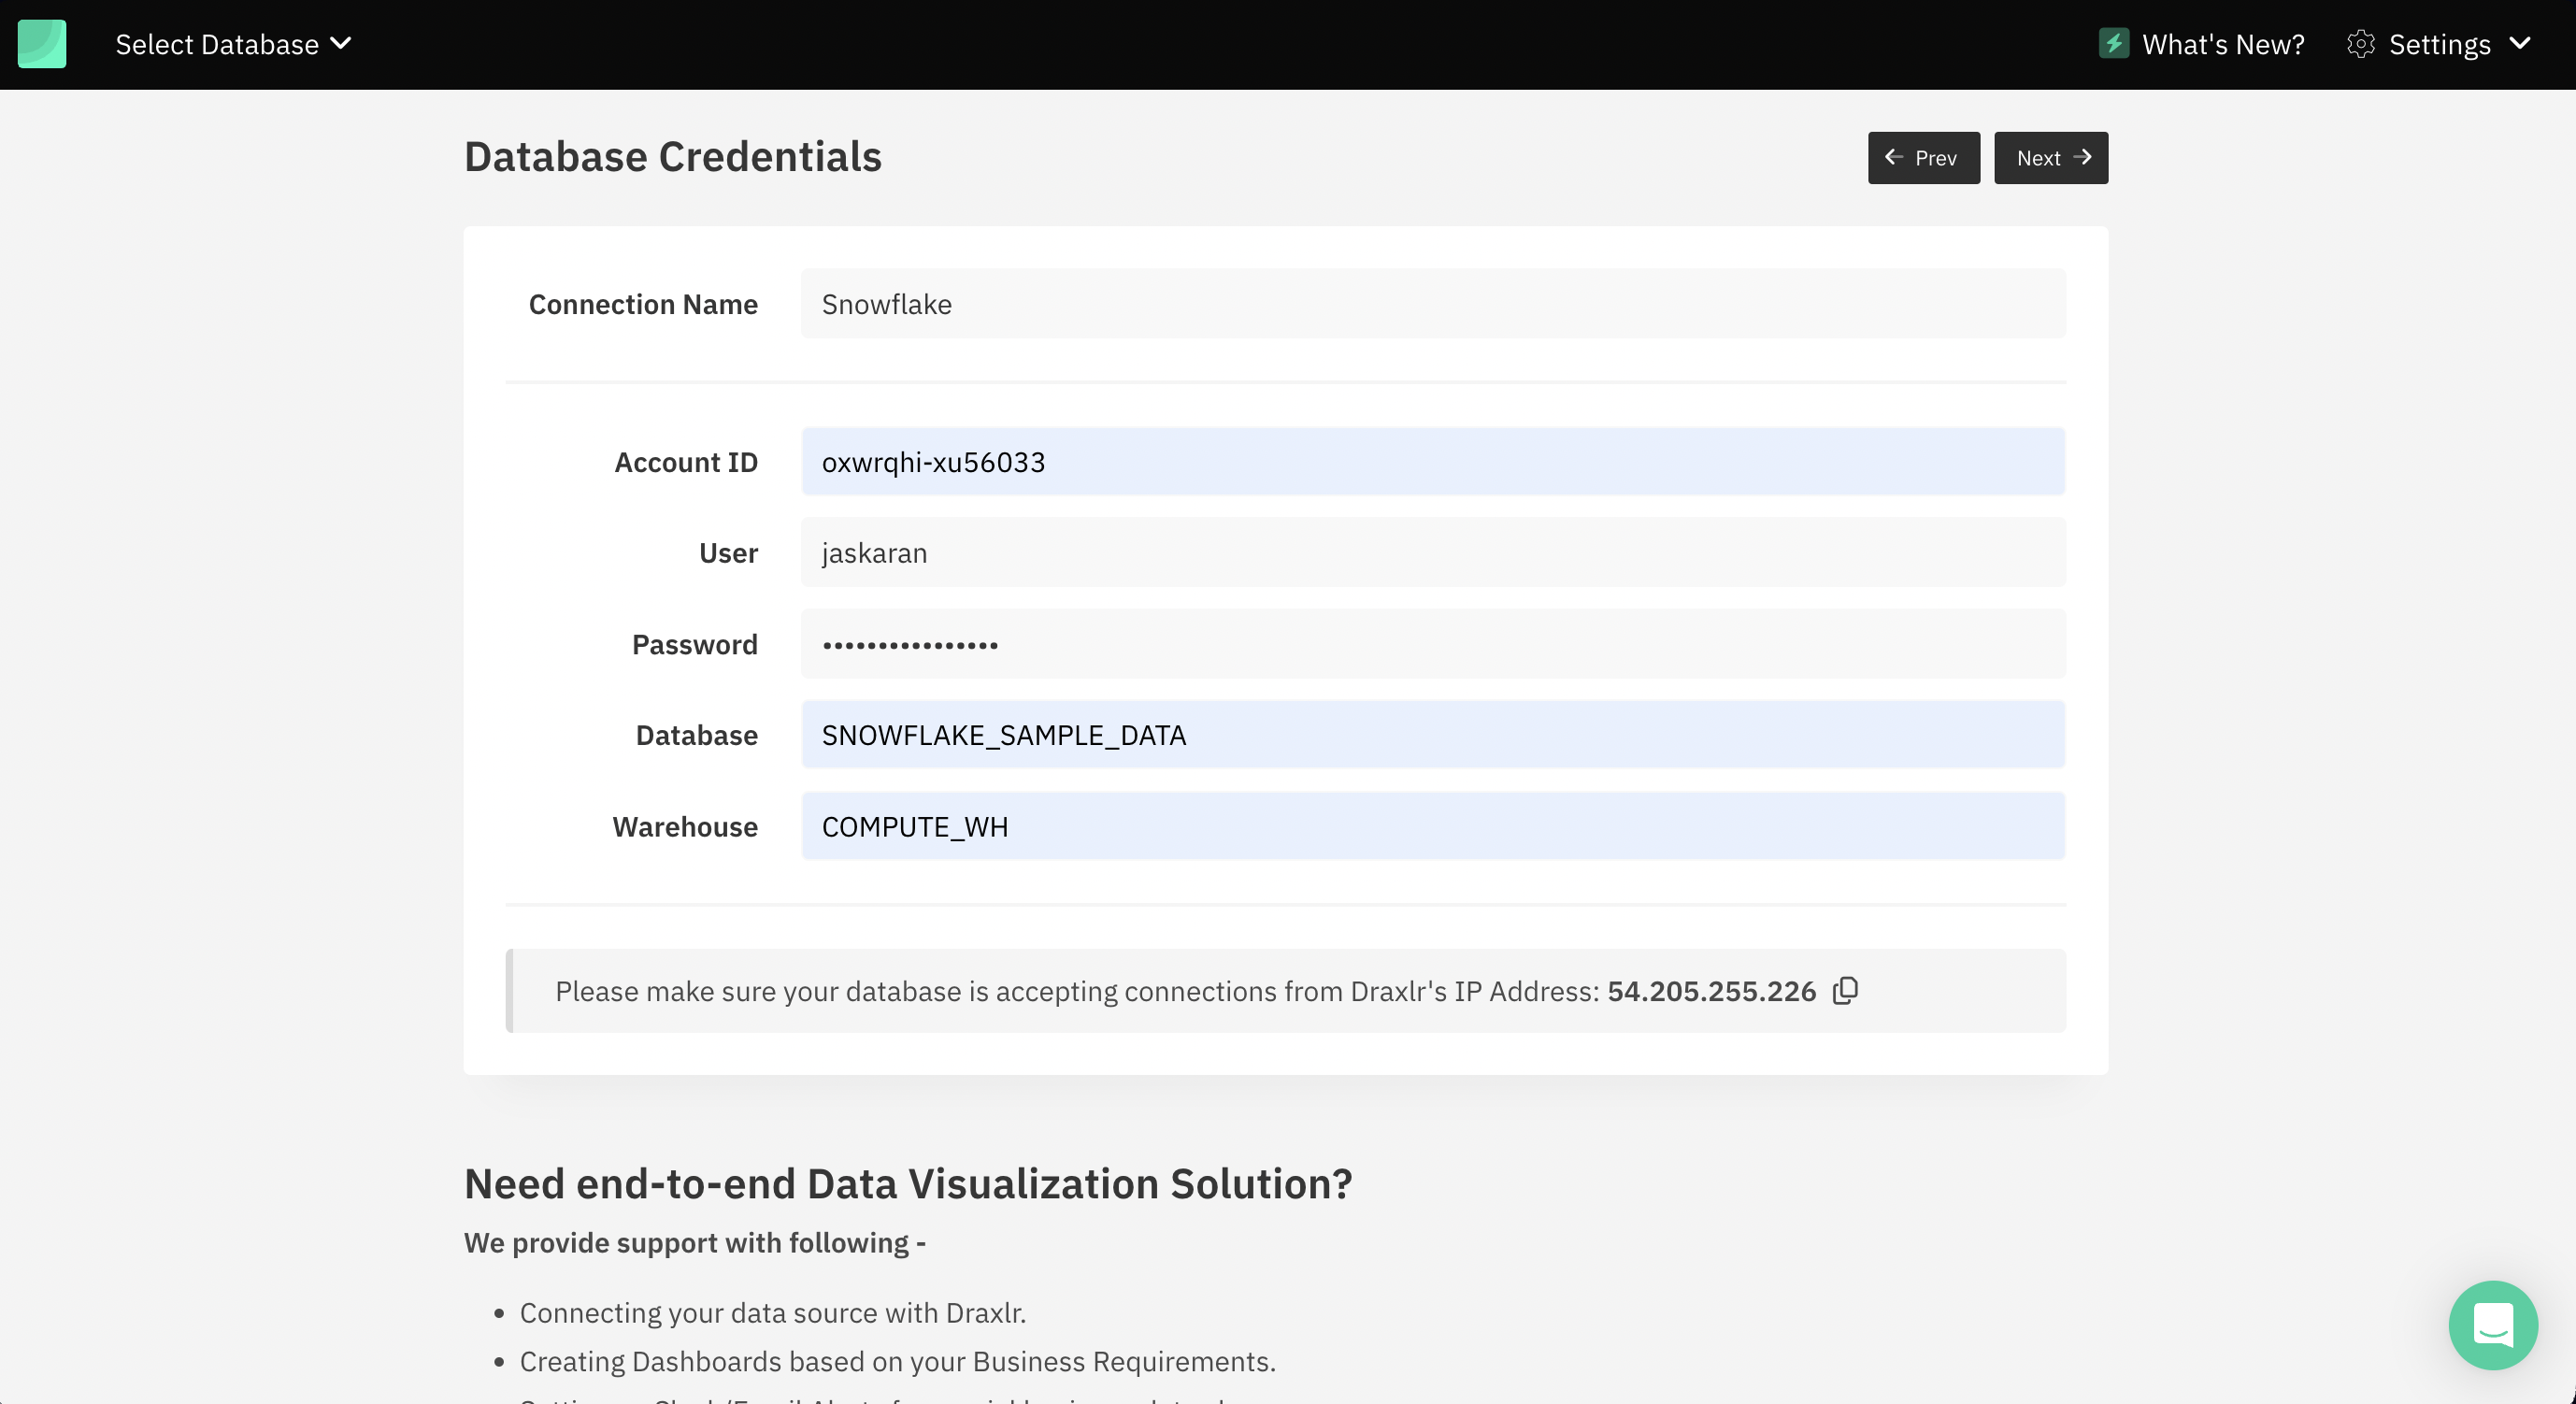
1. Gather Your Snowflake Credentials
Before you begin, ensure you have your Snowflake account details handy, including your account identifier, username, and password. You'll also need to know your Snowflake database's name and warehouse.
2. Connecting Snowflake with Draxlr
- If you’re new to Draxlr, create an account or log in if you already have one.
- If you have a new account, you'll be on the connect database page. If not, click on the Select database > + Connect a Database button on the navbar. Select SnowFlake as the database type and click next.
- Fill in the connection form with your Snowflake database details (Account ID, username, password, database name and warehouse name), then click next.
-
Next, select the database you want to connect to. If you have a single database, it will be selected by default. Click next.
Exploring your data
Once you've successfully linked your Snowflake database with Draxlr, the real fun begins. It's time to unlock the potential of your data through comprehensive exploration and analysis. Here's how you can get started:
-
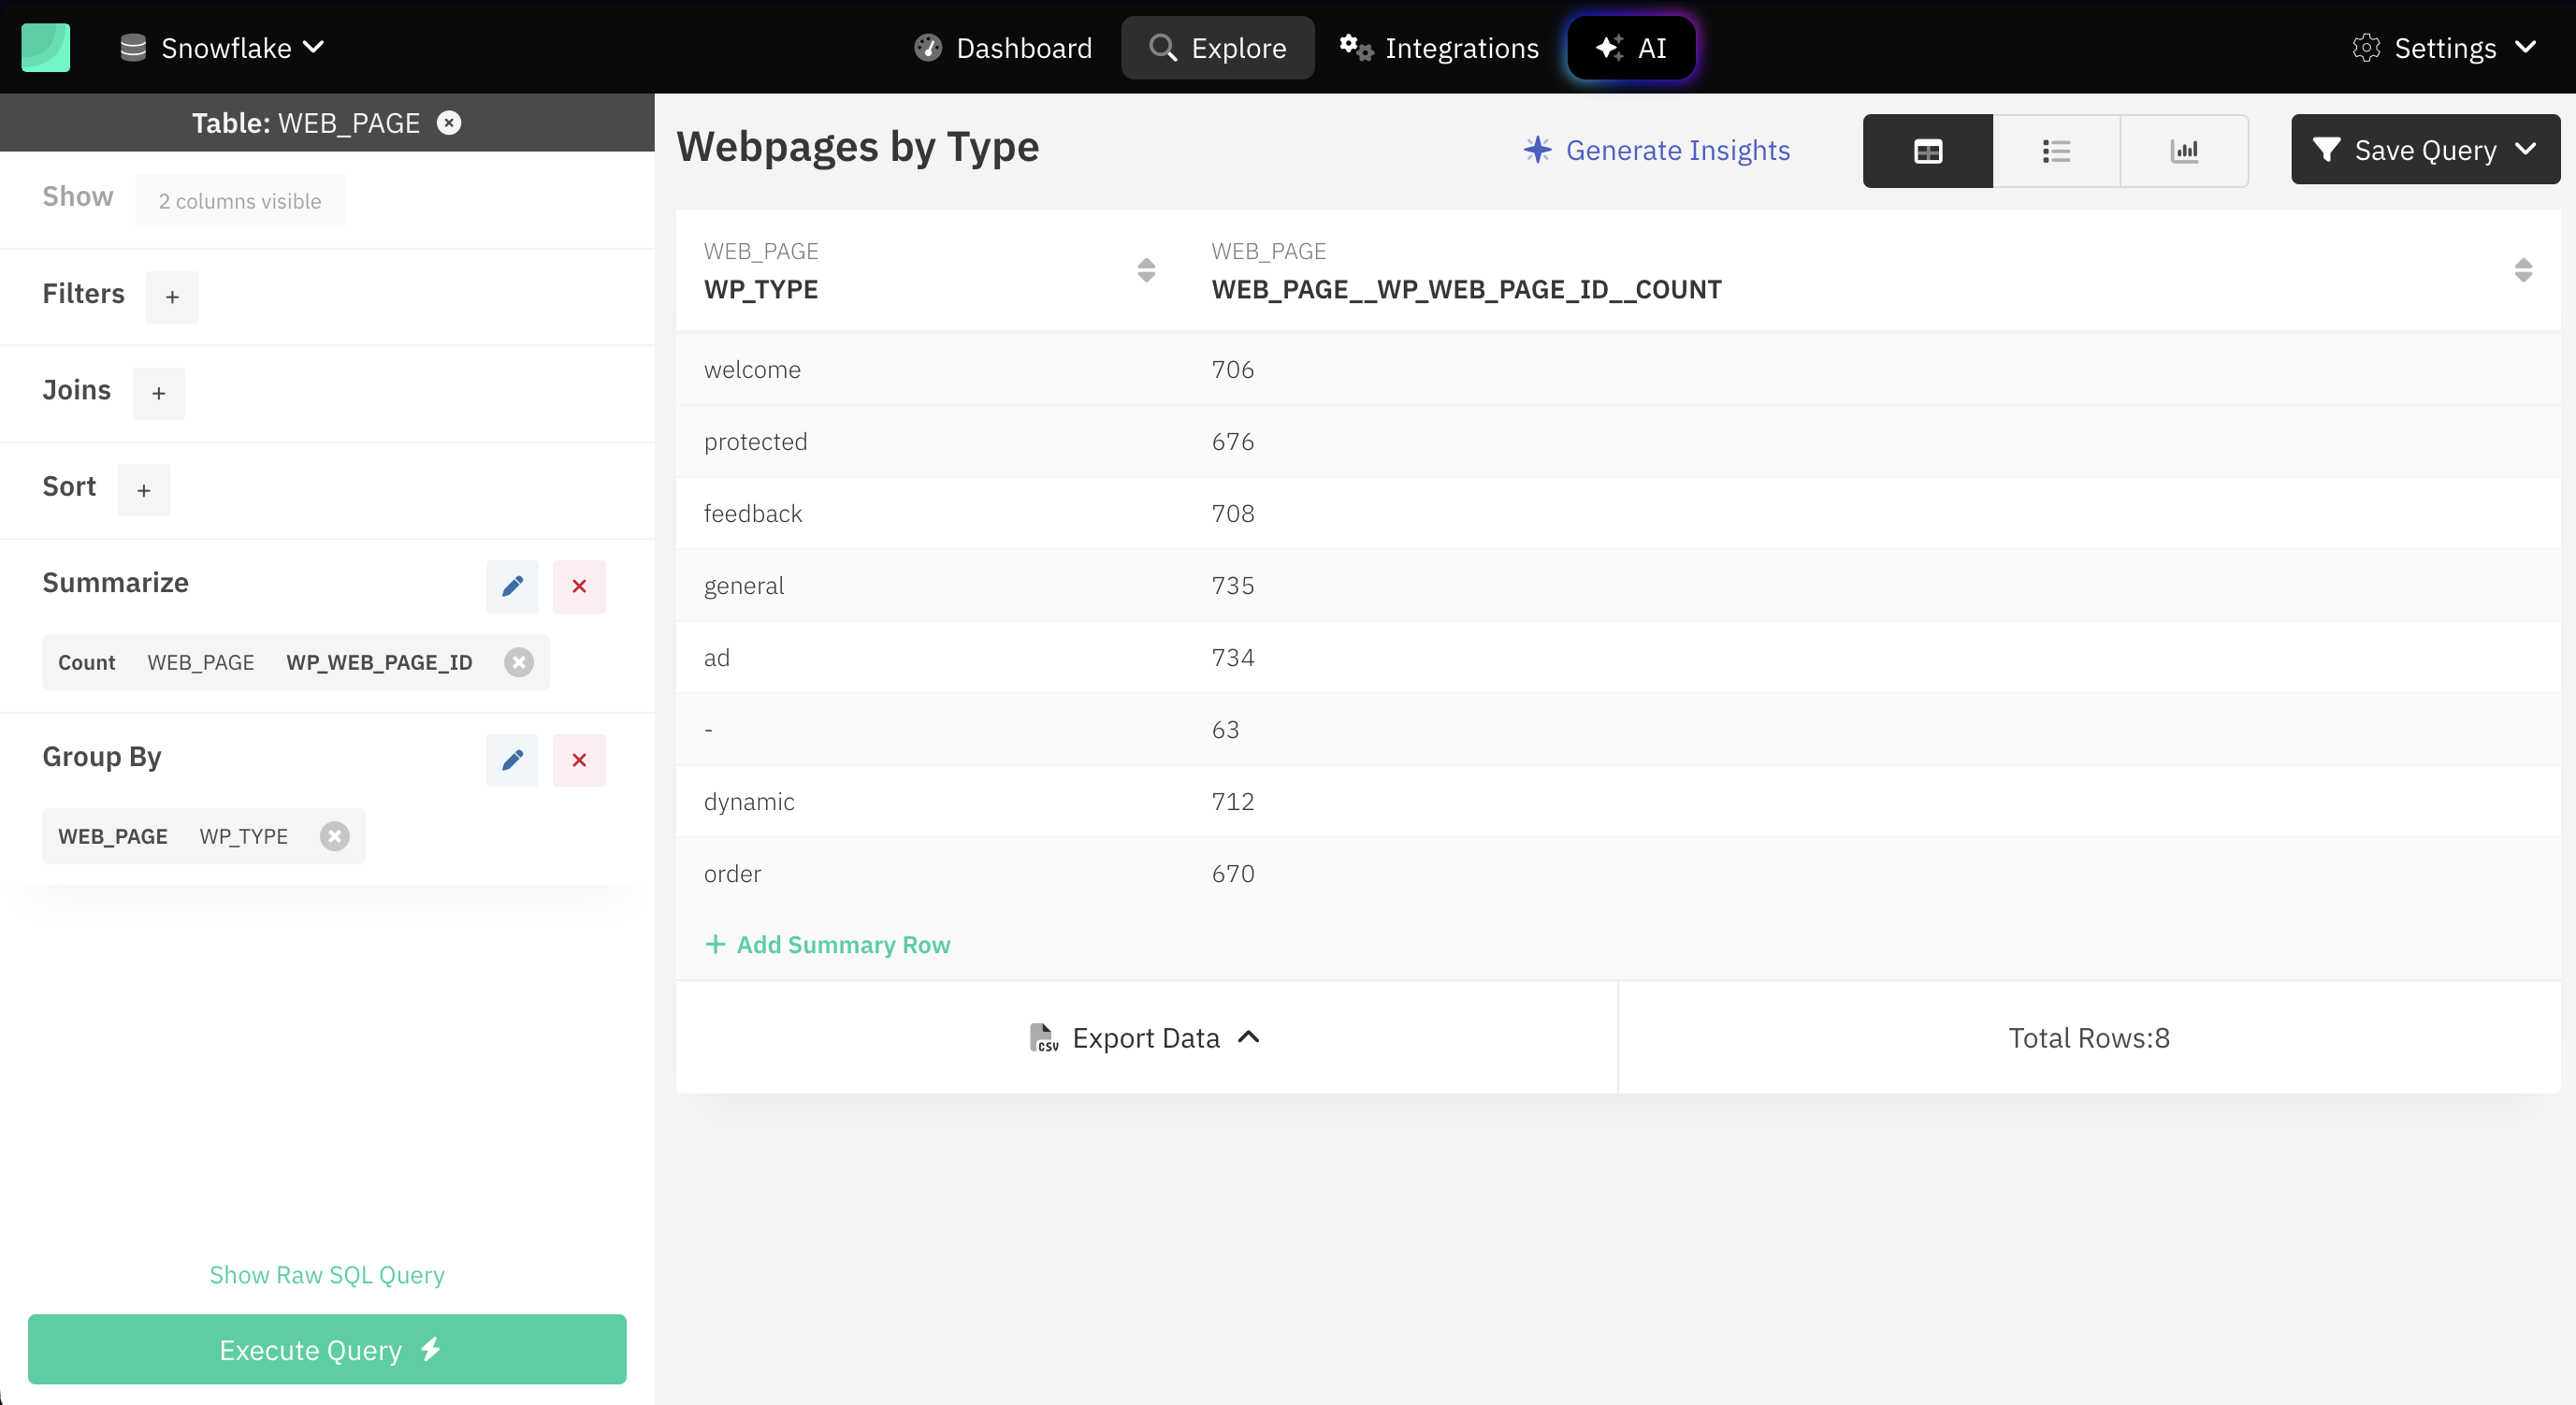
Dive into analytics: Navigate to the Explore section found on the navbar. Start by selecting any table listed on the left-hand side. This action will launch Draxlr's intuitive, no-code query builder. This powerful tool is designed for users of all skill levels, allowing you to filter, group, and aggregate your data effortlessly. Whether you're looking to perform simple data exploration or complex analytical tasks, the query builder is equipped to handle your needs.
-
Embrace the Power of SQL: For those who prefer the granular control and flexibility of SQL, Draxlr has you covered. Click on the raw query button to open up the SQL editor. This is where you can directly write SQL queries to interrogate your data further. Draxlr's SQL editor is enhanced with a built-in autocomplete feature, making it incredibly user-friendly. Whether you're a SQL veteran or a novice, this feature ensures that writing queries is not only efficient but also a surprisingly enjoyable process.
Data Visualisation and Dashboards in Snowflake
Harness the full potential of Draxlr's data visualisation and dashboard capabilities to bring your data to life.
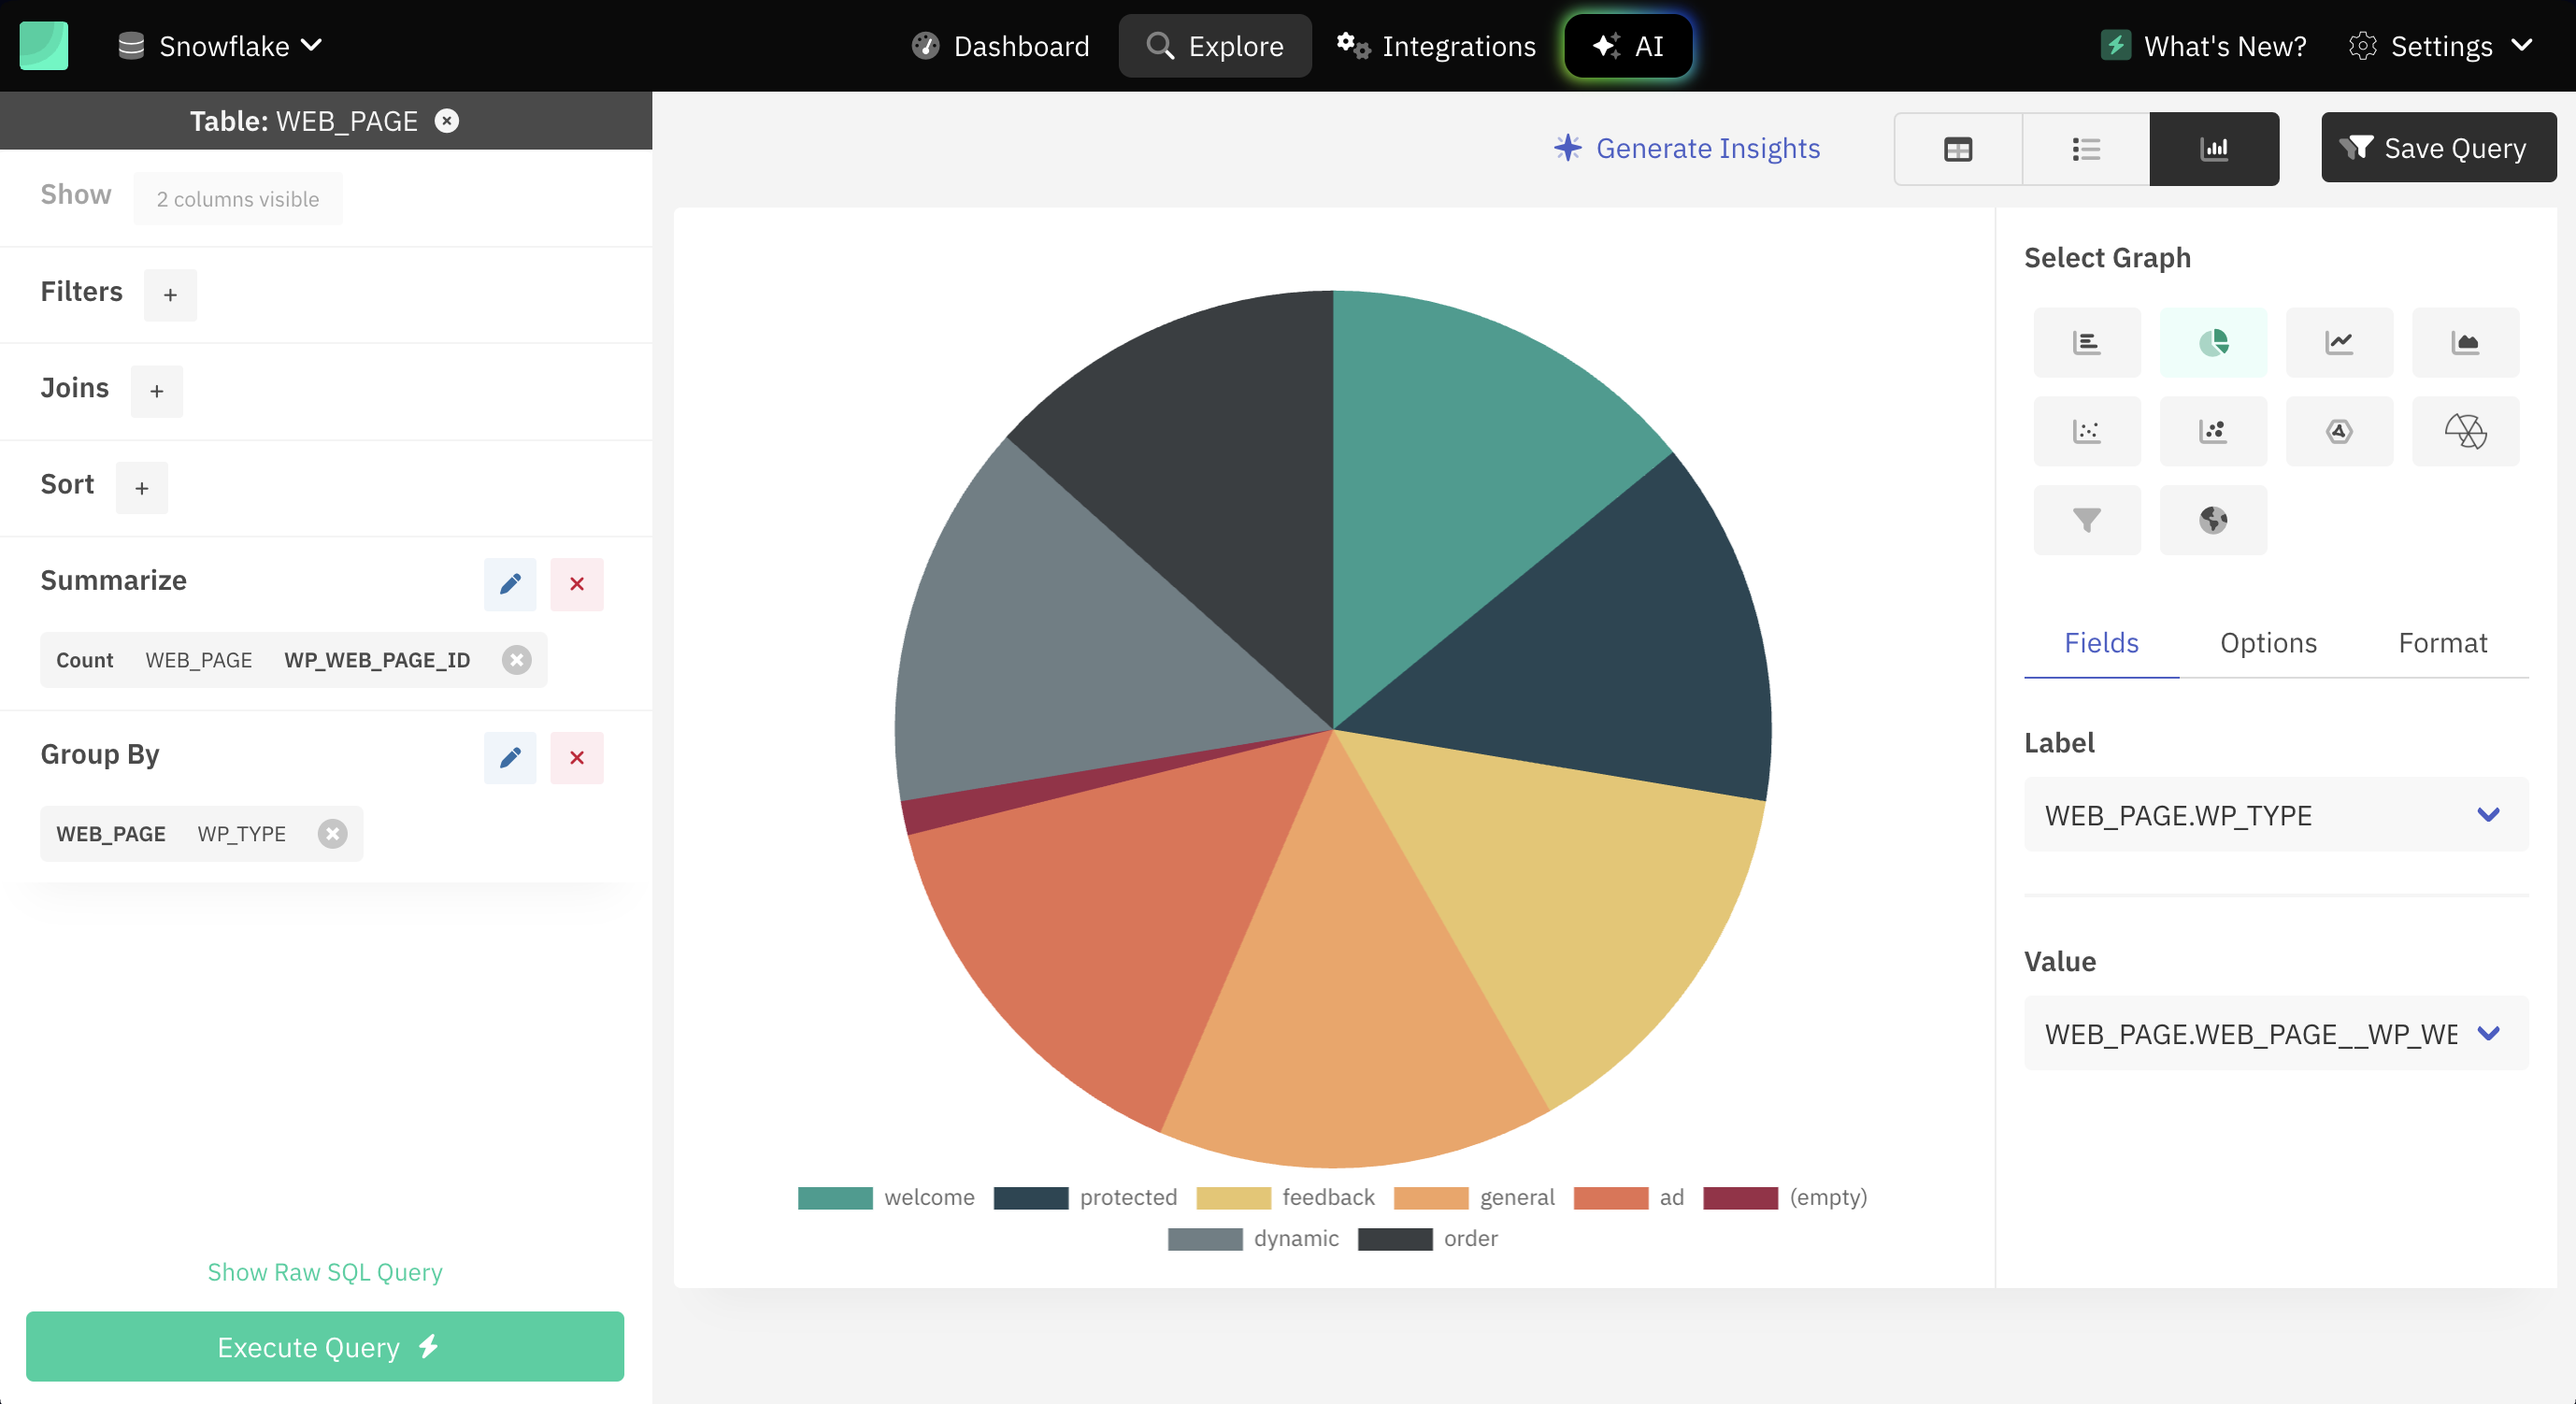
- Once you've obtained the desired results from your data exploration in Snowflake, look for the Graph button to initiate the visualisation process. Snowflake supports an extensive array of visualisation types, from bar charts and line charts to pie charts and more, allowing you to choose the best representation for your data insights.
-
After creating your visualisation, ensure it doesn’t remain a standalone piece. Utilise the Save query option to preserve your query for future reference or modification. Then, take advantage of the Add to Dashboard feature to incorporate your visualisation into a comprehensive dashboard.
Conclusion
Connecting Snowflake to Draxlr opens up a world of possibilities for data analysis and visualization. By following the steps outlined above, you can seamlessly integrate these two powerful tools, enhancing your ability to make data-driven decisions and gain deeper insights into your business. Embrace the power of Snowflake and Draxlr to transform your data into actionable intelligence.
- Jaskaran Singh