AI SQL Tool: What it is and How to Build Dashboards from Plain-English Questions
Use Draxlr’s AI SQL tool to turn plain English into powerful SQL queries, build dashboards instantly, and get insights without writing a single line of code.

The AI SQL tool is changing how teams access data.
Yet, writing SQL still feels intimidating for many. Not everyone on your team can run a "SELECT * FROM" confidently. But they do have questions about the data. "Which campaign got us the most users?" "What’s our revenue in Europe?"
These questions often sit in Slack threads or email drafts, waiting on someone with SQL expertise.
That’s where AI SQL tools come in.
In this guide, you’ll learn exactly how AI SQL tools work, why they matter, and how Draxlr makes querying, charting, and dashboard building as easy as asking a question.
What is an AI SQL tool?
An AI SQL Tool is software that turns plain English into working SQL queries. It removes the need for manual SQL writing and opens access to data for all roles across the company. Think of it as a translator between humans and databases.
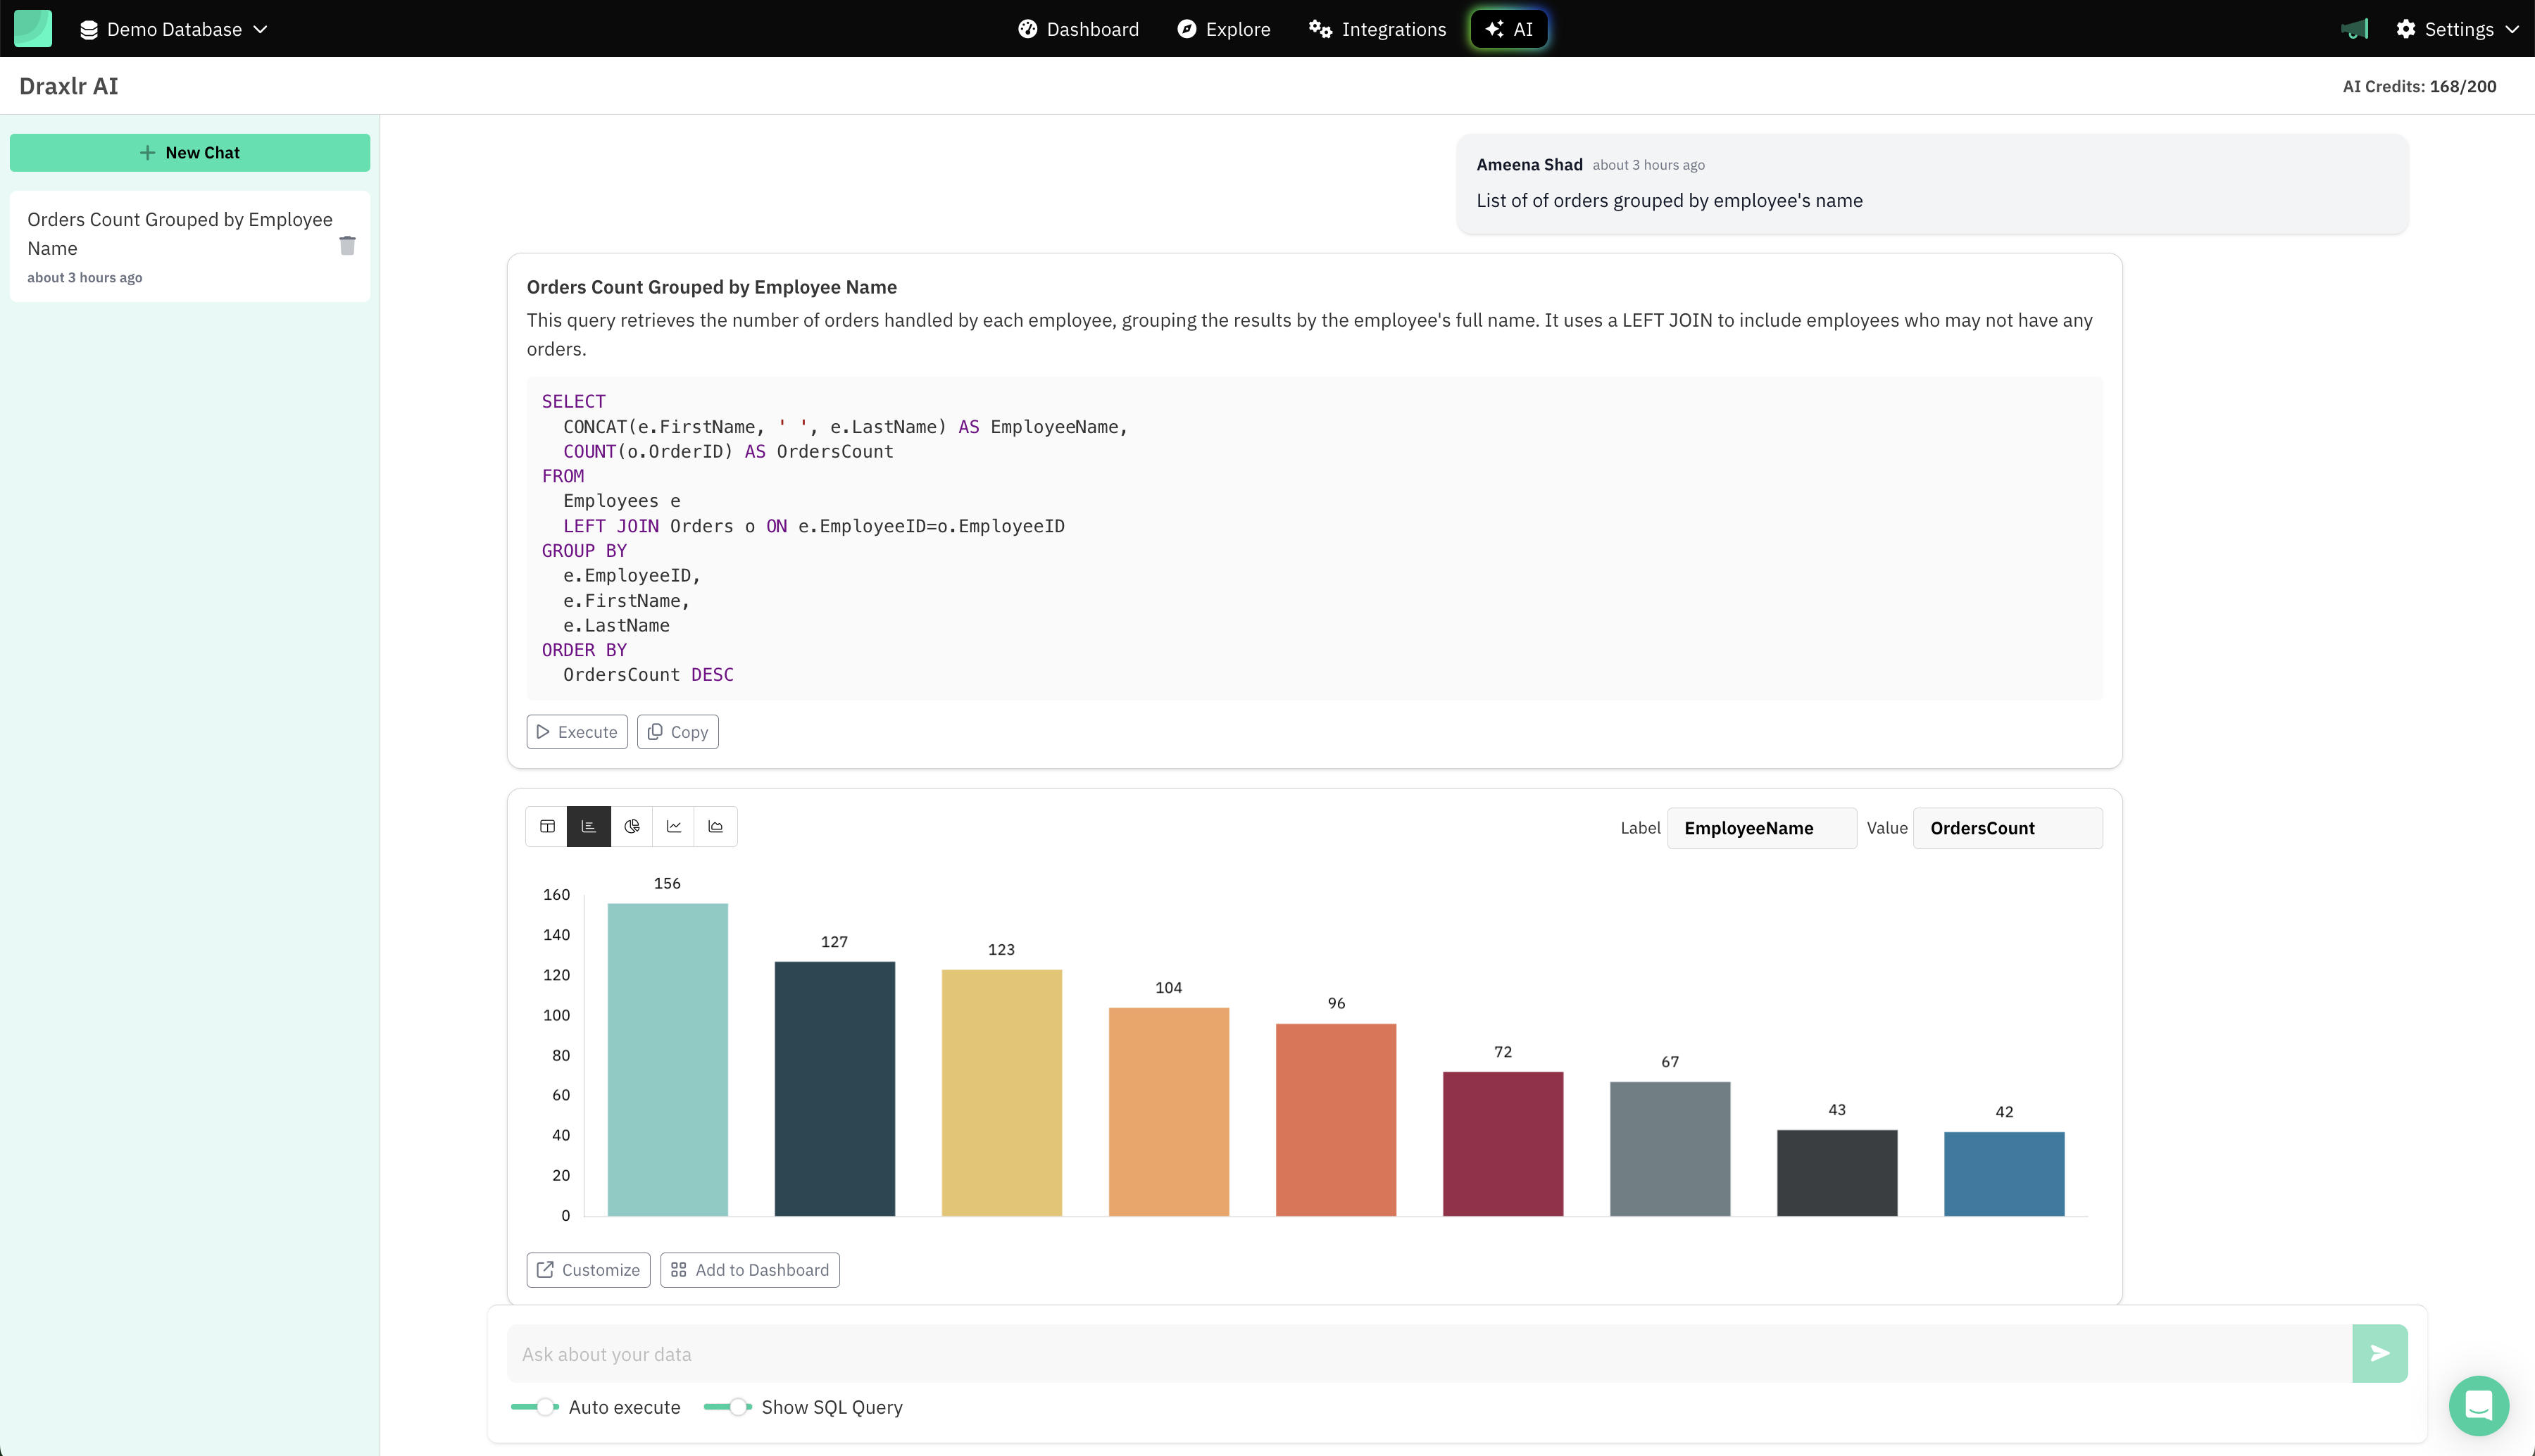
Using it feels like chatting with your database, just like you would with ChatGPT. You ask a question, the AI understands your intent, and gives you a ready-to-use SQL query along with a clear visual result.
You type "List of orders grouped by employee's name" and get an SQL query and visualization.
Who Uses the AI SQL Tool?
The AI SQL Tool meets people where they are, making data instantly usable for different roles across the company.
- Founders: Track feature adoption, product usage, and growth trends without relying on an analyst.
- Product Managers: Get real-time answers about user behavior, funnel drop-offs, and feature engagement using plain English.
- Marketers: Analyze campaign performance, channel ROI, and regional impact without sifting through complex spreadsheets.
- Executives: Ask high-level questions about revenue, churn, or monthly active users and get visual answers you can act on.
If you ask questions and care about data-driven decisions, AI SQL Tool is built for you.
How an AI SQL Tool Benefits Your Team
When evaluating an AI SQL tool, it's essential to understand exactly how it improves your daily workflow and contributes to your team's productivity.
1. Simplicity and ease of use
A great AI SQL tool removes complexity completely. It lets anyone on your team, no matter their technical expertise, ask data questions naturally. Evaluate this carefully:
- Can your marketing manager easily get insights from your database without relying on a data analyst?
2. Speed of decision-making
Data-driven organizations must move fast. Every minute spent waiting for a query to run or waiting on another team to help is a minute lost. Consider:
- Does the tool give your team answers in seconds, helping you respond quickly during meetings, launches, or customer conversations?
3. Accuracy and trust in data
Data decisions are only valuable if the underlying data is accurate. Verify:
- Does the tool consistently provide accurate, error-free queries, building confidence rather than doubt?
4. Actionable insights, not just raw queries
An effective AI SQL tool should do more than just write queries. It should deliver visual, actionable insights ready to integrate into your workflows. Confirm:
- Can you instantly create dashboards, schedule automated reports, or embed analytics directly into your business tools?
How to build dashboards using Draxlr’s AI SQL tool
With Draxlr, you type your question in plain English. The tool generates the SQL, runs the query on your database, and shows the result as a visualization. The entire process takes minutes and requires no coding. Here’s how it works:
1. Connect your database
Begin by securely connecting your SQL database to Draxlr. It supports popular databases like PostgreSQL, MySQL, MSSQL, Databricks, and more. Instead of syncing or storing your data, Draxlr only reads the schema, which is the structure of your data, including table names, columns, and how they relate to each other.
2. Ask a question in plain English
Once your database is connected, or if you choose to use Draxlr’s demo data, you can begin asking questions immediately.
For example, with the demo database, you can try
- "Show me total revenue by country for the last three months."
- "Give me all the products by category."
Draxlr AI understands your question in plain English and converts it into an SQL query that works with your actual schema. You do not need to know the structure of your tables or the exact column names.
3. Get SQL and visualizations that match your query result.
After you ask a question, Draxlr analyzes it and generates an SQL query that matches your database structure. The SQL is built with full awareness of your table names, column naming patterns, and how your data is connected.
This includes:
- Joins across related tables
- Filters for date ranges, categories, or custom conditions
- Grouping and aggregations based on the intent of your question
You can choose to view or hide the generated SQL. Along with the query, Draxlr also returns visual representations of the result. Whether the data fits a bar chart, pie chart, time series, or table, Draxlr suggests chart types that best match the output. There is no need to configure anything manually.
4. Build and Organize Dashboards
After a visualization is generated, users will primarily see two buttons below the result.
The first is Add to Dashboard, which adds the current visualization to a selected dashboard. Users can choose from existing dashboards, making it easy to organize and build views over time.
The second is Customize, which takes users to Draxlr’s raw query builder. This is where deeper changes can be made to the visualization, such as enabling or disabling grid lines, formatting number values, adding a trend line, and adjusting other more visual settings.
5. Share, Automate, and Embed
Once your dashboard is ready, Draxlr offers several ways to bring it into your team’s workflow:
- Schedule updates to be delivered via Slack or email at regular intervals or specific times, so your team stays informed without checking manually.
- Share a live dashboard link with anyone by setting a PIN, giving external stakeholders access without requiring login.
- Embed dashboards into your internal tools, portals, or web apps, so insights appear where your team already works.
Final Thoughts
Most teams don't lack data, they lack a fast, reliable way to use it. Draxlr’s AI SQL tool removes the need to write queries, build charts manually, or depend on analysts for answers.
It’s not just a shortcut. It’s a shift in how teams interact with their databases, turning plain-English questions into live dashboards, instantly and accurately.
If your team is spending more time asking for data than acting on it, it’s time to try a better way.
FAQs
1. Is there an AI for SQL?
Yes. AI SQL tools let you ask questions in plain English and get valid SQL queries in return. Tools like Draxlr generate queries based on your database schema, so you don’t need to write SQL manually.
2. Can AI create dashboards?
Yes. AI tools like Draxlr can create dashboards by generating queries from plain English and organizing the results into charts. You can save these charts, arrange them into dashboards, and schedule reports—without writing SQL or configuring visuals manually.
3. What is the best AI SQL tool?
The best AI SQL tool depends on your team’s needs, but top tools help you write queries in plain English, understand your database schema, and generate visual dashboards instantly. Draxlr stands out by combining accurate SQL generation with schema awareness, chart suggestions, and live database connectivity—making it a strong choice for teams that want speed without sacrificing control.