Explore 6 Metabase Alternatives for Data Visualization and Analysis
Compare 6 best self-service Metabase alternatives for non-tech teams to get business intelligence insights. Key features, pricing, and major drawbacks.

Did Metabase not live up to your expectations? Or are you just unsure about whether to stick with it or explore other options?
Metabase is surely a very popular business intelligence tool, celebrated for its open-source flexibility. But even the most popular tools don’t always fit the bill for every business.
With so many BI tools available, choosing the right one for your business can be challenging, so, to simplify your search, we've curated a list of the top 7 Metabase alternatives.
Best 6 Metabase alternatives at a glance
| Metabase alternative | What we like | Starting price |
|---|---|---|
| Draxlr | Generate SQL with AI, Simple to use, Affordable, Great support | $120/month(flat price) |
| Tableau | Mature BI tool, Strong community | $15/user/month |
| Domo | Easy integrations, Intuitive | Contact Sales |
| Power BI | Seamless integration with Microsoft products | $10/user/month |
| Looker | Centralized, reusable data models with LookML | $2000/month |
| Holistics | Integration with modern data stack tools like dbt and GitHub | $180/month |
Here is a quick video showcasing these Metabase alternatives:
1. Draxlr
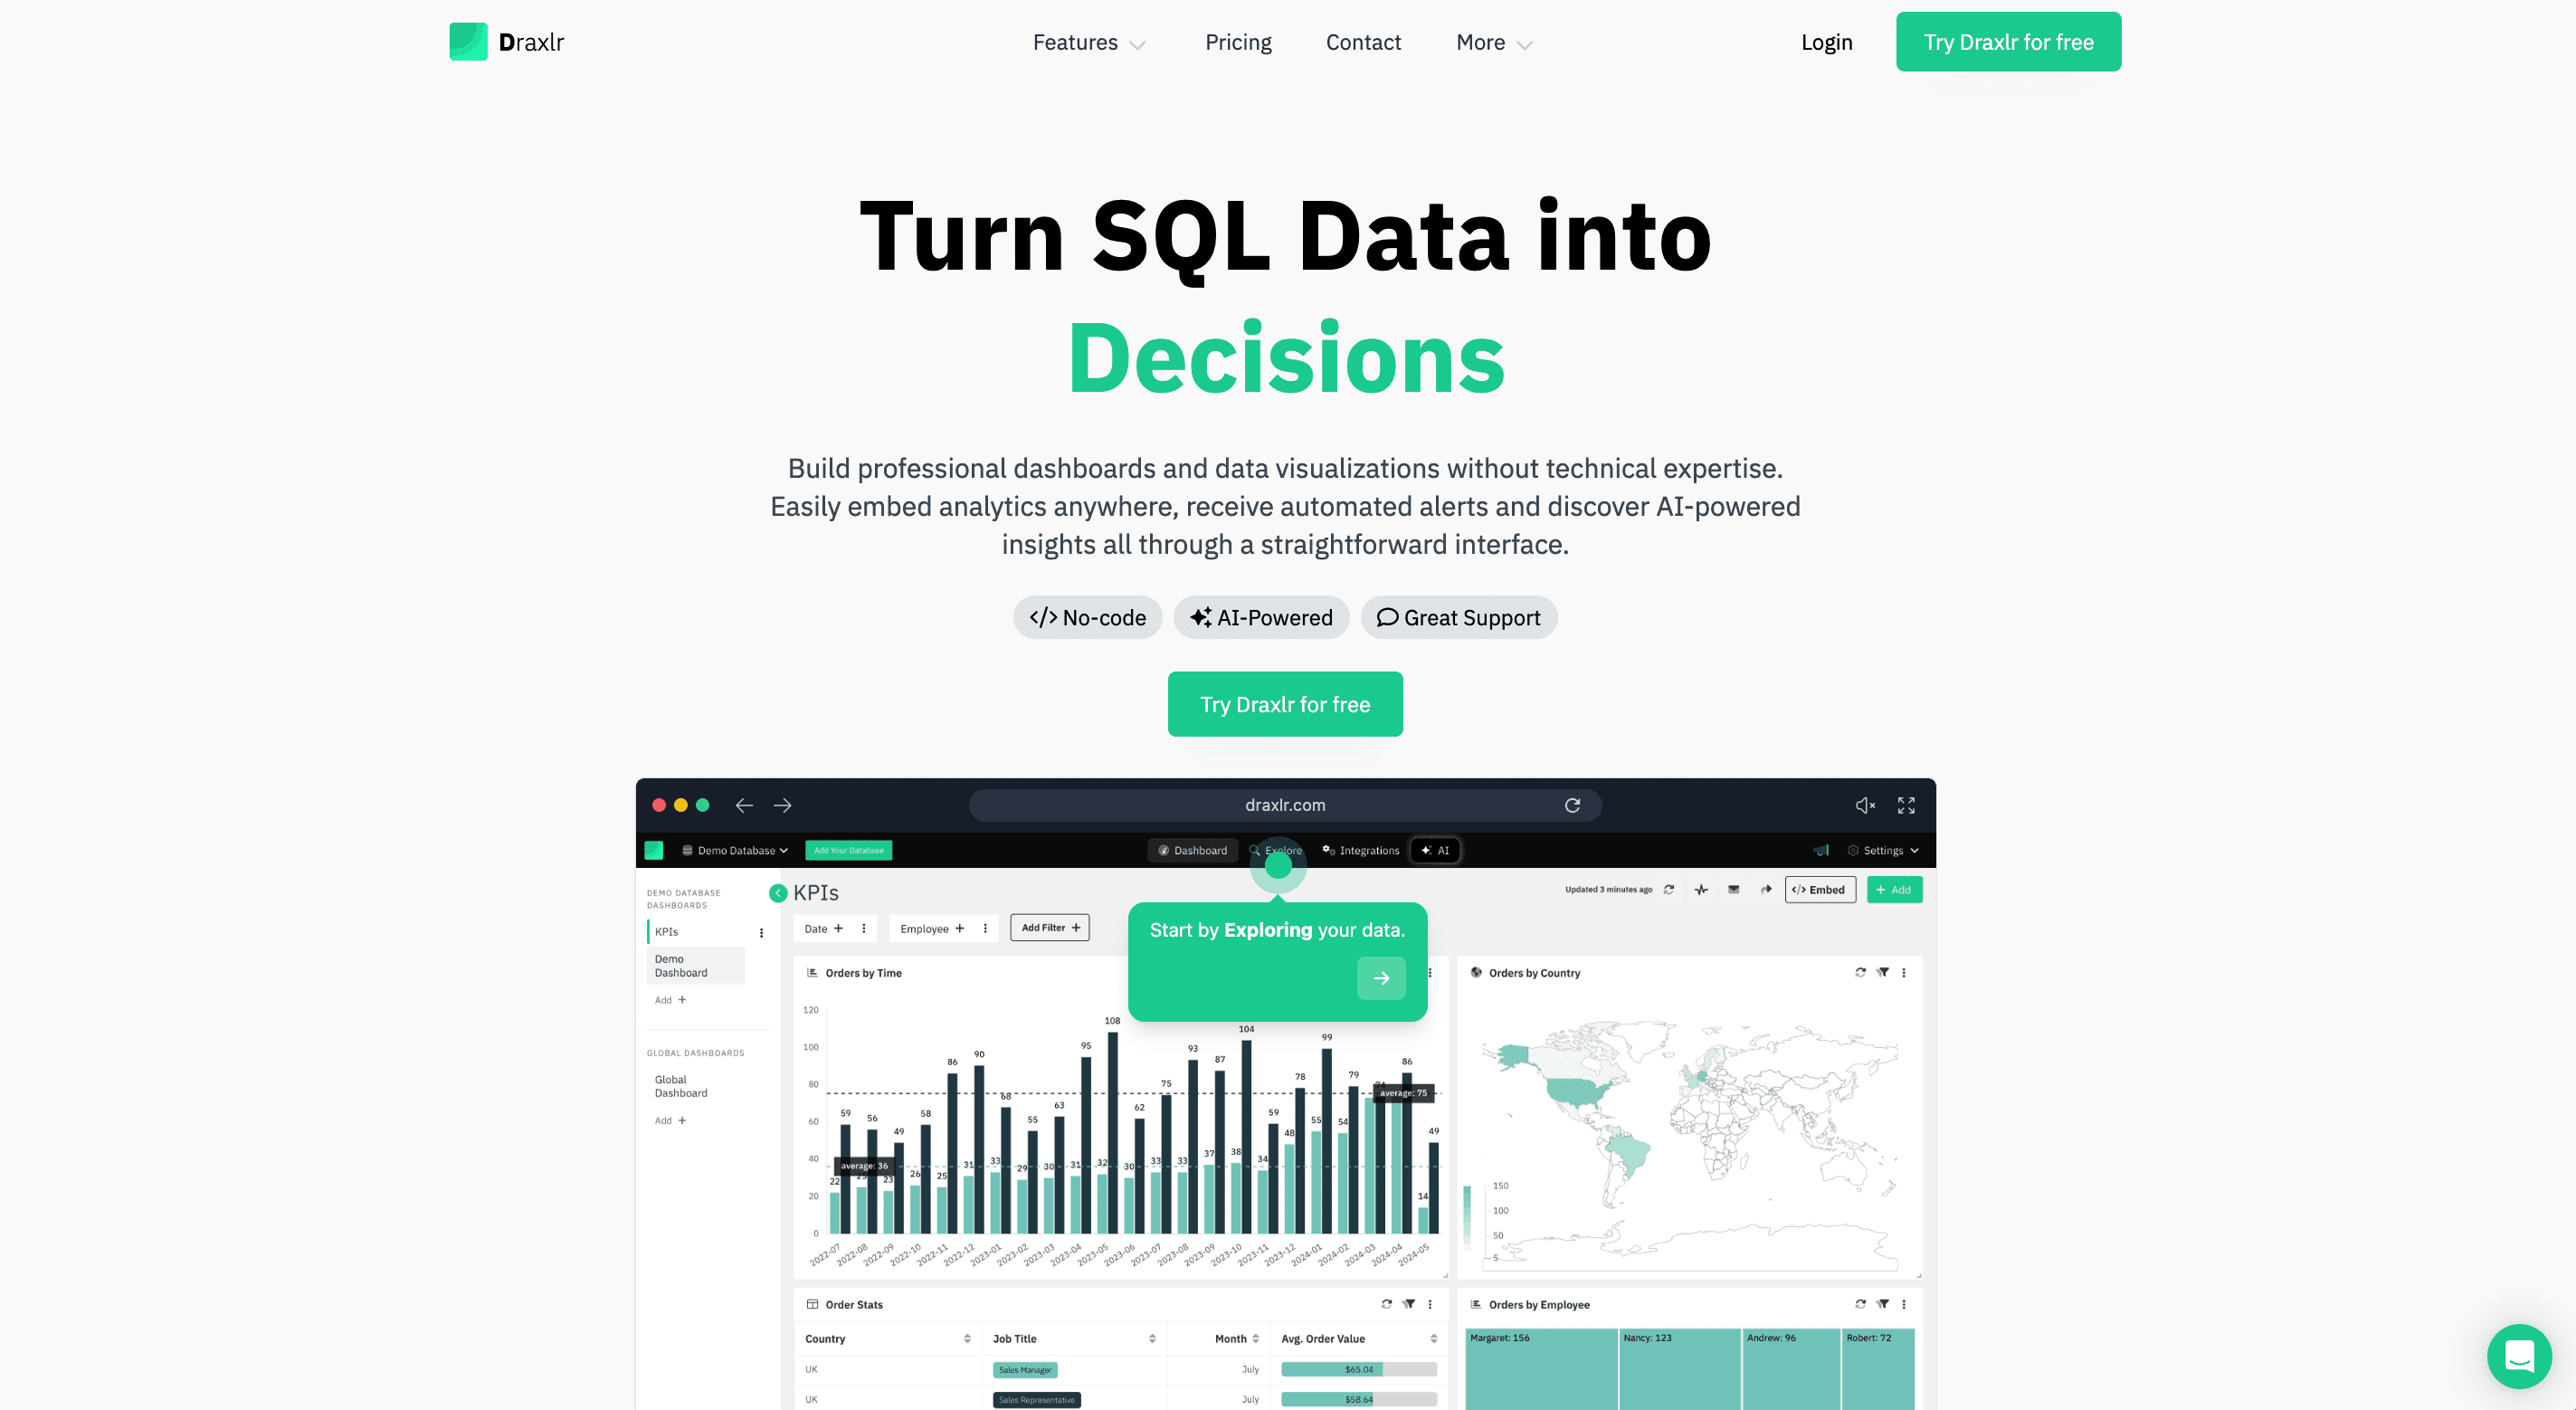
Draxlr is an intuitive Metabase alternative, blending a robust no-code query builder with AI-powered SQL generation for both non-technical and advanced users. It seamlessly integrates with various databases and provides real-time alerts through Slack, email, and more. With features like embeddable dashboards, granular team access, customizable visualizations, and live data updates, Draxlr empowers teams to dive deep into data analysis. Its user-friendly interface, coupled with excellent customer support, makes it an ideal choice for businesses of all sizes.
Connect your DatabaseKey features
- Offers an easy-to-use interface with a robust no-code query builder, enabling non-technical users to explore complex data, while also providing a raw query interface for technical users.
- AI-powered query generation integrates seamlessly with Draxlr, allowing users to generate SQL queries through simple text commands.
- Embeddable dashboards with domain restrictions and integrated filters.
- Granular team access, allows the invitation of multiple team members and assign each member read, full, or admin access.
- Connects seamlessly with a wide range of databases, including PostgreSQL, MySQL, MariaDB, PlanetScale, YugabyteDB, CockroachDB, Supabase, ClickHouse, Airtable and more.
- Real-time alerts through Slack, email, API integration, and Google Sheets, ensuring you never miss critical updates or changes in your data.
- Supports a variety of charts and graphs, including Bar, Pie, Area, Tree Map, Box & Whisker, Funnel, Line and more.
- Executes complex database operations like joins, summarizations, and groupings with just a few clicks using the intuitive query builder, making data analysis accessible even without advanced coding skills.
- Customizable, multi-element dashboards for in-depth data analysis and visualization.
- Flexible dashboard sharing options, share publicly or keep them private with secure PIN access.
- Excellent customer support through chat and email, ensuring prompt assistance and issue resolution.
- Simple and user-friendly interface with a minimal learning curve, making it accessible for users of all skill levels.
- Deep data exploration with customizable drill-down functionality, enabling users to start with high-level metrics and dig into the underlying details for more granular insights.
- Live dashboard mode automatically refreshes the dashboard every few minutes, providing up-to-date data and real-time insights.
- Sort query results on-the-fly by any column for more efficient data analysis and decision-making.
- Easily invite multiple team members to collaborate within Draxlr, enhancing data analysis and dashboard creation through collective effort.
How to build dashboards from a SQL database in minutes with Draxlr:
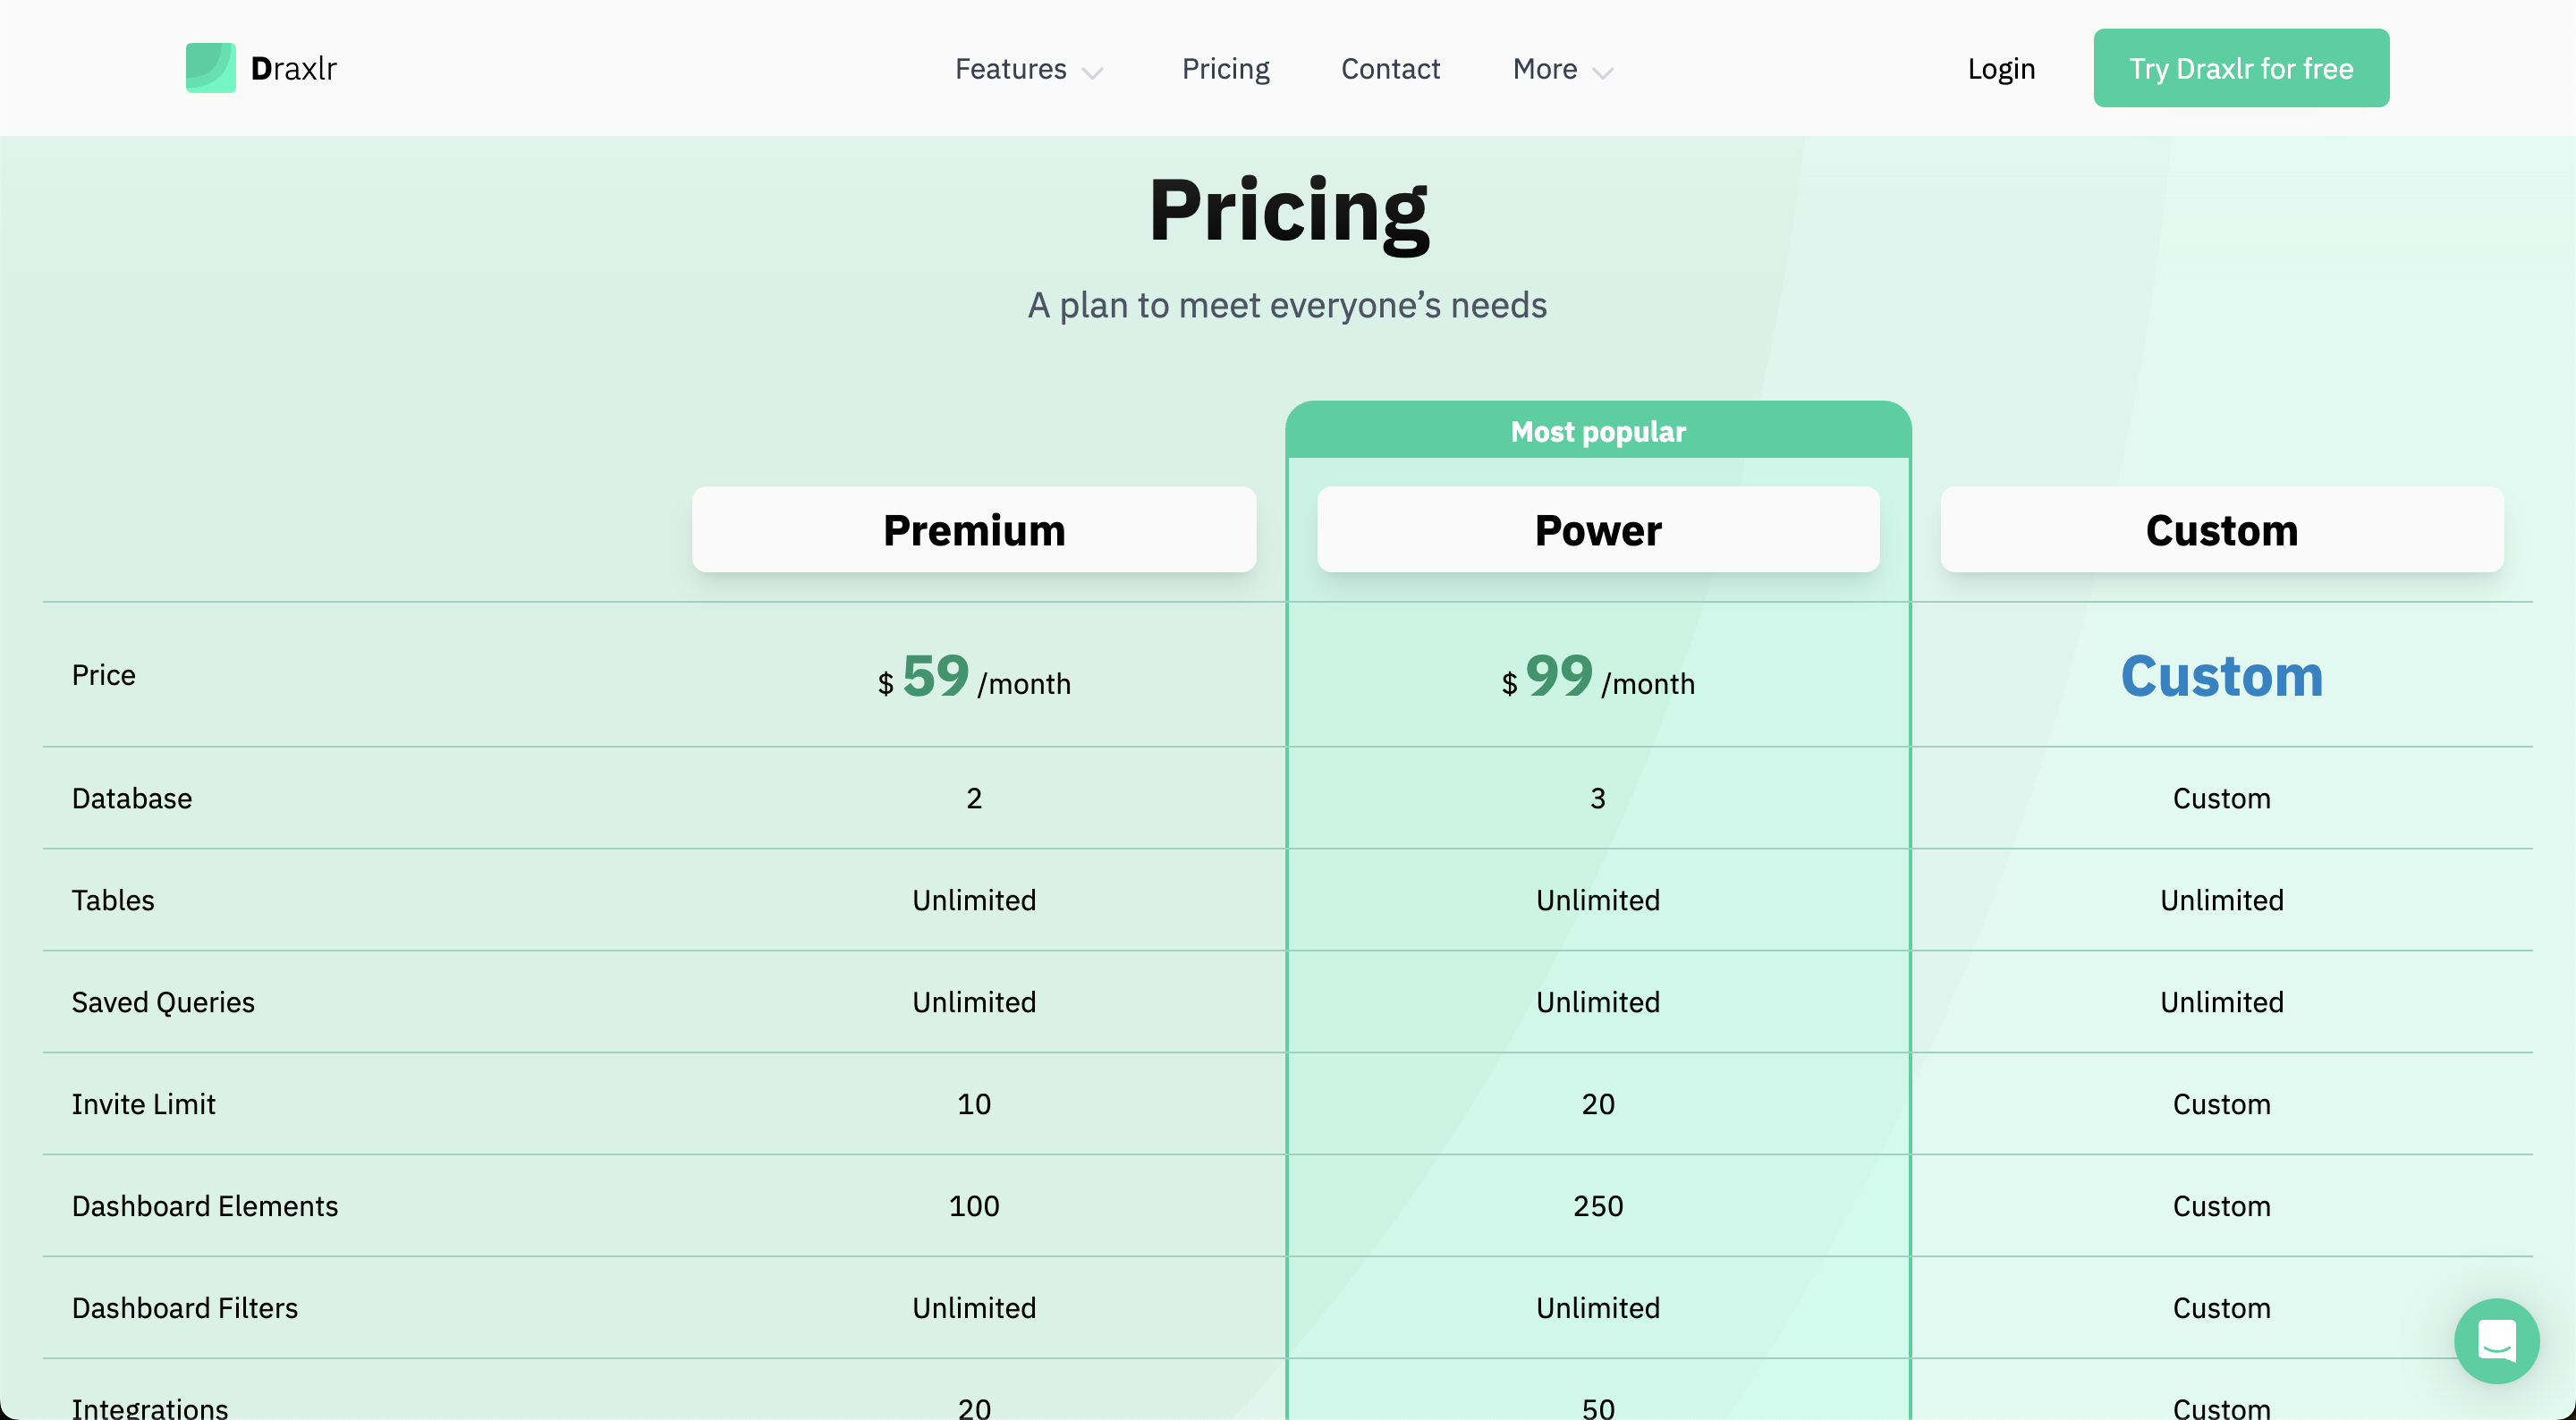
Pricing
Draxlr offers a flat, transparent pricing plan to fit different business needs. Users can select a plan that best suits their data analysis requirements, ensuring they only pay for what they need without hidden costs.
2. Tableau
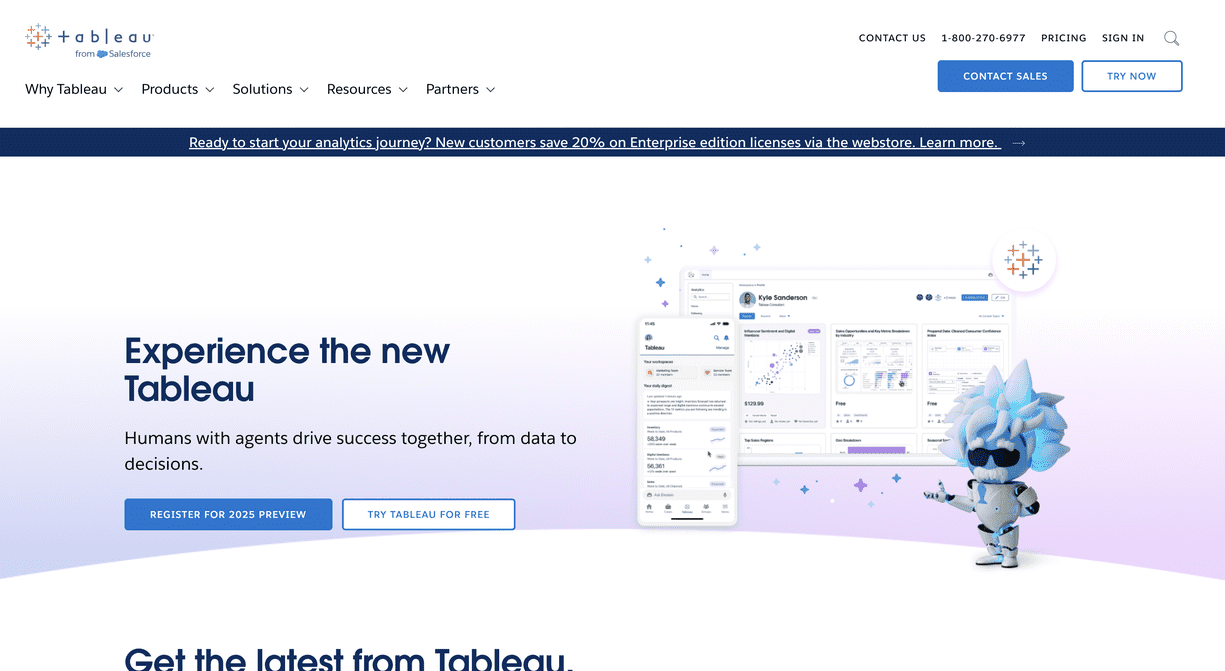
Tableau is a powerful salesforce-owned Metabase alternative that transforms raw data into interactive dashboards, enabling teams to quickly visualize and understand complex insights. It integrates with multiple data sources for real-time analysis and supports non-technical users with its intuitive, drag-and-drop interface, allowing for the creation of sophisticated visualizations without coding.
Key features
- Drag-and-drop interface for easy creation of customizable dashboards and visualizations without coding.
- Broad range of charts and maps, from simple bar charts to complex geographic visualizations.
- Seamless integration with multiple data sources, including SQL, NoSQL, Google Analytics, AWS, and Excel spreadsheets.
- Customizable visualizations with advanced features like parameters and calculated fields.
- Seamless data integration supporting large datasets and embedded visuals on websites or apps.
- Strong community with recognized certifications and a free plan for students and instructors.
- Predictive analytics through drill-down capabilities for uncovering hidden patterns and trends.
- Supports multiple datasets simultaneously and offers flexible, complex visualizations.
- Data version history allows users to download and use older versions of their data sources, enhancing flexibility and reliability in analysis.
Major Drawbacks
- Steep learning curve to use the product, requiring significant time and effort to master.
- High costs can be a barrier, particularly for smaller businesses and startups.
- Stability issues with large datasets, causing performance lags.
- Paid support plans, requiring a subscription for assistance.
- Challenging report searchability, especially when managing numerous reports, making it harder to find specific ones.
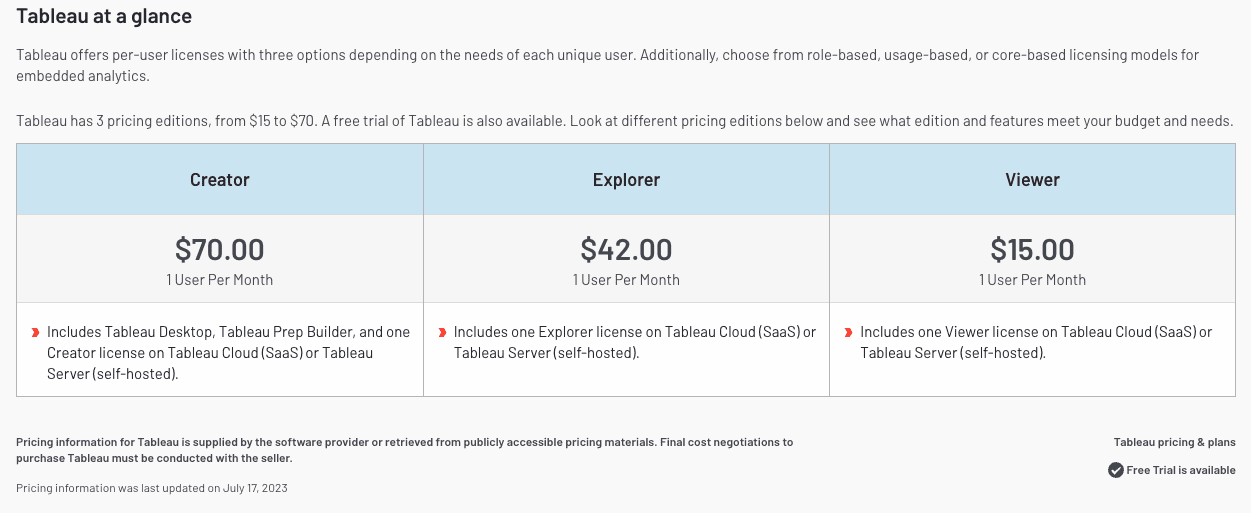
Pricing
Tableau offers a per-user pricing model designed to accommodate various user needs and deployment methods.
You can read about alternatives of Tableau here: 7 Tableau Alternatives.
3. Domo
Domo is a robust BI tool known for its ease of use and powerful data aggregation capabilities. It allows users to effortlessly combine data from various sources, apply advanced formulas, and create comprehensive views for accurate analysis.
Key features
- Real-time data insights with customizable dashboards that allow interactive data filtering and drill-down.
- Rapid data loading and customizable dashboards with parameterized charts and flexible visualizations.
- Seamless integration with numerous enterprise applications through custom connectors, supporting various data sources.
- Powerful ETL tools for migrating data from spreadsheets and other sources, making data preparation simple.
- Mobile accessibility through Domo's app, allowing users to access data and stay informed on the go.
- API integration for almost any application, making it easy to connect other apps to Domo without advanced coding skills.
Major Drawbacks
- Limited training resources with fragmented videos instead of comprehensive end-to-end tutorials.
- Inflexible data extraction into Excel, limiting ease of data portability.
- Steep learning curve for advanced features, requiring additional training, especially for users new to data analytics tools.
- Limited visualization options and pre-built templates, which restrict customization.
- High cost compared to other BI tools, especially when using separate user accounts.
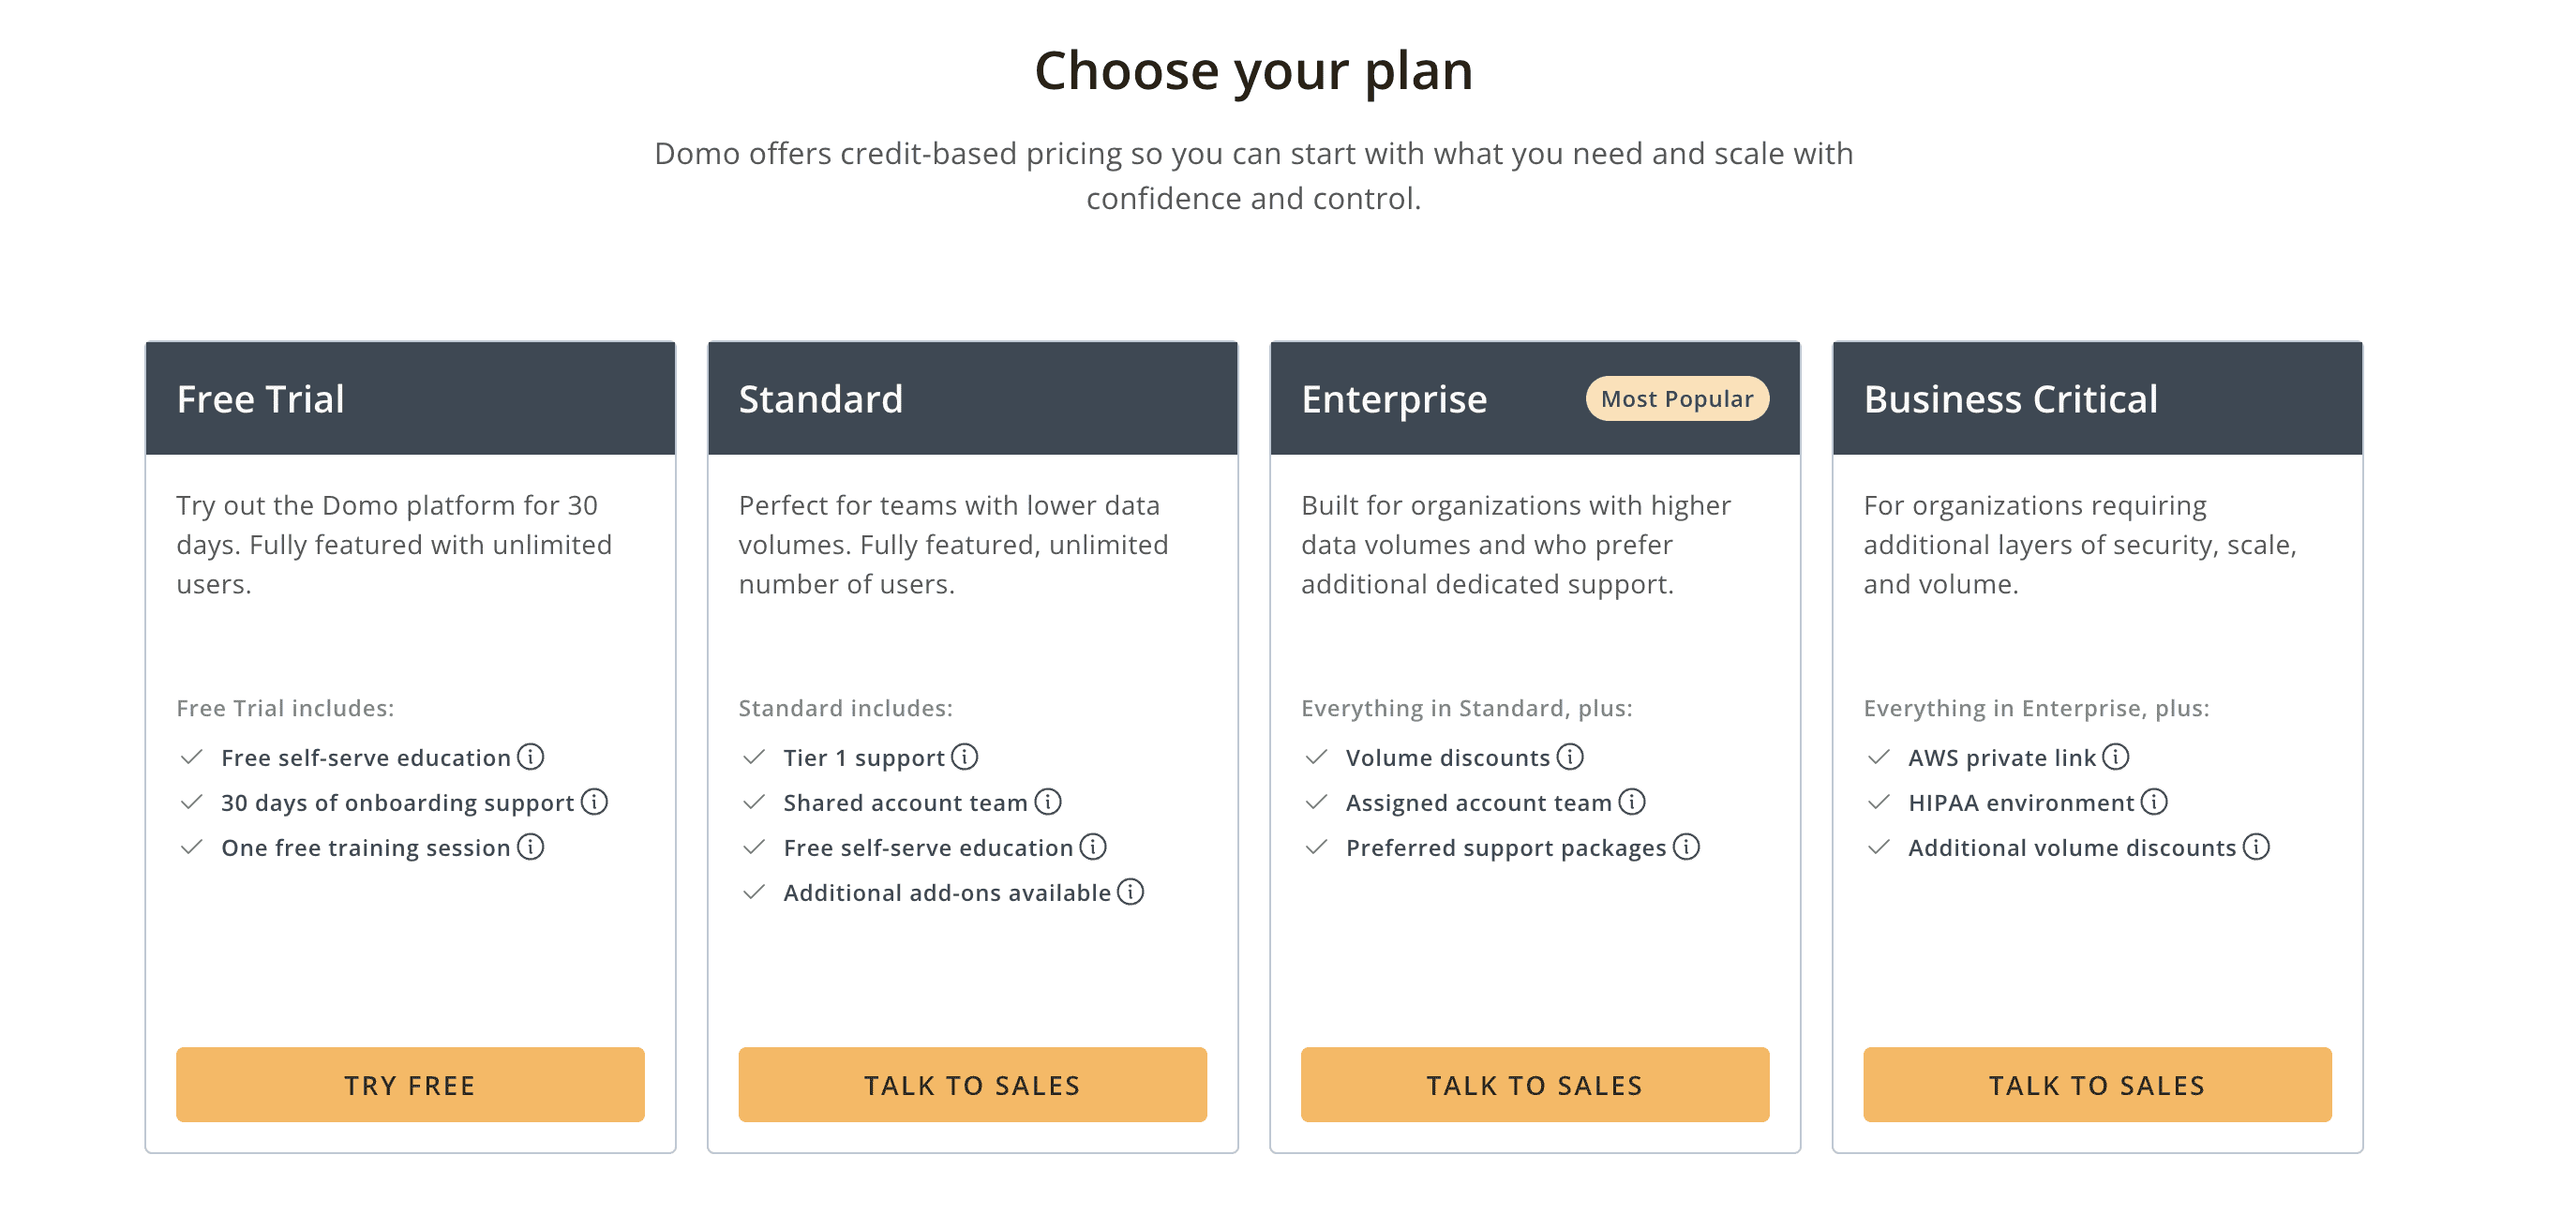
Pricing
Domo's credit-based pricing can be unclear, as it requires a discussion with the sales team to receive a specific quote.
4. Power BI
Power BI is a versatile business analytics tool that allows users to create interactive dashboards, visualize data from various sources, and gain real-time insights. It integrates seamlessly with the Microsoft ecosystem with Azure, Office 365 and offers robust data analysis capabilities, including AI and machine learning features.
Key features
- Rich data source connectors with effortless integration to Excel, SQL, Azure, Splunk, and cloud services.
- Row-level security to ensure data privacy by controlling access based on user roles.
- Powerful data transformation using Query Editor and Applied Steps for streamlined data cleaning and modeling.
- Robust visualization capabilities with interactive dashboards featuring charts, graphs, maps, and tables.
- Real-time analytics for live data tracking and instant insights.
- Extensive customization options including DAX language, R, and Python for advanced analytics.
- Excellent Microsoft integration for seamless use with Excel, Azure, and other Microsoft products.
- AI integration to uncover hidden insights, enabling advanced data analysis.
Major Drawbacks
- Steep learning curve for beginners, particularly for advanced features and DAX expressions and complex setup for non-technical users.
- Limited customer support available mainly through email and blogs, making it hard to get direct assistance.
- Costly licensing and a confusing pricing structure, which can be restrictive for small businesses.
- Frequent software updates can be tricky to manage, causing compatibility issues.
- Limited drill-down and customization options compared to other tools.
- Dependency on the Microsoft ecosystem restricts integration with non-Microsoft services.
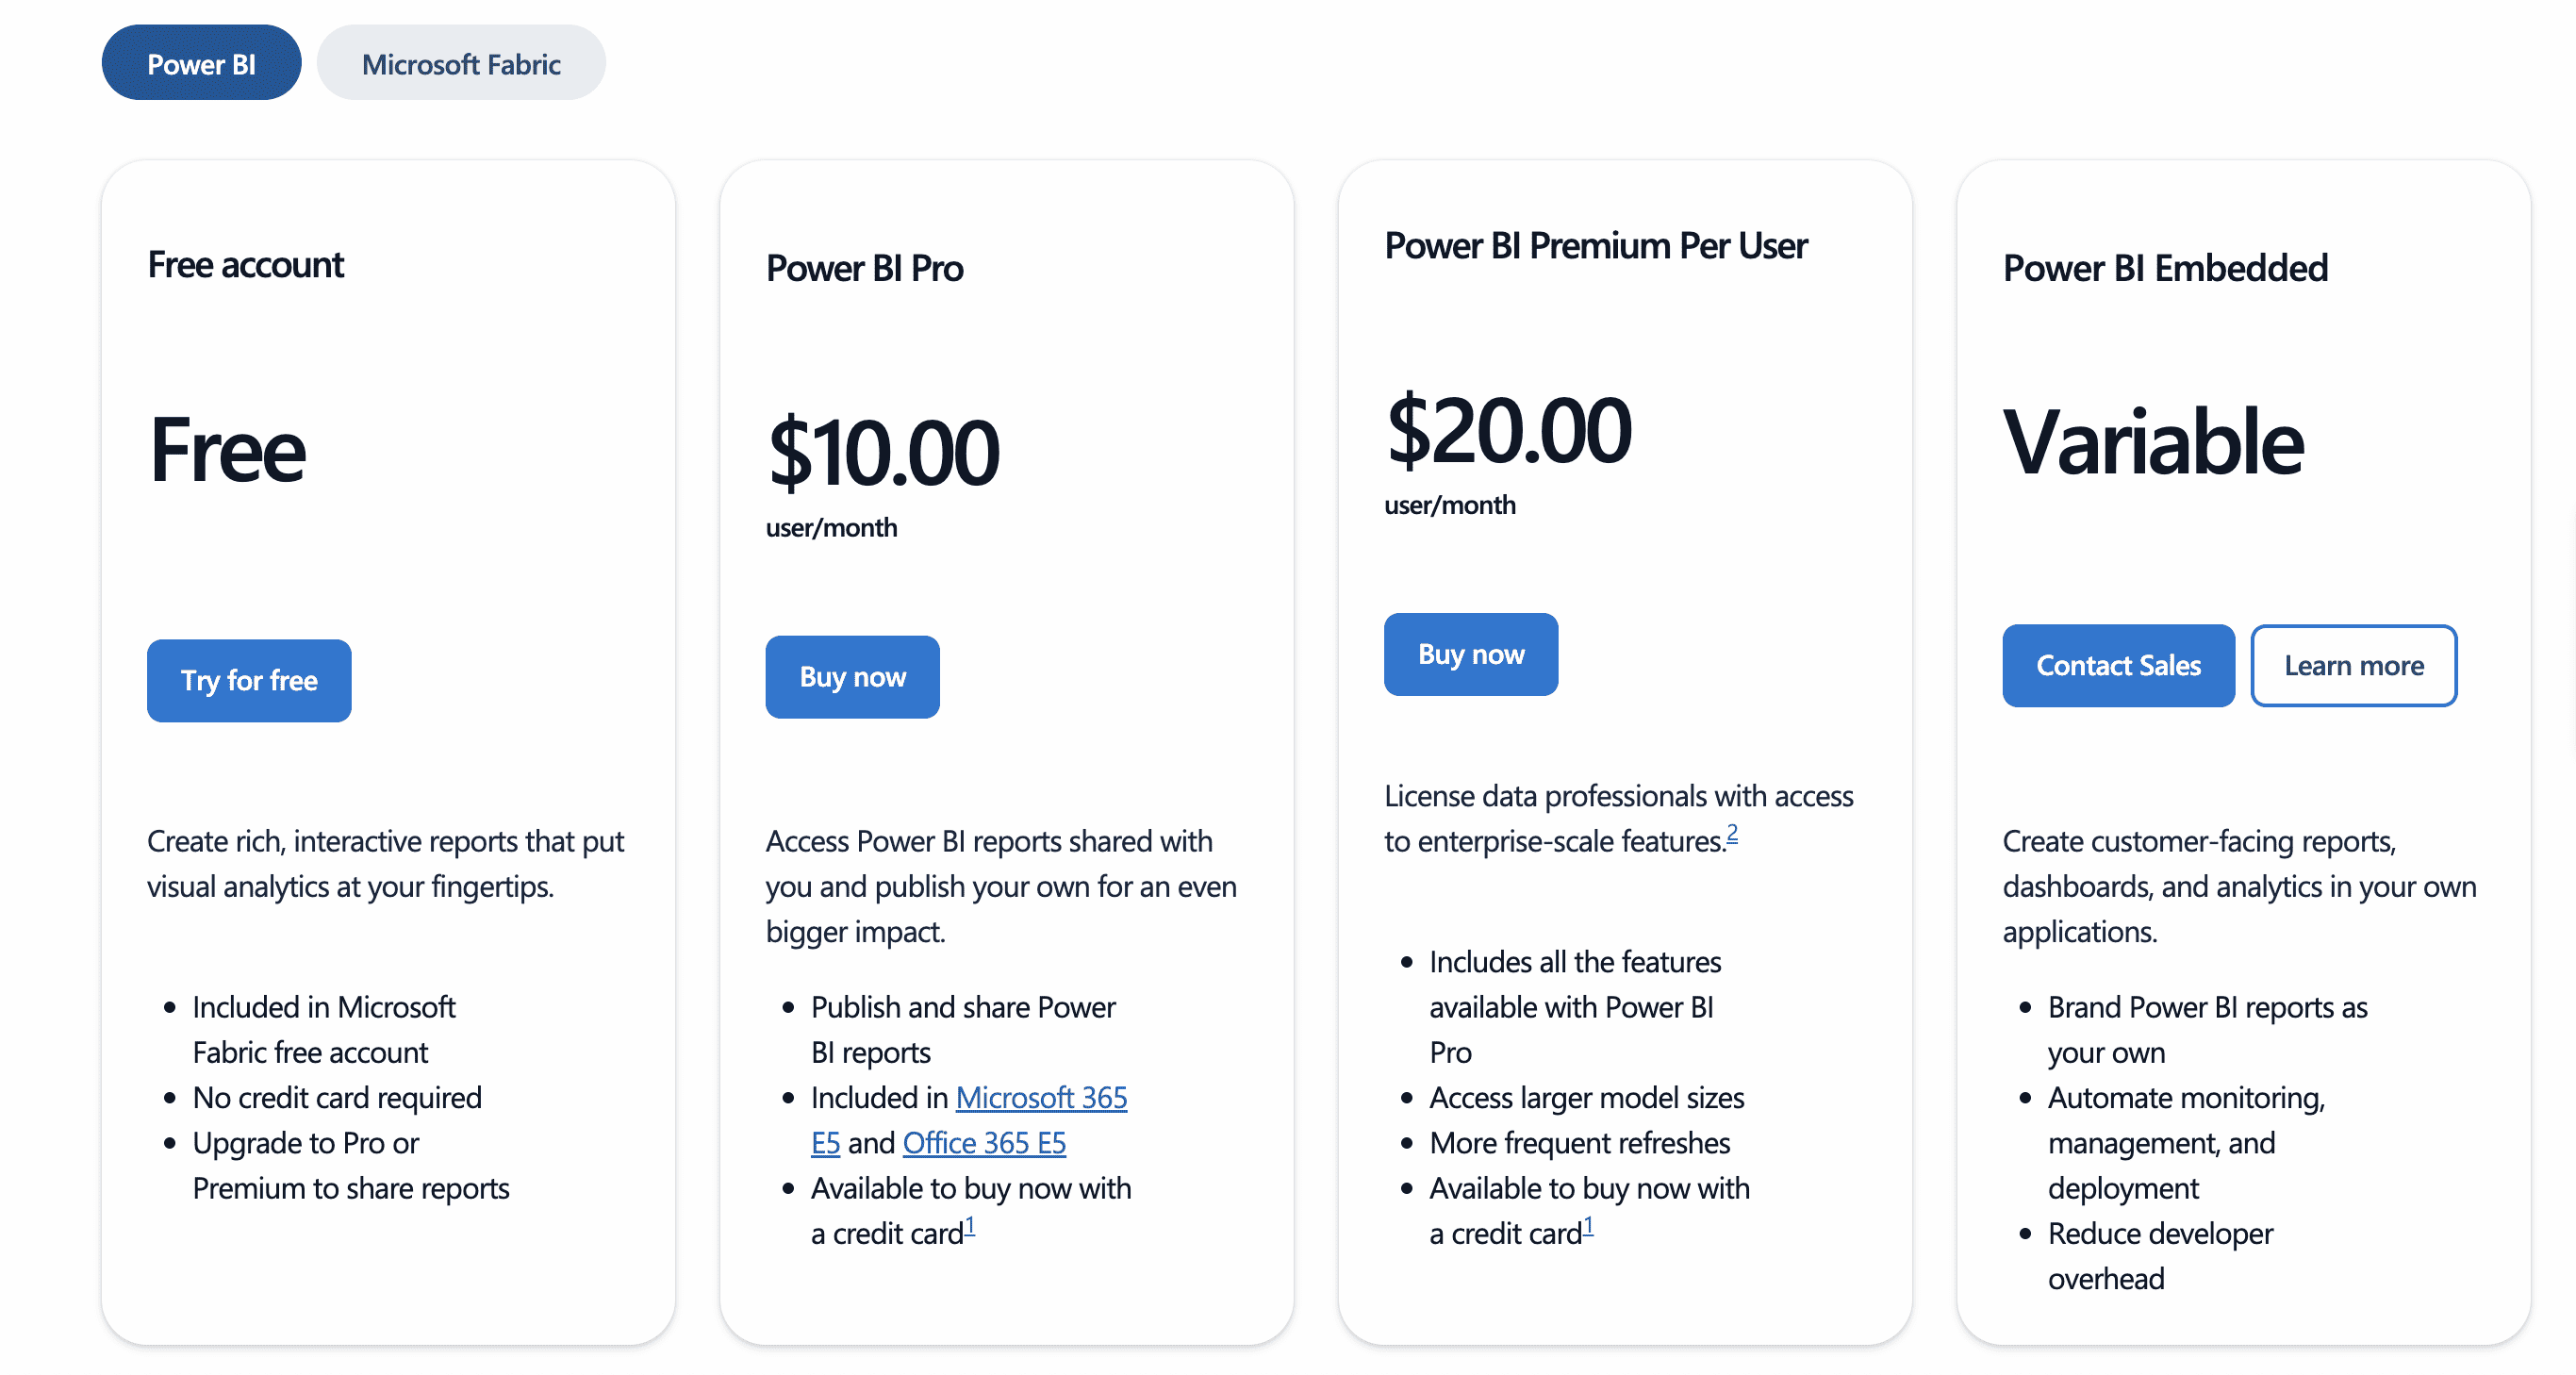
Pricing
It offers multiple pricing options, including a free version for individual users and paid plans like Power BI Pro and Power BI Premium. Pricing is based on user and capacity needs.
5. Looker
Looker is a leading business intelligence tool acquired by Google and offers powerful data analysis and reporting capabilities. It provides an intuitive, user-friendly interface and seamless integration with various data sources, including Google Sheets and Docs.
Key features
- Supports data blending to combine information from different sources into a single dashboard for a holistic view.
- Advanced data modeling with LookML for building complex data relationships and reusable business logic.
- Customizable visualizations offering a wide range of charts and graphs, with advanced drill-down options for interactive dashboards.
- Real-time data insights with live updates, supporting timely decision-making.
- Automated data import for maintaining up-to-date reports without manual intervention.
- Flexible data sharing options, including CSV, Excel, and PDF formats, for distributing information efficiently.
- Robust security features like row-level security to control data visibility based on user roles.
- Collaboration-friendly environment allowing multiple users to work on reports and analysis simultaneously.
- Integration with Google ecosystem for seamless use with Google products like Google Ads and BigQuery.
- Scalable for enterprises with advanced triggers, APIs, and the ability to handle large data volumes.
Major Drawbacks
- Slow performance when handling large datasets, leading to delays and the need for multiple refreshes.
- Lack of advanced BI features compared to other enterprise options, impacting in-depth analysis.
- UI and UX limitations with a dated design and sometimes confusing navigation for new users.
- Limited free version with constraints on data volume and access, requiring a paid plan for more robust analysis.
- Steep learning curve for new users, especially when dealing with advanced features and LookML.
- Slow customer support response times, leading to delays in issue resolution.
Pricing
Looker uses a custom pricing model based on factors like the number of users, data volume, and deployment needs. Pricing starts from $2,000 per month(source: capterra), making it a relatively expensive tool.

You can read about alternatives of Looker here: 5 Looker Alternatives.
6. Holistics
Holistics is a versatile BI platform ideal for companies looking to scale their data operations. It promotes a self-service data culture, allowing all teams to access and analyze data securely through interactive dashboards. With features like password-protected sharing, Slack integration, and fast report-building, it offers a balance between technical integration and user accessibility.
Key features
- Flexible self-service options for business users with drag-and-drop functionality and intuitive report creation.
- Good integration with dbt and GitHub, supporting a modern data stack with smooth data modeling and transformation.
- Centralized and reusable analytics logic using SQL-based data models, reducing duplication and simplifying maintenance.
- Robust access control with secure sharing options tailored to different user groups and dashboards.
- Dynamic filter functions and cross-filter options, enhancing user experience and reducing data preparation time.
- Extensive customization options in dashboards, charts, and visualizations, supporting both simple and advanced use cases.
- Automation and scheduling with features like email scheduling, Slack notifications, and scheduled exports.
Major Drawbacks
- Initial learning curve due to limited documentation and UI difficulties, making it challenging for new users.
- Limited visualization options and design flexibility, lacking features like drill-down reports and advanced customization.
- SQL dependency limits ease of use, requiring technical knowledge, making it less accessible for non-technical users.
- Access control limitations with less granular settings, making it difficult to manage complex user permissions.
- Limited APIs and integrations reducing flexibility for advanced organizations and specific use cases.
- Pricing complexity and potential for higher costs, especially when scaling up for larger organizations.
Pricing
The Holistics pricing model typically varies based on the number of users, data sources, and feature requirements. For specific pricing details, customers are encouraged to contact Holistics directly.
Find the right Metabase alternative for you
We’ve taken a journey exploring top metabase alternatives, each offering a unique flavour. Remember, the best BI tool is the one that integrates seamlessly with your workflow, matches your budget, and ultimately helps your team close to the insights.
If customer support and ease of use are priorities, Draxlr stands out with its responsive service, low learning curve, and affordability
Take your time to experiment with these options to find the perfect fit for your team. Happy exploring!
FAQs
1. What is better than Metabase?
This depends on specific needs. If customer support, affordable pricing and ease of learning is the priority then use tools like Draxlr. It avoids overwhelming you with unnecessary complexity. Other BI tools like Tableau, Power BI, Looker, and Holistics are more costly or require more technical expertise.
2. What are the disadvantages of Metabase?
The disadvantages of Metabase include the need for technical expertise during setup, especially for on-premise deployment. The pricing increases with each additional user, making it costly for larger teams. Free users have limited support options, and advanced data security measures often require integration with separate tools.
3. Can I use Metabase for free?
The answer is yes and no. Metabase offers an open-source version that is free to use. However, many advanced features are only available in the paid versions.
4. How do I know which Metabase alternative is the best fit for my business?
To find the best Metabase alternative for your business, start by listing your specific requirements, such as customer support, data integrations, visualization options, user access controls, and budget. Compare these needs with the features of other BI tools like Draxlr, Tableau, Power BI, Looker, or Holistics. Once you've identified a few suitable options, take advantage of free trials to evaluate their usability and fit for your team.
5. What are Metabase competitors?
Competitors include Draxlr, Tableau, Power BI, Looker, Holistics, Redash, and Superset, each offering various features for different business intelligence needs.

