How to create a Pivot Table from SQL Data
Create Pivot Tables from SQL Data without code. Ideal for business users: build, analyze, and share pivot table visually using tools like Draxlr.

Introduction: What is a Pivot Table?
Creating Pivot Tables from SQL Data helps organize large datasets into readable summaries. In this guide, we’ll walk through how to a Create Pivot Table in SQL and how tools like Draxlr simplify the process.
A pivot table is a powerful data summarization tool that allows you to automatically sort, count, and total data stored in one table or spreadsheet and create a second table displaying the summarized data. It’s especially useful when you’re working with large datasets and want to explore trends, groupings, or performance insights.
Benefits of Using Pivot Tables
Pivot tables are particularly useful for:
- Aggregating sales data by region or product
- Analyzing customer behavior over time
- Generating quick summaries for reporting purposes
Creating Pivot Tables Using SQL Statements
Below, we’ll cover how to use SQL to build pivot-like views manually, an option suited for technical users who need precision and control.
One common approach to building SQL Pivot Tables involves using aggregate functions and conditional logic.
While SQL does not offer a dedicated pivot table feature, you can create pivot-like summaries using a combination of GROUP BY, CASE, and aggregate functions.
Here's an example that summarizes sales data by region, showing each product's total as a separate column:
SELECT
  region,
  SUM(CASE WHEN product = 'Product A' THEN sales ELSE 0 END) AS product_a_sales,
  SUM(CASE WHEN product = 'Product B' THEN sales ELSE 0 END) AS product_b_sales
FROM
  sales_data
GROUP BY
  region;
You can also use PIVOT operators in SQL Server, which allow you to rotate rows into columns. For example:
SELECT *
FROM (
  SELECT region, product, sales
  FROM sales_data
) AS source_table
PIVOT (
  SUM(sales)
  FOR product IN ([Product A], [Product B])
) AS pivot_table;
This query will give you a pivot-style table with regions as rows and products as columns, showing total sales per region per product. The result looks like this:
| Region | Product A Sales | Product B Sales |
|---|---|---|
| North | 1200 | 900 |
| South | 800 | 1100 |
| East | 950 | 1000 |
Limitations Compared to a tool like Draxlr:
- Writing pivot queries manually is not user-friendly and can be difficult for non-technical users.
- Modifying or customizing the pivot view is time-consuming.
- No built-in drill-down support to explore what's behind each number.
- Sharing static SQL results requires additional tools or exports.
Building Pivot Tables with Draxlr
Draxlr is a no-code BI tool that simplifies dashboard and pivot table creation from SQL databases. If you're trying to Create Pivot Table in SQL but want a faster way, Draxlr is a visual solution that eliminates the need to write raw SQL for pivoting:
-
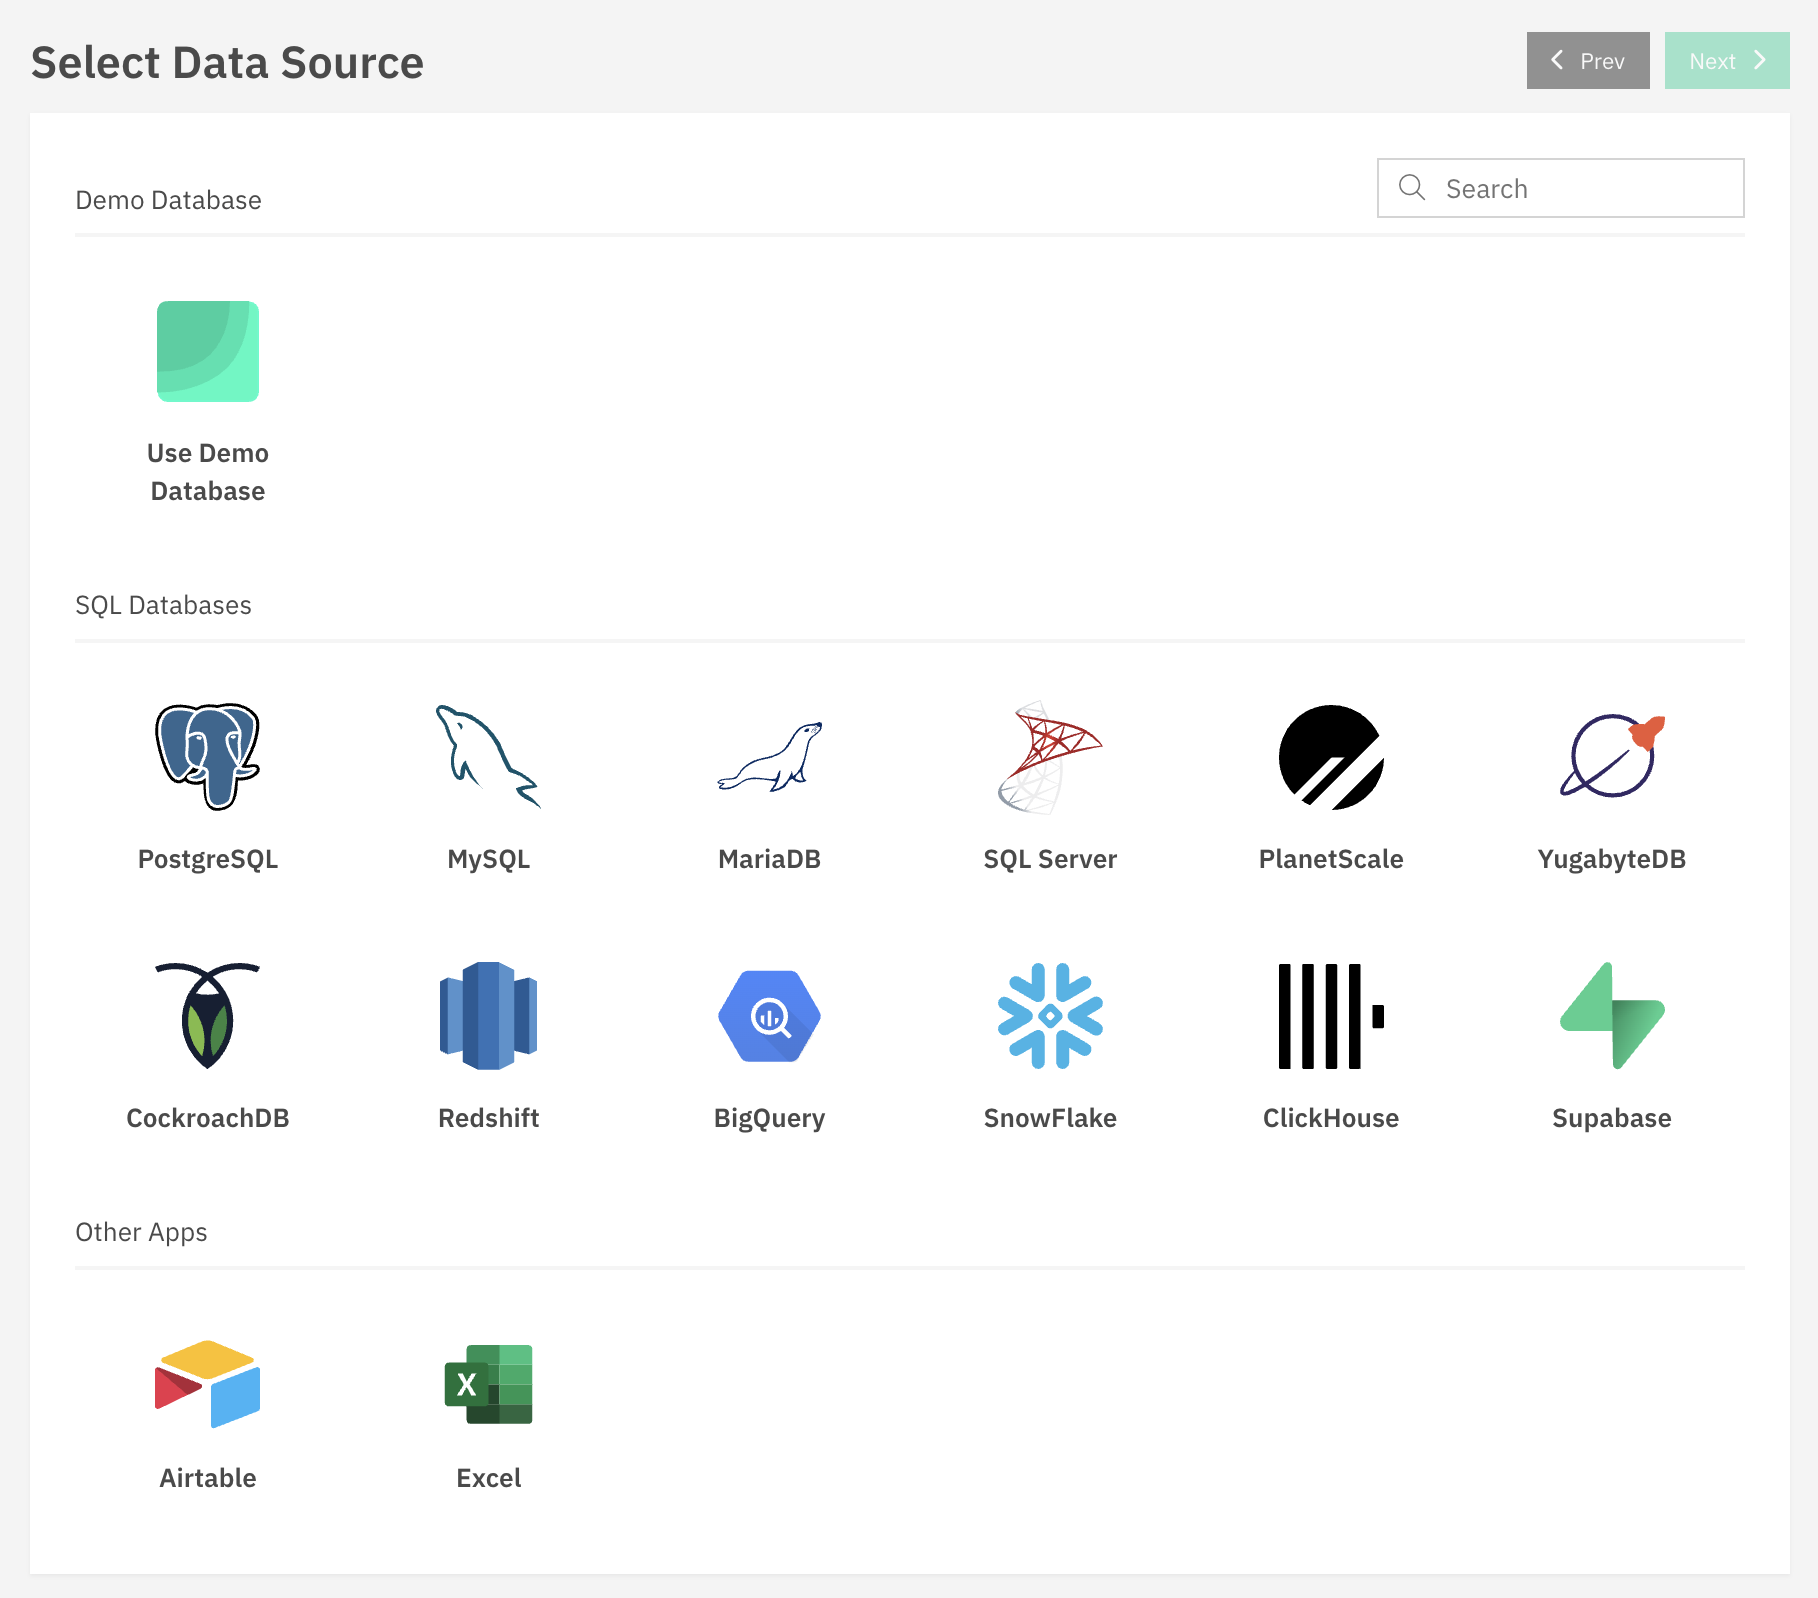
Connect Your Database
Add your SQL database by entering the required credentials.
-
Query Your Data
Use Draxlr’s query builder, AI feature, or write custom SQL queries to fetch your dataset.
-
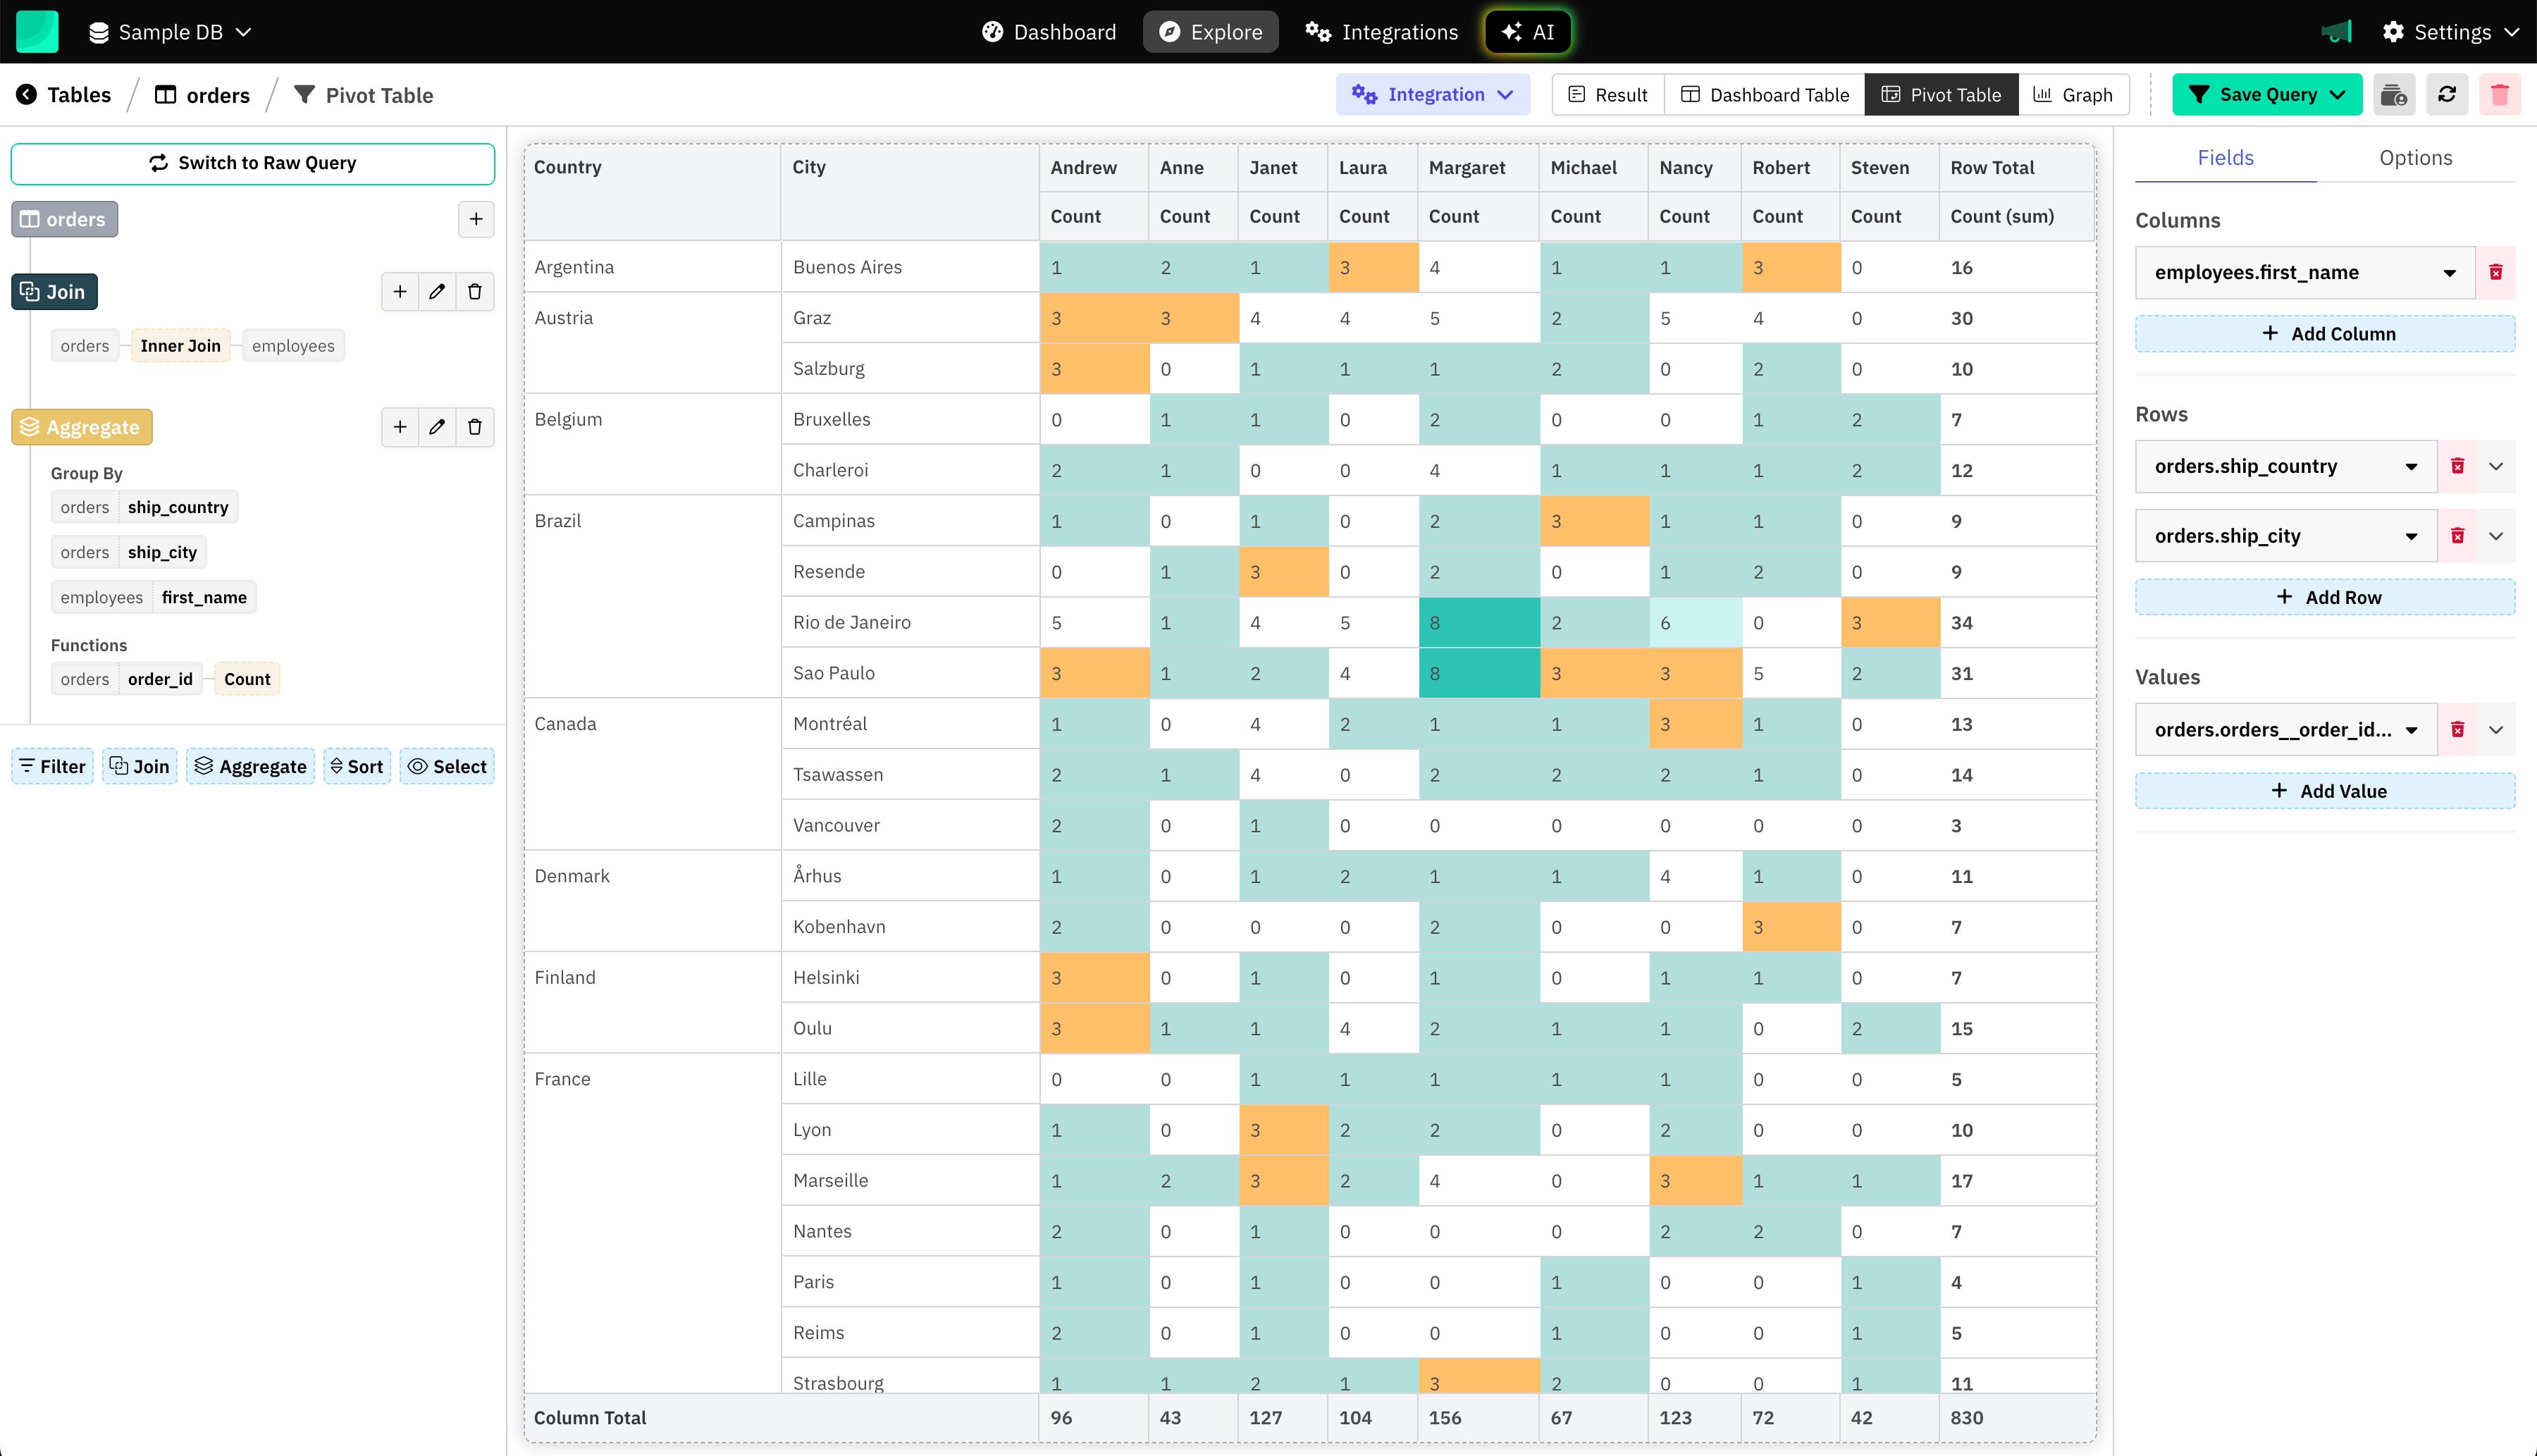
Create Pivot Table
Choose the pivot table visualization, then configure:
-
Rows, Columns, Values as needed
-
Customize the color formatting of a cell based on its value
- You can either choose a single color with conditional formatting like "highlight in red for sales number < 10"
- Or, you can choose multi-color option that breaks data into 5 segments (0-20%, 20-40%, and so on).
-
-
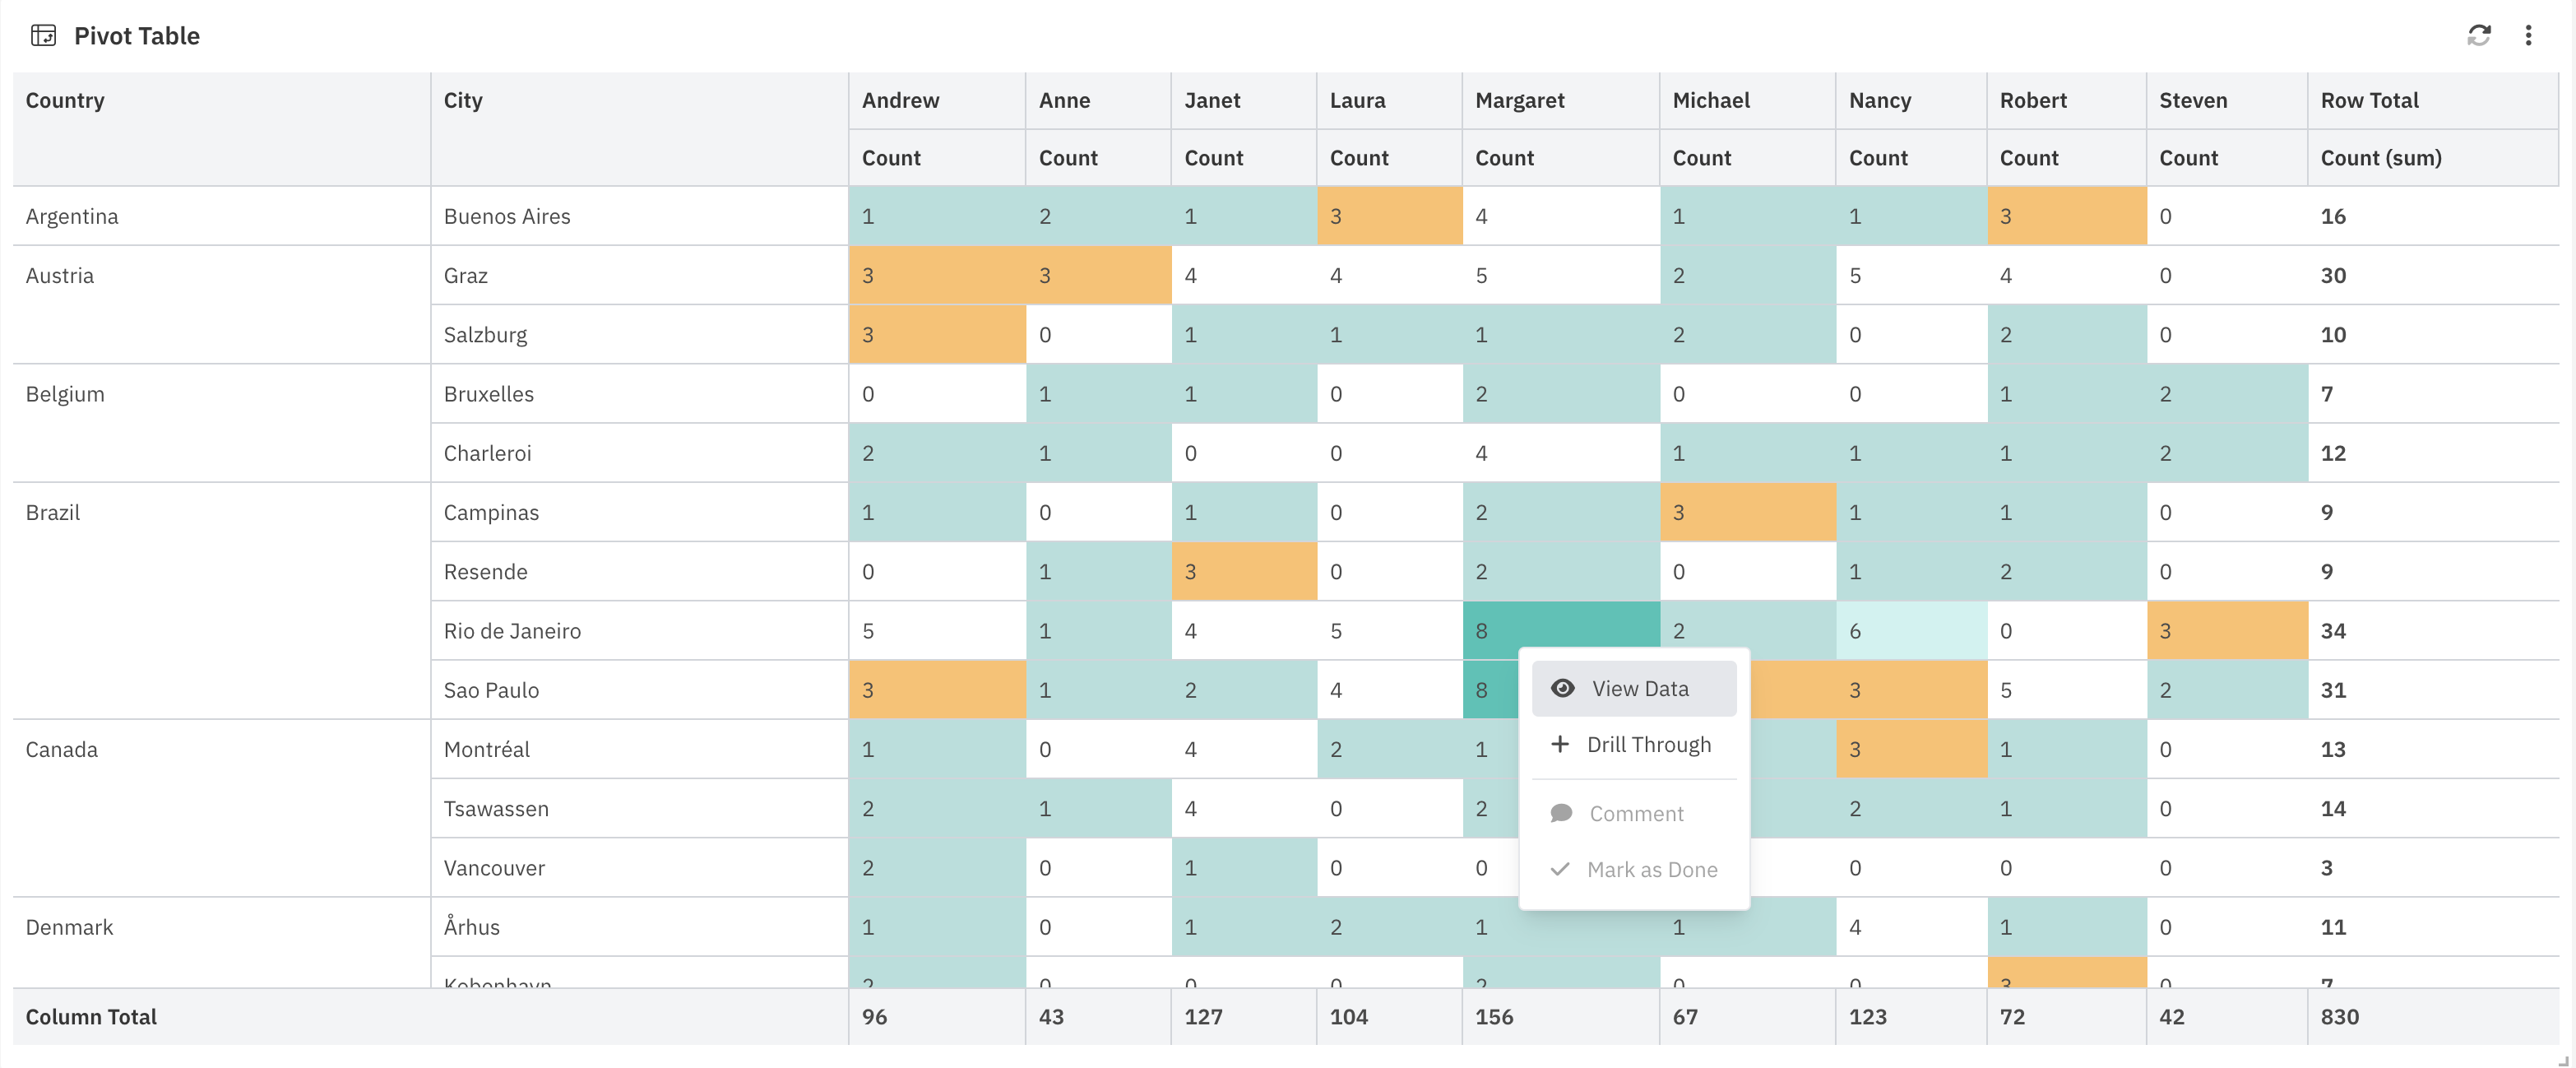
Pivot Table Drill-Down
With Draxlr, you can drill down on your pivot tables to see the data behind each table cell.
-
Add to Dashboard
Add the pivot table to your dashboard and share it with your team for collaborative analysis.
Draxlr enables interactive, real-time pivot analysis without writing code.
Real-World Use Cases of Pivot Tables
- Track monthly sales by product category and region.
- Compare ticket volume by department and issue status.
- Analyze campaign performance by channel and time period.
- Evaluate support response times across different teams.
When Should You Use SQL vs. a Tool Like Draxlr?
Use raw SQL when:
- You need complete control over data transformation.
- You’re working within a backend service or need custom logic.
- You're comfortable writing and debugging SQL queries.
Use Draxlr when:
- You want to build visual pivot tables quickly.
- You don’t want to write or maintain SQL code.
- You need to collaborate and share dashboards easily.
Conclusion
Whether you’re using manual SQL Pivot Table queries or working with a tool like Draxlr, there are multiple ways to build Pivot Tables from SQL Data depending on your technical comfort level.
Creating pivot tables from SQL data is a powerful way to analyze and interpret datasets. Writing SQL-based pivot queries is possible but comes with limitations. Draxlr streamlines the process, making pivot creation more accessible, visual, and collaborative.
FAQs
1: What’s the easiest way for a non-technical user to create pivot tables from SQL data?
Using a no-code tool like Draxlr is the easiest way. It connects directly to your SQL database and offers a visual interface to build pivot tables, no SQL knowledge required.
2: Do I need to know SQL to use Draxlr?
No. Draxlr’s visual query builder lets you create pivot tables without writing SQL.
3: Can I share pivot tables created in Draxlr?
Yes. You can share dashboards or individual pivot tables with others.

